
EB Weekly Portfolio Report - Sunday, July 16, 2023
Upcoming Earnings Reports
According to Zacks.com, the following companies will be reporting earnings this week and each is a component of one of our portfolios:
Monday, July 17: None
Tuesday, July 18: None
Wednesday, July 19: LVS
Thursday, July 20: ISRG
Friday, July 21: None
PLEASE NOTE: The above companies were provided using Zacks.com. We do hold our portfolio stocks through one earnings report, but every EarningsBeats.com member must make his/her own investing/trading decisions about holding stocks into earnings reports as it's the most volatile (risky) time to own a stock.
Portfolio Rules and Objectives
Here are the common traits and objectives of our portfolios:
- There are 10 leading stocks from up to 10 leading industries in each portfolio (at the time of selection). Generally, there will only be one stock per industry group, but there could be exceptions.
- They are typically held for an entire 90-day period, with no stops in place. We strive for consistency, transparency, and simplicity in our portfolios. EB.com members may hold these stocks for the entire 90 days, trade them, use stops, etc., but for purposes of our calculation, we will likely make no exceptions to our "buy and hold for three months" strategy.
- Every stock will generally be held through ONE earnings report
- The expectation is that relative winners will carry the portfolio to outperformance
- All portfolio stocks were announced on Thursday, May 18th, and were all entered into as of the close on Friday, May 19th for tracking purposes
- Primary objective is to outperform the benchmark S&P 500 over time; quarter-to-quarter performance can be extremely volatile, especially if significant rotation takes place intra-quarter
Here are several considerations for EB members:
- The Income Portfolio should have the least amount of volatility as it will typically be comprised of quality large cap stocks with solid dividends
- The Model and Aggressive Portfolios should be viewed similar to aggressive growth funds; they will typically have a lot of volatility and periodic drawdowns can be significant from time to time
- The Income portfolio stocks will all pay dividends, with the expected average dividend yield to be at least 1.0%
- Drawdowns (losses) should be much milder on the Income portfolio, with more volatility expected on the other two; please review inception-to-date charts below to gain an idea of the volatility associated with each
- I believe the larger drawdown on the Income portfolio at the beginning of the pandemic was an anomaly, occurring as many defensive, higher-yielding companies uncharacteristically underperformed during a market decline.
- Large drawdowns in the February through May 2021 and the November 2021 to February 2022 periods were due to the rapid rotation from growth stocks to value stocks; each quarter, our portfolios are based on themes and there is never a guarantee that our analysis and beliefs will be proven correct
- Consider owning or trading these stocks in whatever manner is most comfortable for you; while we will buy all 10 stocks in the manner identified above, feel free to trade certain stocks or wait for pullbacks if the stocks are overbought
- We have no idea what risk each member is willing or able to take. We are not registered investment advisors so be sure you understand the risk you take. Please consult your financial advisor.
- EarningsBeats.com shareholders/employees may own all or some of the portfolio stocks from time to time.
Weekly Snapshot
Here's a weekly recap:
- S&P 500: +2.42%
- Model Portfolio: -2.34%
- Aggressive Portfolio: +2.65%
- Income Portfolio: +2.73%
- Model ETF Portfolio: +3.33%
Weekly Summary
Benchmark S&P 500:
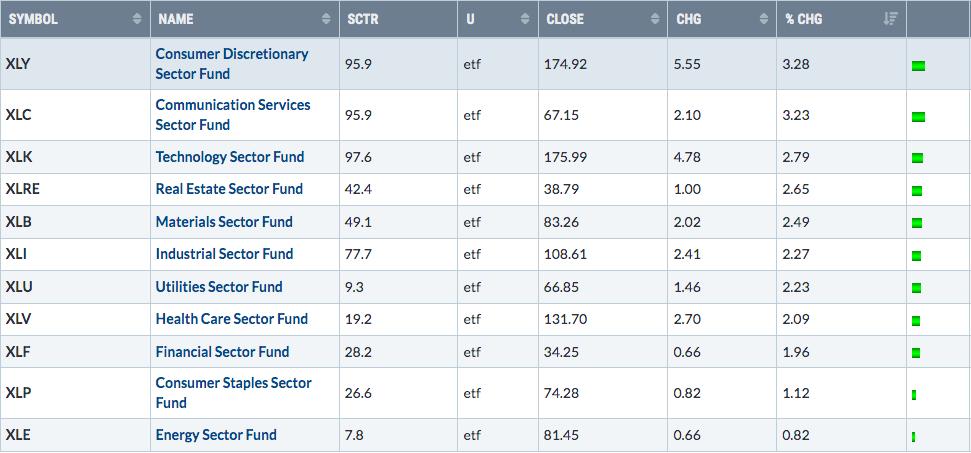
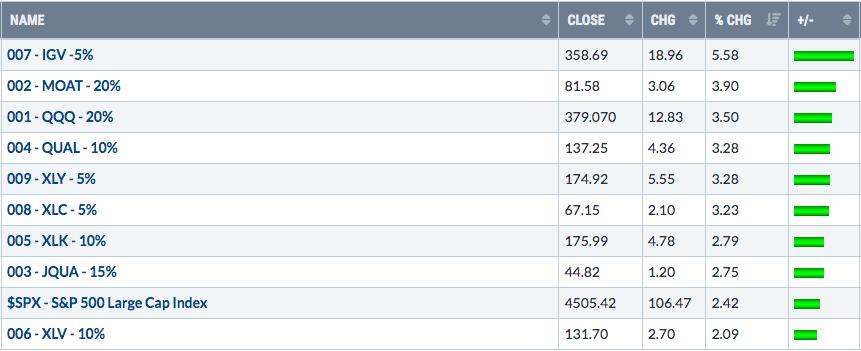
The S&P 500 ($SPX, +2.42%) took full advantage of bullish historical tailwinds that lead us up to the start of earnings season each quarter. All 11 sectors rose last week, with our 3 most important aggressive sectors leading the way:
Model Portfolio:
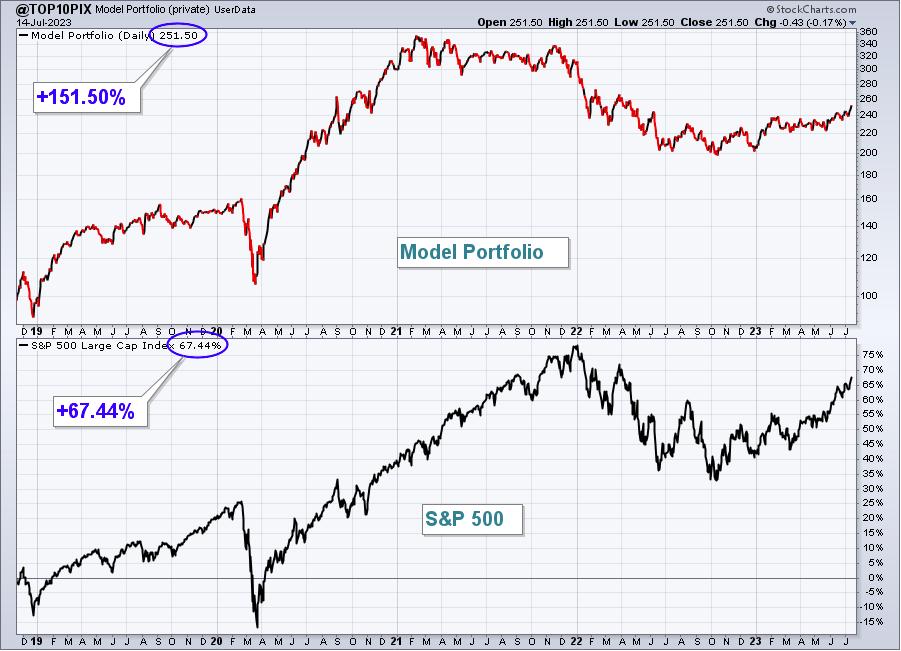
The Model Portfolio jumped 5.09% last week, easily outperforming the S&P 500. Here's the updated inception-to-date chart of the portfolio:
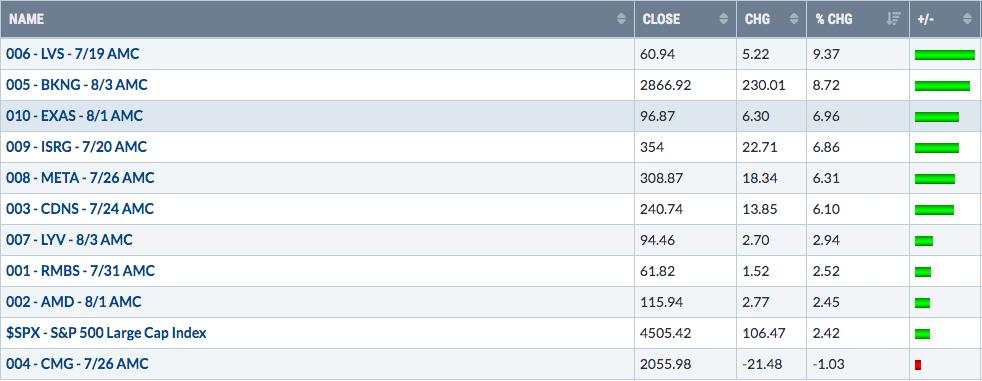
Here are how the Model Portfolio component stocks performed last week:
Aggressive Portfolio:
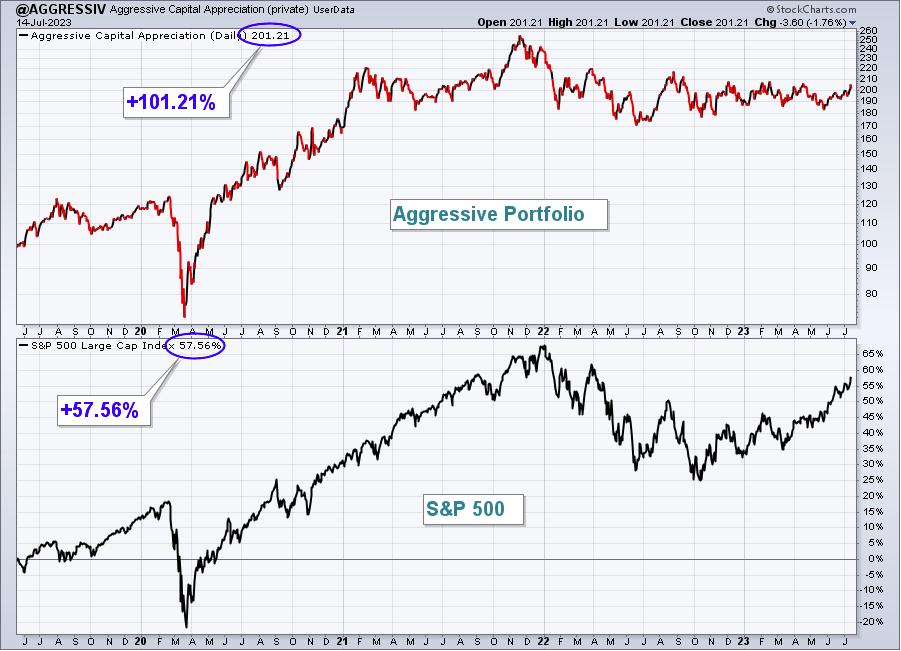
The Aggressive Portfolio climbed 2.65% last week, slightly outperforming the S&P 500. Here's the updated inception-to-date chart of the portfolio:
Here are how the Aggressive Portfolio component stocks performed last week:
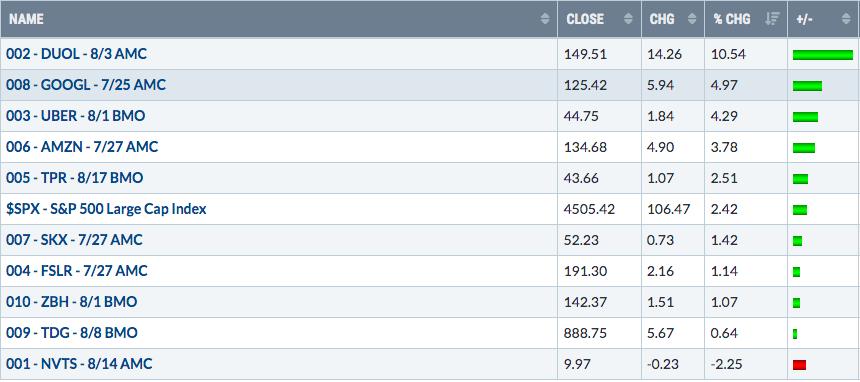
Income Portfolio:
The Income Portfolio rose 2.73% last week, outperforming the S&P 500.
Here's the updated inception-to-date chart of the portfolio:
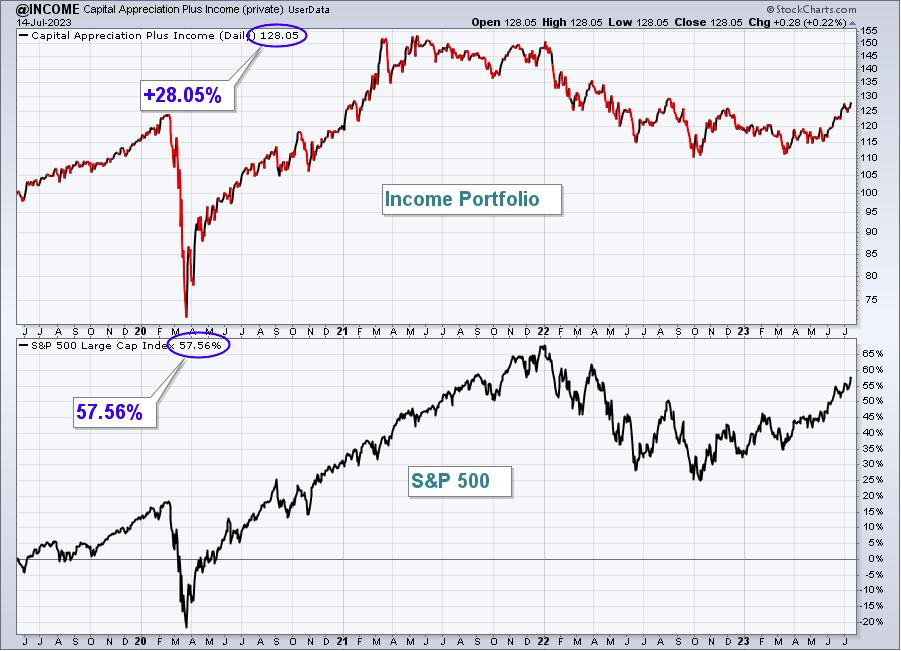
Here are how the Income Portfolio component stocks performed last week:
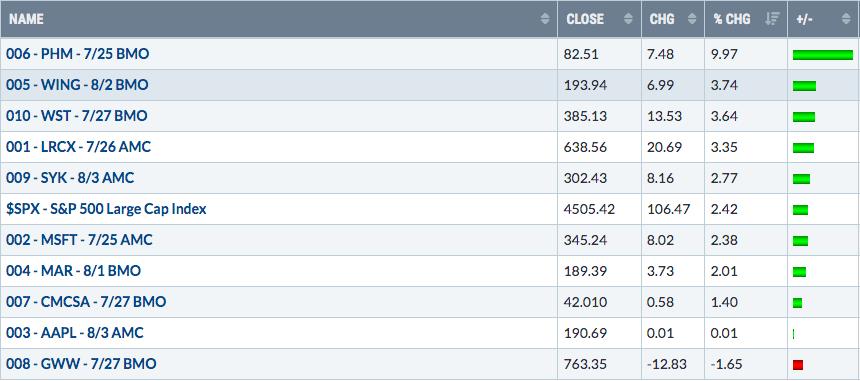
Model ETF Portfolio
Our Model ETF Portfolio gained 3.33% last week, easily outperforming the S&P 500.
Here's the updated inception-to-date chart of the Model ETF Portfolio:
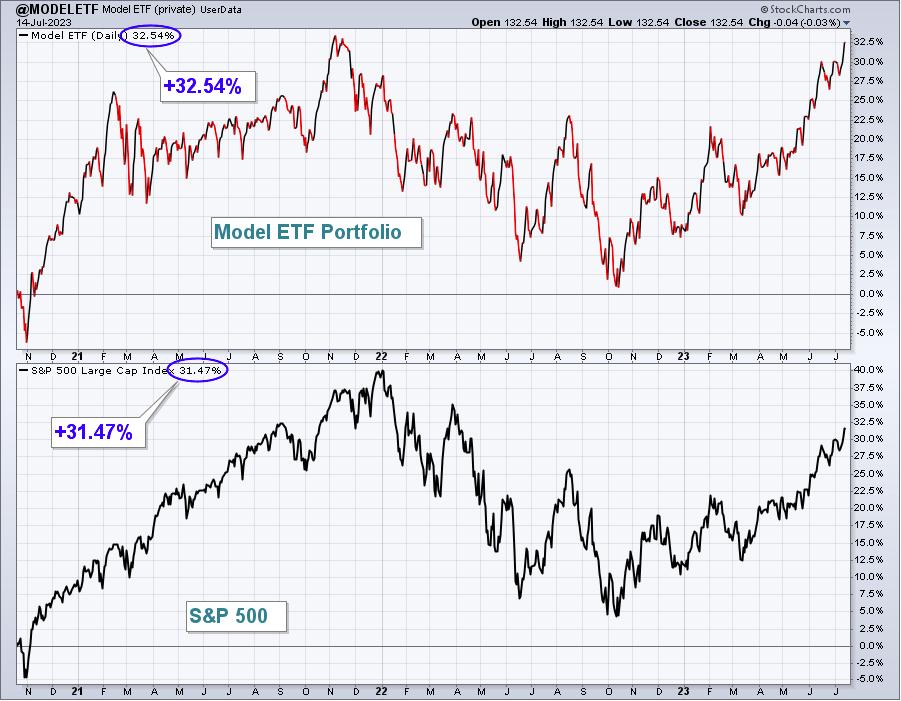
Here are how the Model ETF Portfolio components performed last week:
Model Trade Setups
I will provide Model Trade Setups each week in this Weekly Portfolio Report, which will simply be to outline possible trades based on key support, resistance, relative strength, and where these trades come from. For instance, my trading strategy for Strong AD ChartList (SADCL) stocks might be completely different than my trading strategy on Strong Earnings ChartList (SECL) stocks. Obviously, it would be different from a Short Squeeze ChartList (SSCL) trading candidate. I'll lay out the annotated chart and my reasoning for the (potential) trade. I may provide follow-up on some or all of these setups in the Daily Market Report (DMR). I'll also provide full disclosure, if I own any of the setups provided. Feel free to trade these Model Trade Setups based on the annotated charts provided, or according to your own trading strategy. Or ignore them. It's completely up to you. I am not a Registered Investment Advisor (nor is EarningsBeats.com). THESE TRADING CANDIDATES SHOULD NOT BE VIEWED AS INVESTMENT ADVICE.
I view EarningsBeats.com as a market research, market guidance, and market education platform. We do not attempt, in any fashion, to manage anyone's money. We have no idea the risk tolerance of each of our members, nor do we have any idea of your financial goals and objectives. It would be irresponsible for us to provide advice to any of our members. Therefore, please consult your own financial advisor before considering any buy/sell decisions. You are completely responsible for the financial decisions that you make.
Recent Setups
Here is an update on setups provided two weeks ago:
LVS:
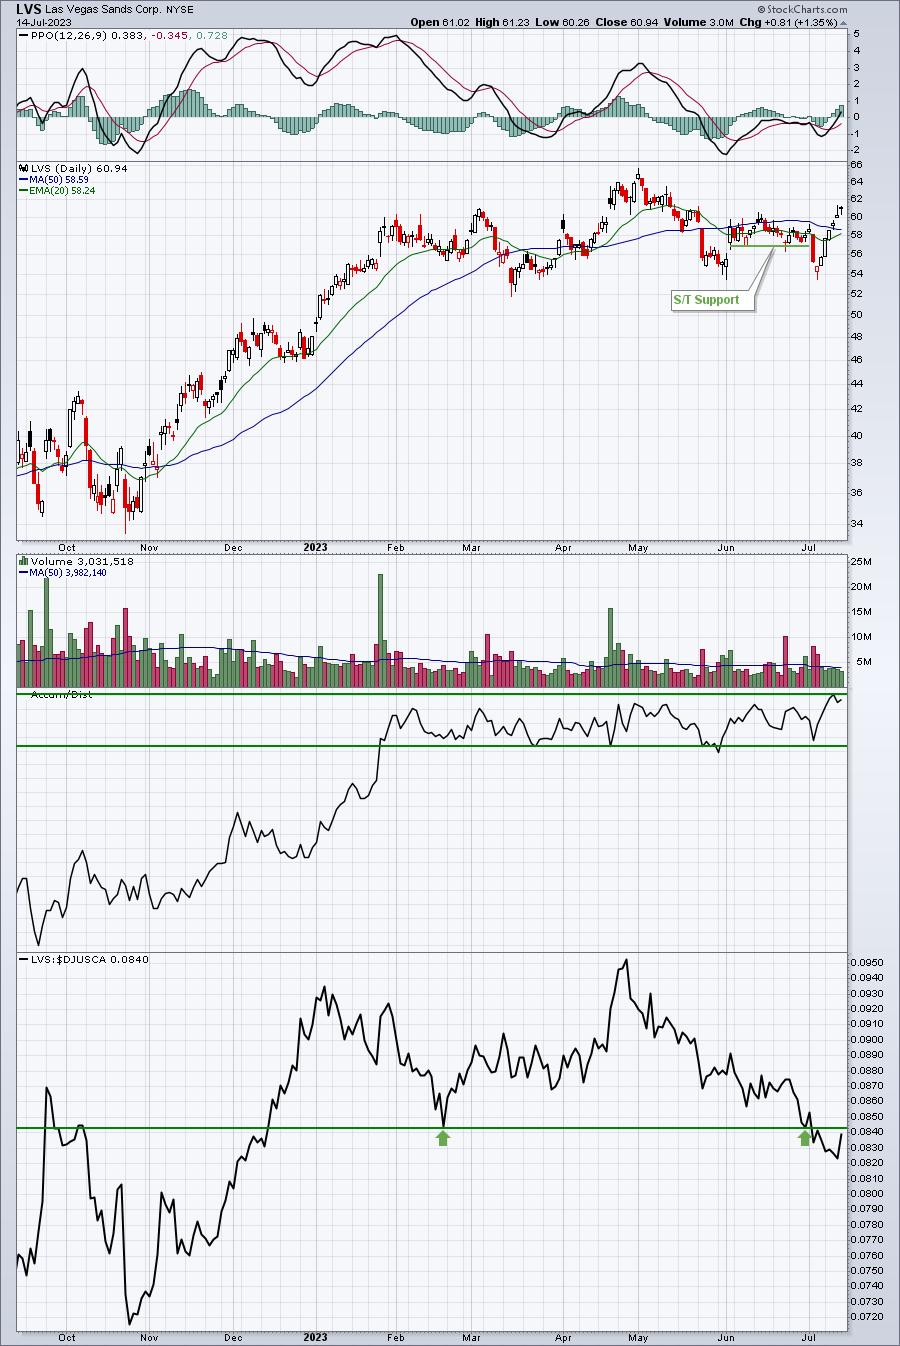
While I was previously stopped out and didn't enjoy last week's reversal, unfortunately, LVS did bounce beautifully off 54 price support and made a nice run as it approaches its earnings report - out this week. Personally, I wish I had waited another week to trade it, but trading isn't easy.
DUOL:
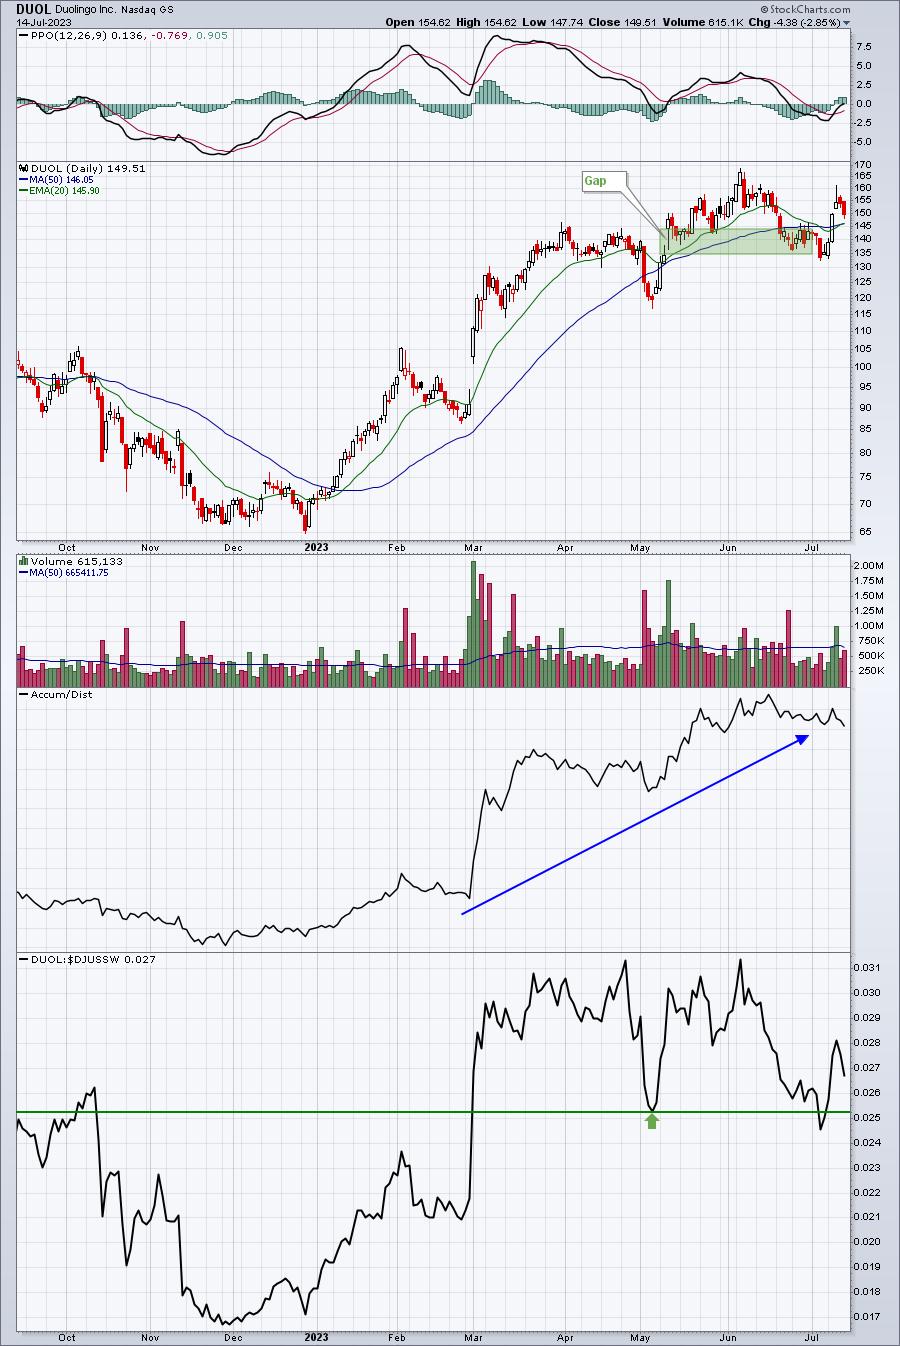
Last week, I suggested DUOL would be in more technical trouble if it didn't turn quickly back to the upside. I suppose a 20% surge in three days qualifies and it now looks much better technically, back above its key moving averages. It was certainly helped by a very strong software group ($DJUSSW).
FSLR:
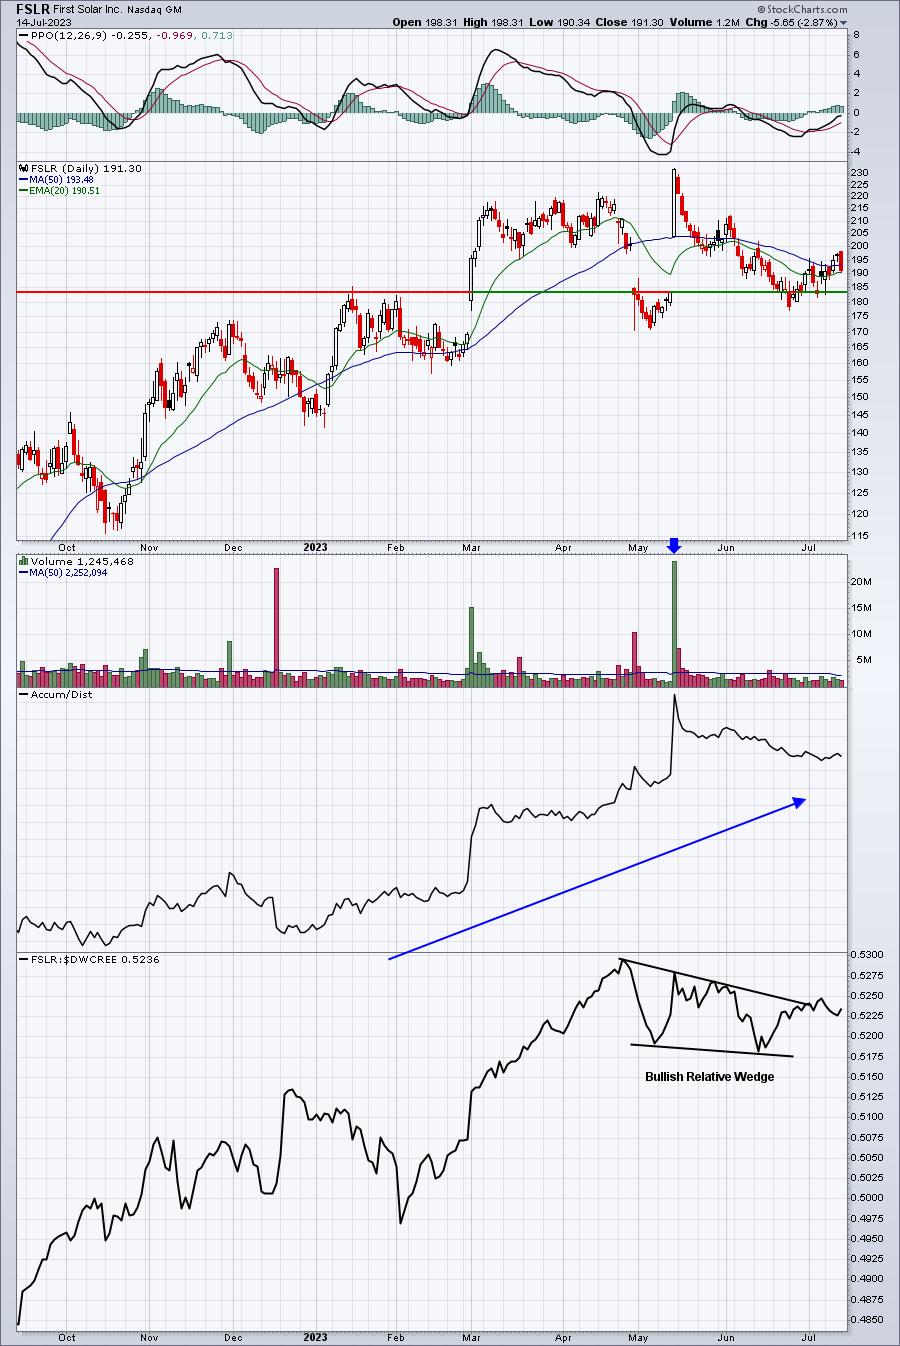
Last week, FSLR was trending lower and was beneath its down-sloping 20-day EMA. But I pointed out that it broke out of its bullish relative wedge, providing near-term hope. Well, here we are a week later, and there's been no follow through on a relative basis, which is disconcerting. Perhaps it will hold its now-rising 20-day EMA. Also, July tends to be strong for renewable energy stocks ($DWCREE). That could result in a much stronger second half of the month.
I will not provide further coverage of these setups from two weeks ago.
Here is an update on last week's setups:
ISRG:
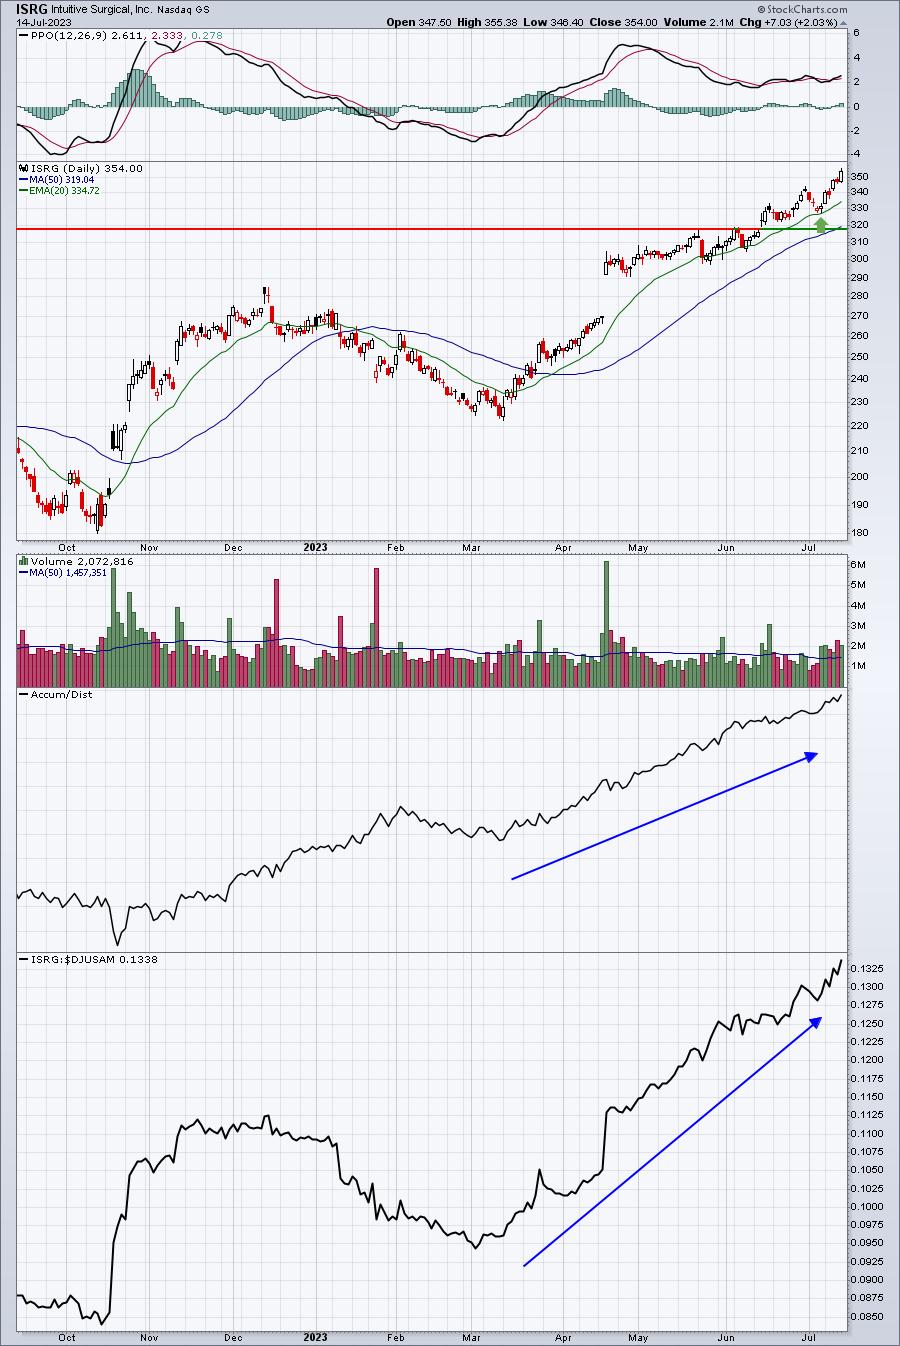
This turned out to be a great 7% winner off of its 20-day EMA. If you continue to hold, just be aware that ISRG reports its quarterly results on Thursday after the market closes.
CMG:
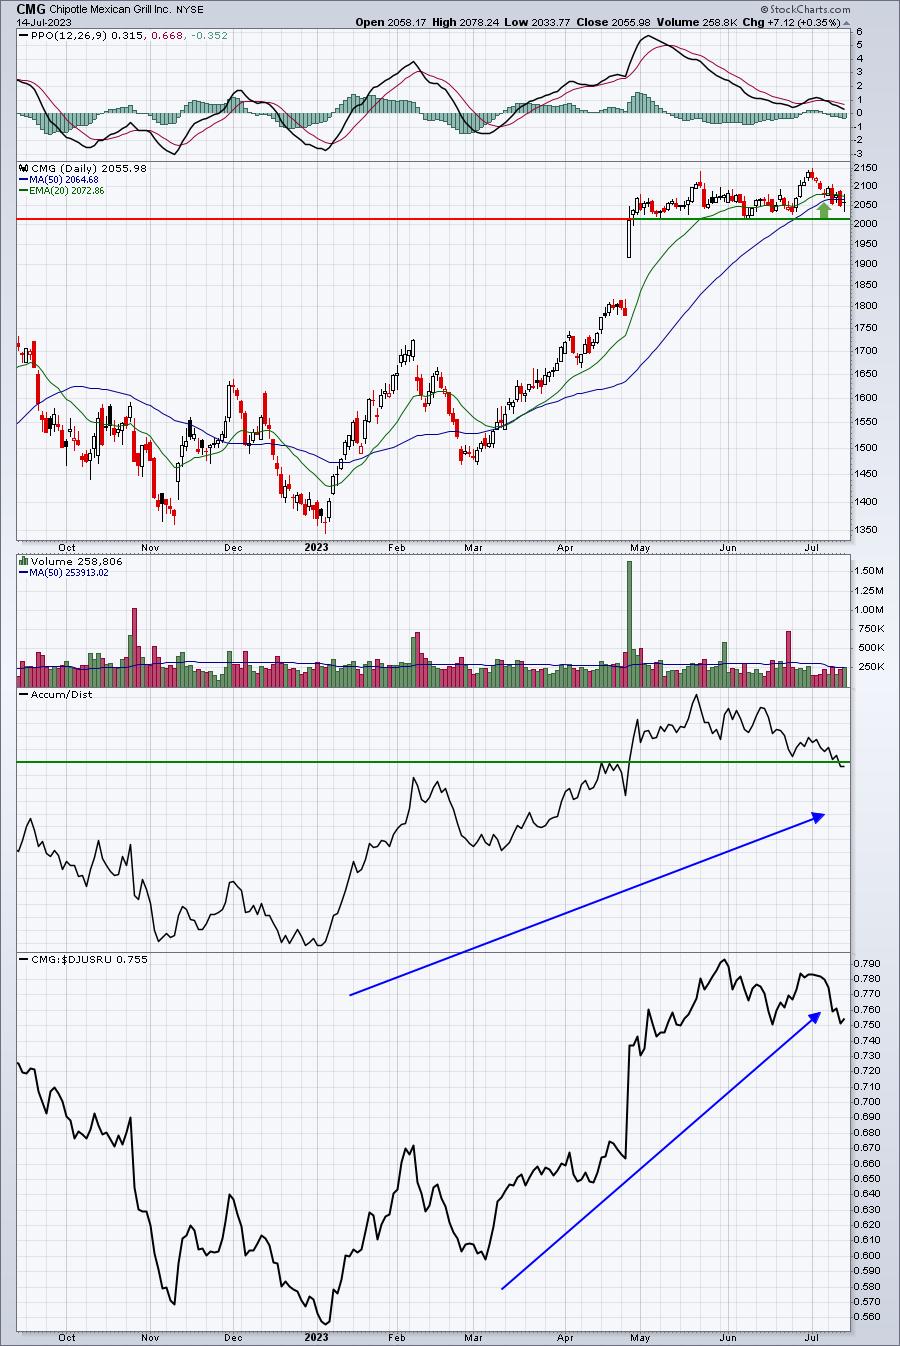
CMG trended a bit lower last week, but there were no significant technical breakdowns. Given its continuing strong relative strength, I believe CMG is going to surprise big time to the upside when it reports on July 26th after the market closes. I'm ok holding this one, but if it fails to hold 2000 price support, a quick drop and potential head fake to the downside could follow.
This Week's Setups
Every week, I will provide setups among our Portfolio stocks and our ChartList stocks. My preference is to trade Portfolio stocks, when appropriate. These stocks are in our portfolios for a reason - they're generally leaders within leading or improving industries.
There's a lot of risk as we move into next week. Historically, the close on Monday (July 17th) represents the start of the 2nd worst week of the year. It's also options-expiration week. Trying to guess when options-related manipulation will kick in is always difficult. Maybe it just did on Friday. Or perhaps there's another few days of strength. Personally, after having such a solid 2022 and first half of 2023, I decided to be a bit more cautious than usual going into the week. Sticking with such a bullish move does make a lot of sense, because I hate betting against a bull market, so everyone must make that decision on their own. If I'm looking at the market from a long-term perspective, I'm staying in. If you're more of a short-term trader, then being a bit more cautious makes sense.
Anyhow, given the heightened risk, I'll provide two defensive long candidates this week. Both came from the Downtrend Reversal scan and these are NOT portfolio stocks this week. Here they are:
CHD:
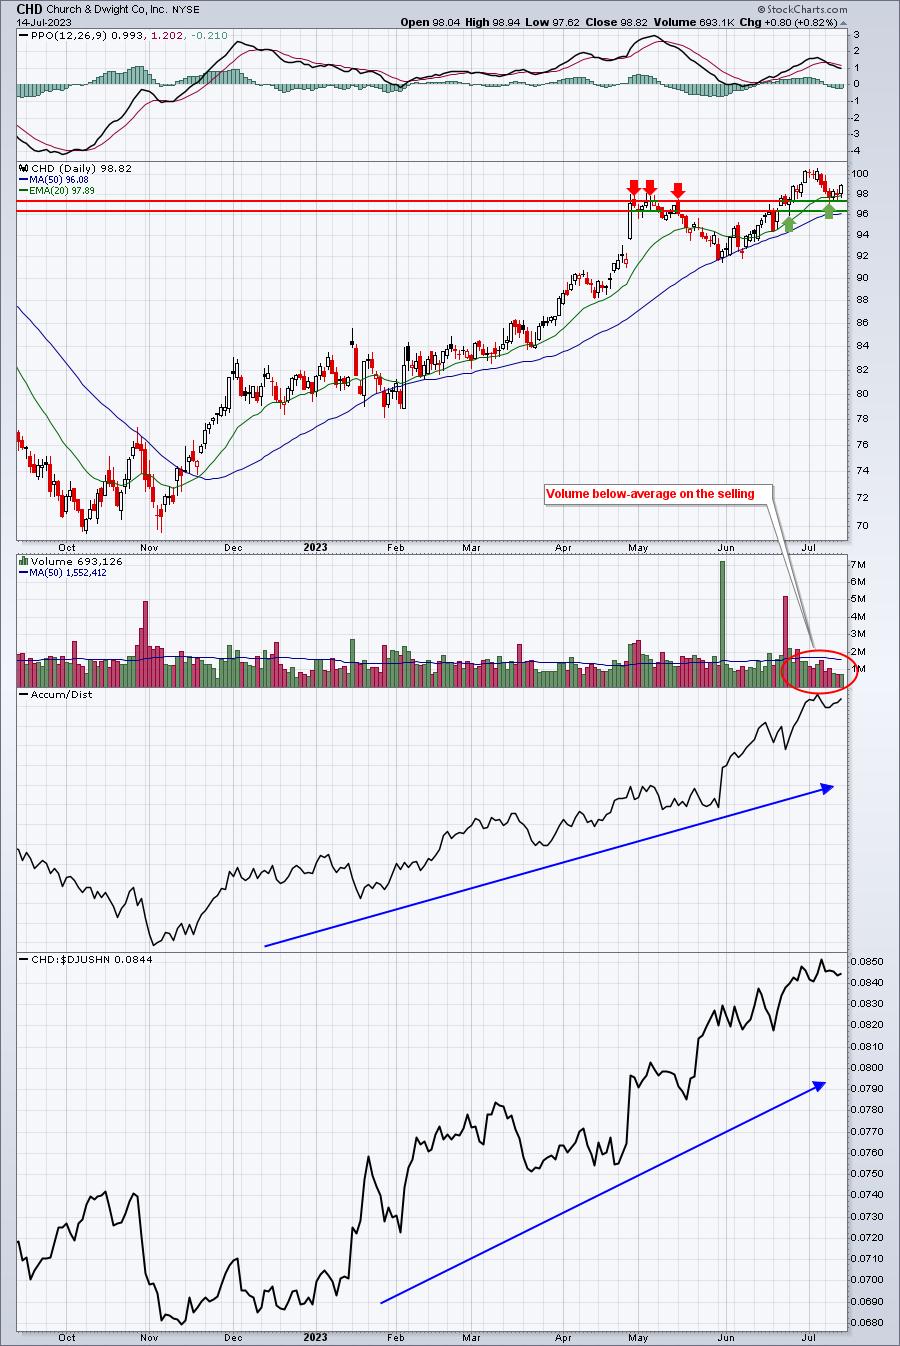
I love the bounce off price support and the 20-day EMA.
LLY:
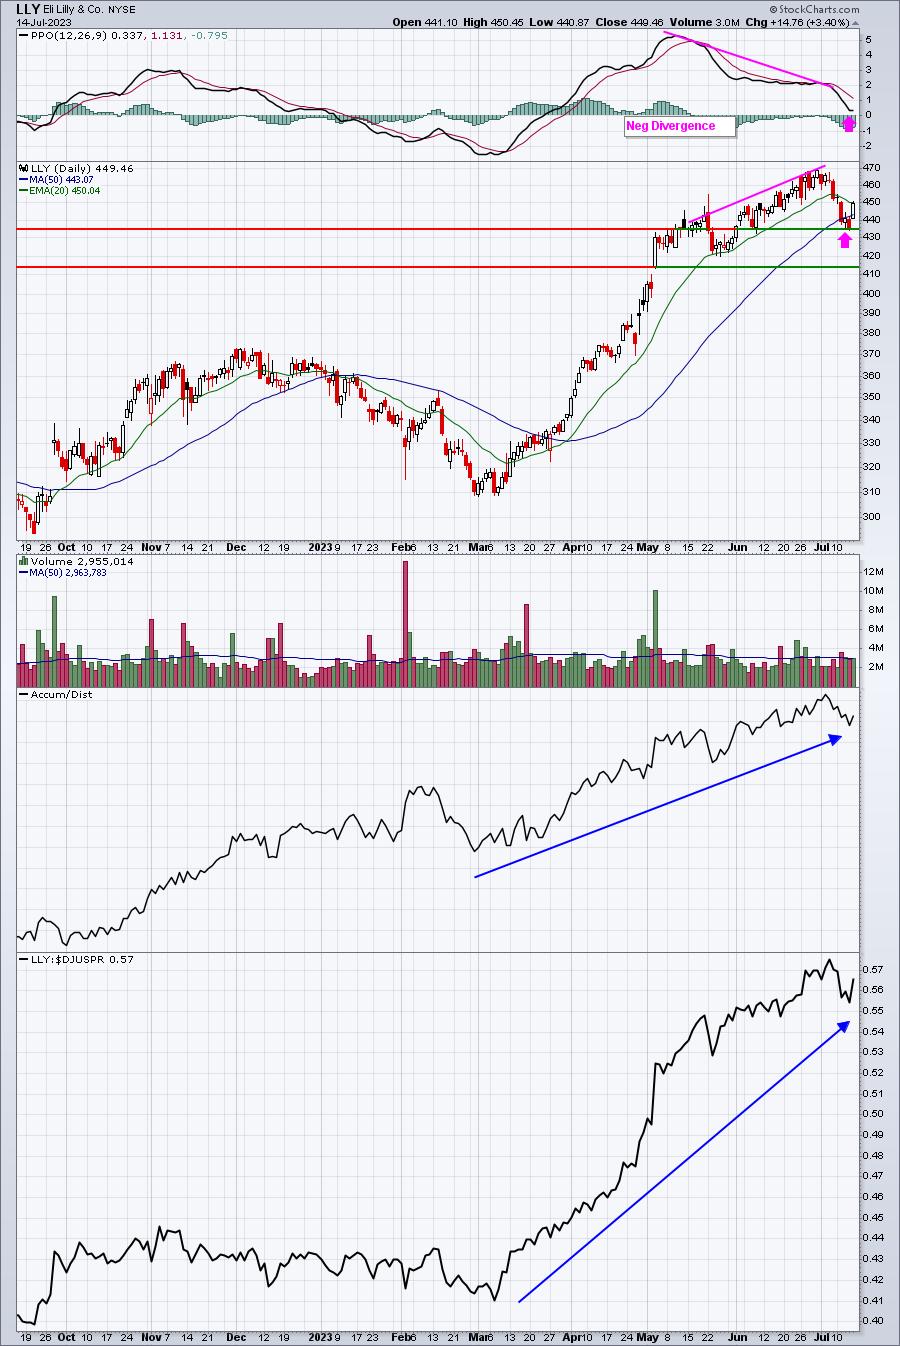
LLY had printed a negative divergence recently, and I like to see a PPO centerline "reset" and/or a 50-day SMA test afterwards. We've essentially seen both, though the PPO line is still a bit above the centerline. I see a return to new high here.
Both of these stocks have strong AD lines and are leaders in their respective industry groups. I believe this is a better way to trade this week, considering the risks involved.
The Week Ahead
We'll see earnings begin to pick up this week, though the following week is when we'll really start to see the quarterly reports pour in. We've made a very nice pre-earnings season move higher, which is typical. It's also typical to see a post-earnings struggle. That's one reason why we are on the cusp of entering the worst historical time of the year for U.S. stocks. Since 1950 on the S&P 500, there's not been a worse intermediate-term period than from the July 17th close to the September 26th close. Please do not place too much emphasis on this as the average annualized return on the S&P 500 over the last 7 decades is -2.00% - not exactly crash-type returns. But it's a long period to underperform the normal S&P 500 returns by 11 percentage points. If you recall, the S&P 500's average annual return is roughly 9% since 1950.
We did see some "sell on the news" last week as Delta Airlines (DAL) reported great results, gapped higher, then sold off on Thursday and Friday. Never rule out this possibility, even with the best of earnings results.
Big earnings reports this week include the following:
- BAC, MS, LMT, PNC, and JBHT on Tuesday
- TSLA, NFLX, IBM, GS, and LVS on Wednesday
- JNJ, ABT, ISRG, CSX, and DHI on Thursday
- AXP and SLB on Friday
I'll be particularly interested in TSLA and NFLX as both show very strong AD lines and solid relative strength vs. their peers.
Another big problem that we'll soon have to face is the VERY BULLISH 5-day moving average of the equity only put call ratio ($CPCE). We've reached levels where we could see a short-term top at ANY time. Check this out:
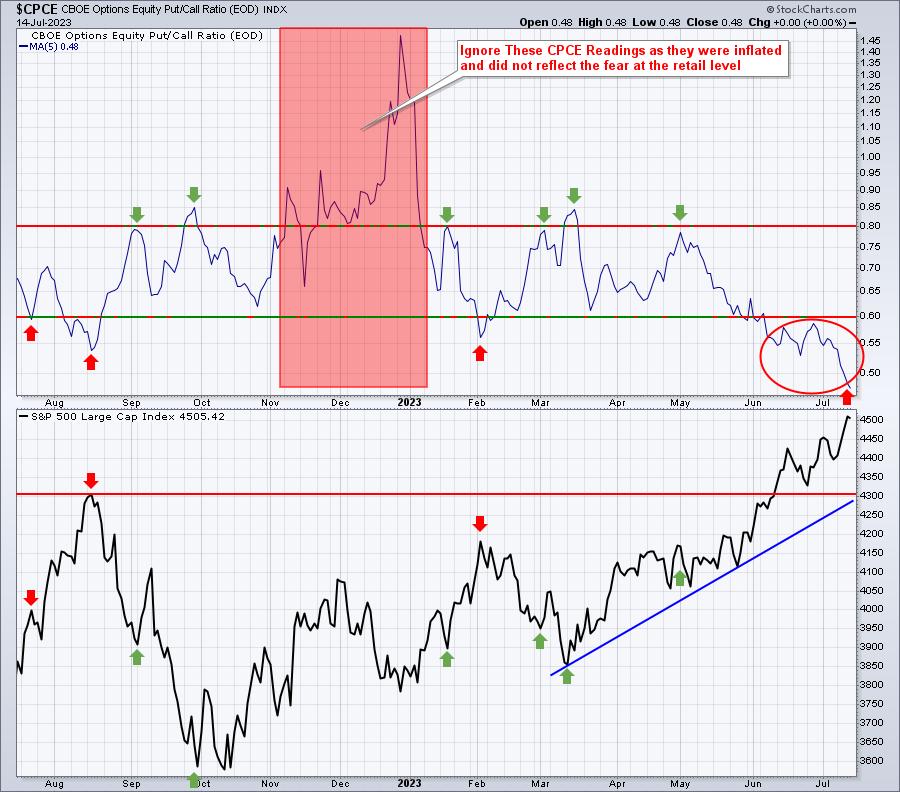
If we see a reversal this week, please be careful. This 5-day moving average of the CPCE is at its lowest level in a year. I consider the 5-day moving average to be my "speed boat" indicator, because it can quickly turn on a dime. When it does, a short-term top on the S&P 500 is usually set as well.
Happy trading!
Tom Bowley, Chief Market Strategist
EarningsBeats.com
"Better timing. Better trades."