
EB Daily Market Report - September 23, 2019
Executive Market Summary
- Two portfolio stocks - CTAS and KMX - report earnings on Tuesday
- The German DAX ($DAX) down 1% today on weak manufacturing data
- Flight to safety as both gold (+1%) and treasuries rally
- 10 year treasury yield ($TNX) down 6 basis points to 1.69%
- U.S. major indices mostly flat
- Consumer stocks leading today, but overall action bifurcated; 6 sectors up, 5 down
Market Outlook
While I can point to several reasons why we could see a selloff this week - historically bearish week, just tested all-time high price resistance, overbought, Fed meeting (where we've seen recent selloffs), etc. - I can only think bullishly if we see a breakout. If U.S. stocks can overcome everything that's been thrown at them and break to all-time highs, I believe it will begin a very bullish Q4 where the S&P 500 could reach 3200-3300. Of course, we want to see signals under the surface confirm that bullish breakout. A rising XLY:XLP ratio would be a big positive. Leadership from transports and small caps (Russell 2000) would be huge positives as well.
Until then, we'll simply trade what we see, with an opportunity here or there. I think we could see more weakness this week, so here's a chart of the S&P 500 with a few areas to consider:
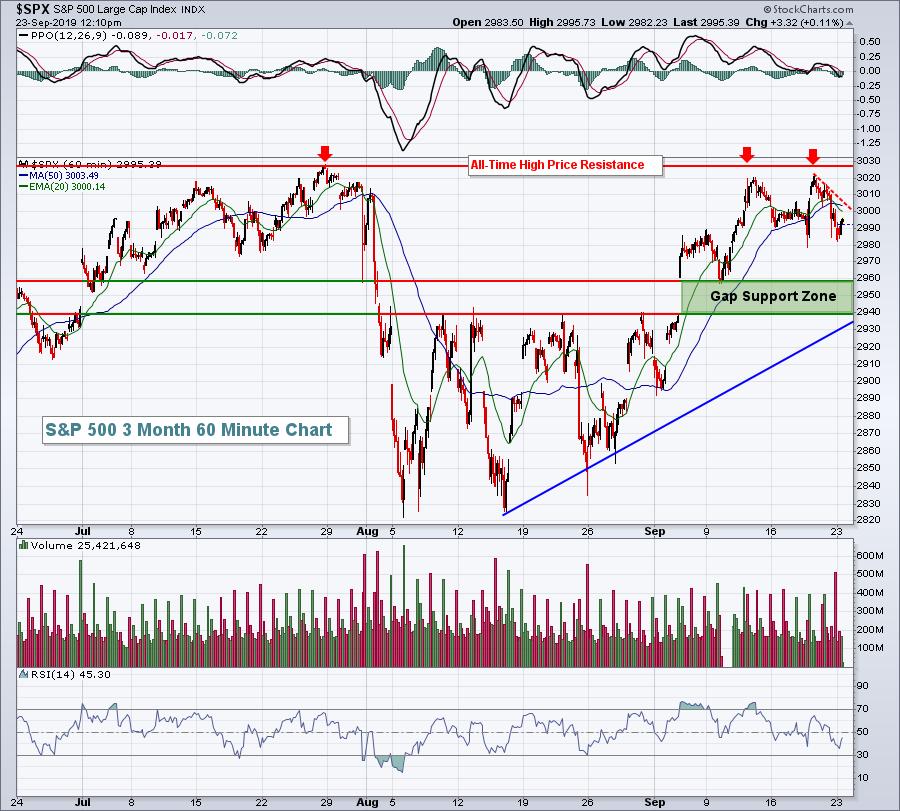
Obviously, 3025-3030 is the BIG number to the upside, but a move through 3000-3005 would be a short-term positive as it would clear the very near-term downtrend since Thursday's high.
From a support perspective, I believe one more trip to 2960 could be in the cards this week, with 2940 approaching a much more important short-term support level as both trendline and price support would be tested there.
Sector/Industry Focus
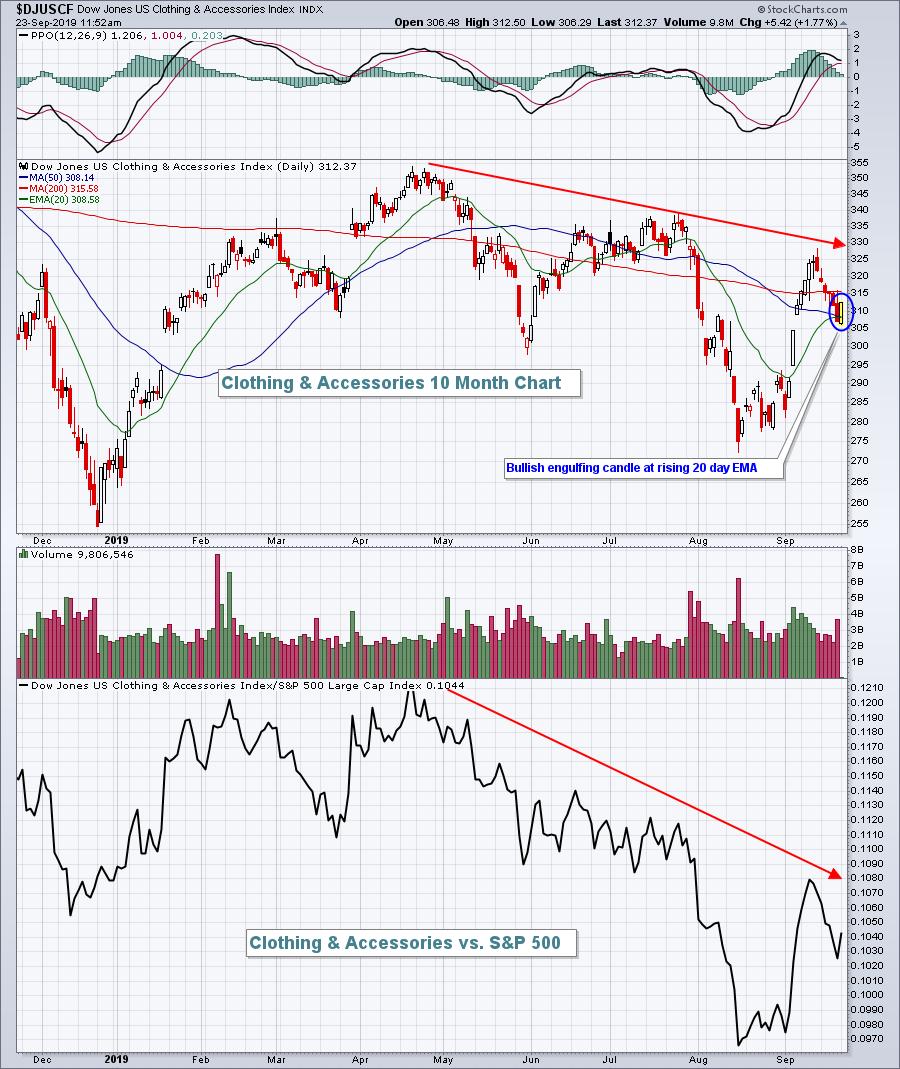
Clothing & accessories ($DJUSCF) is today's leading industry group within consumer discretionary stocks (XLY). I don't trust the group as it's been a relative laggard now for the past 5 months. When that relative downtrend ends, I'll pay more attention to the group. Otherwise, these brief rallies simply get you into stocks that have significant downside risks. Here's a current look at the chart:
Now a totally different picture exists for semiconductors ($DJUSSC), today's leading industry group within technology (XLK). A breakout above key price resistance isn't that far away, so keep an eye on this chart:
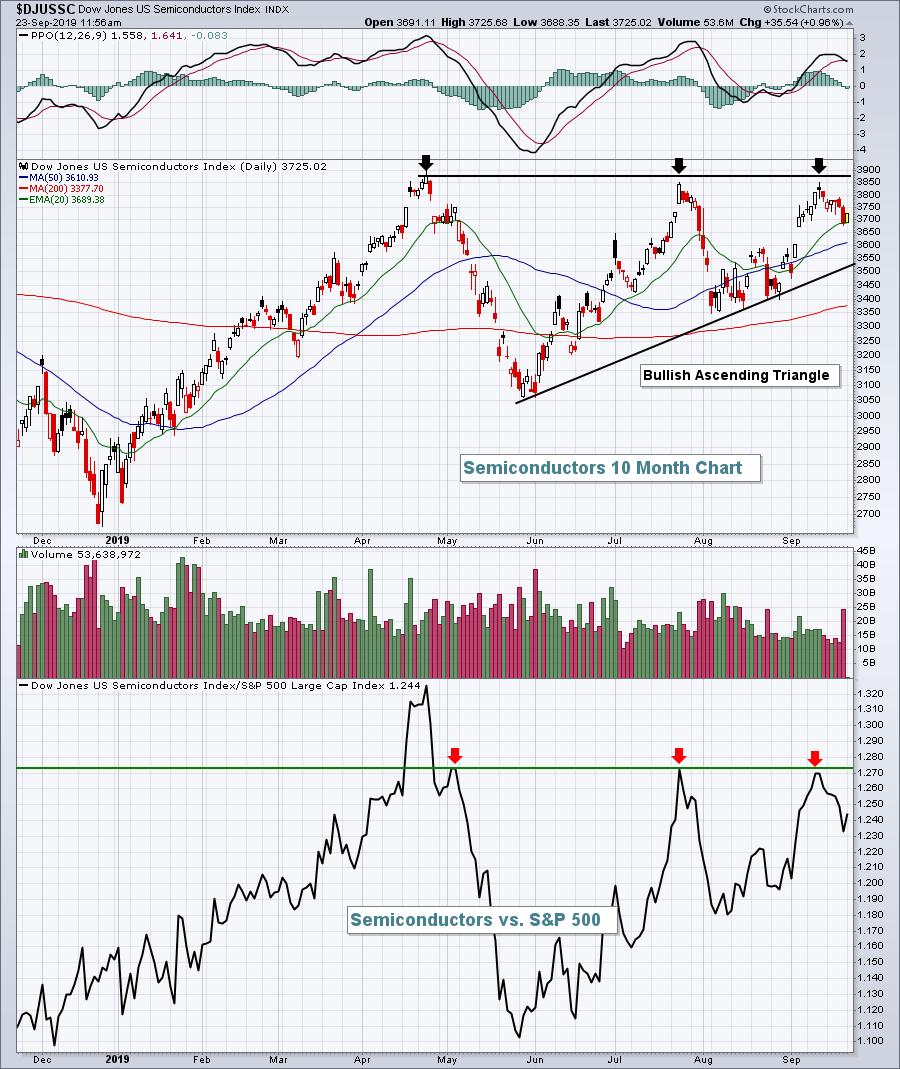
The ascending triangle pattern isn't perfect as the recent price tops didn't quite reach that initial top, but I think it's close enough. If we see that price breakout and a relative breakout, this is a group where you want to trade or invest in its leaders. Micron Technology (MU) reports its earnings later this week and could be the catalyst the group is looking for.
Seasonality supports the notion of higher prices for semiconductor stocks in Q4:
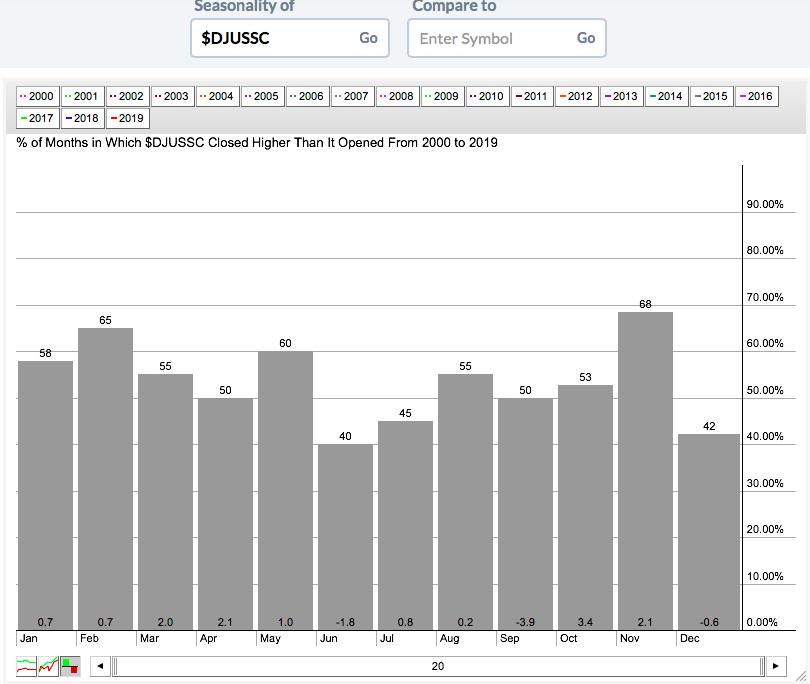
While September has historically been the weakest month of the year, October and November rank #1 and #2 for seasonal strength. So a breakout would be supported by seasonal trends.
Strong Earnings ChartList
Mondays that fall during the bearish 19th through 26th period of every calendar month have produced annualized returns of -46.24%. Mondays are the worst calendar day of the week and the 19th through the 26th are the worst period during the calendar month. So this stat marries those two historical trends....and the results aren't pretty.
However, knowing this trend can set up nice trades. For today, I wanted to scan our Strong Earnings ChartList for stocks with SCTR scores above 90 (very strong relative performers) and RSIs below 50 (ensuring consolidation and/or pullback) to see if we can identify some potential opportunities this week. Here are the results:
Stocks with SCTR>90 and RSIs<50 at 11:27am EST - 13 of 329 stocks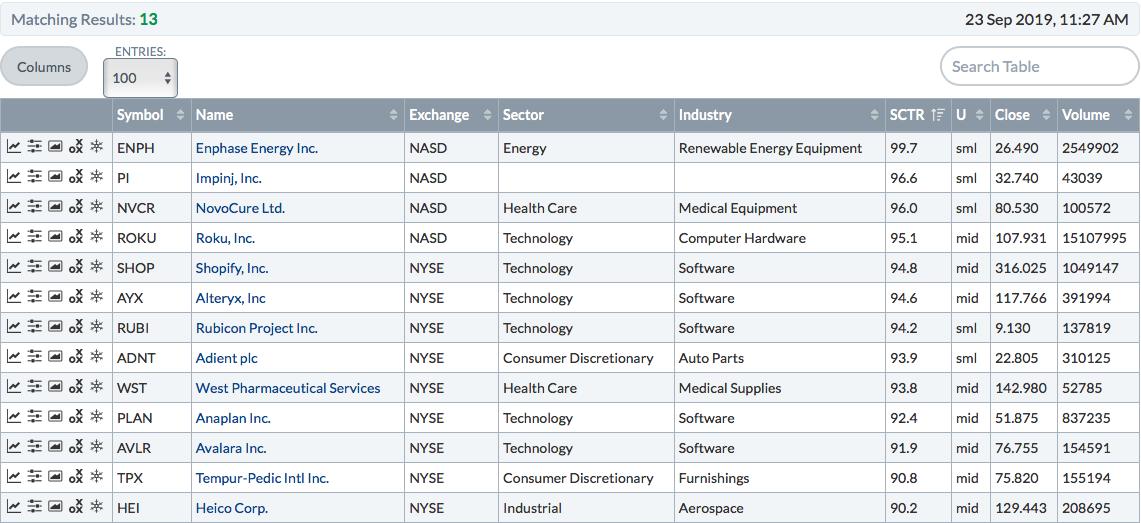
The first thing I noted is that 6 stocks are in the technology sector (XLK) with 5 in software ($DJUSSW). One of the biggest questions to be answered over the next few weeks is whether the relative strength deterioration in software is an aberration or if it's something that will continue. In the meantime, I haven't given up on the group so finding high reward to low risk trade setups here still makes sense to me.
It's aggressive, but I really like Shopify, Inc. (SHOP) at its current level. You have to decide how much more downside you're willing to give SHOP and determine a trading strategy based off of that. The daily chart seems rather uninspiring, with price breaking down beneath key moving averages and heavy volume accompanying the breakdown. Check it out:
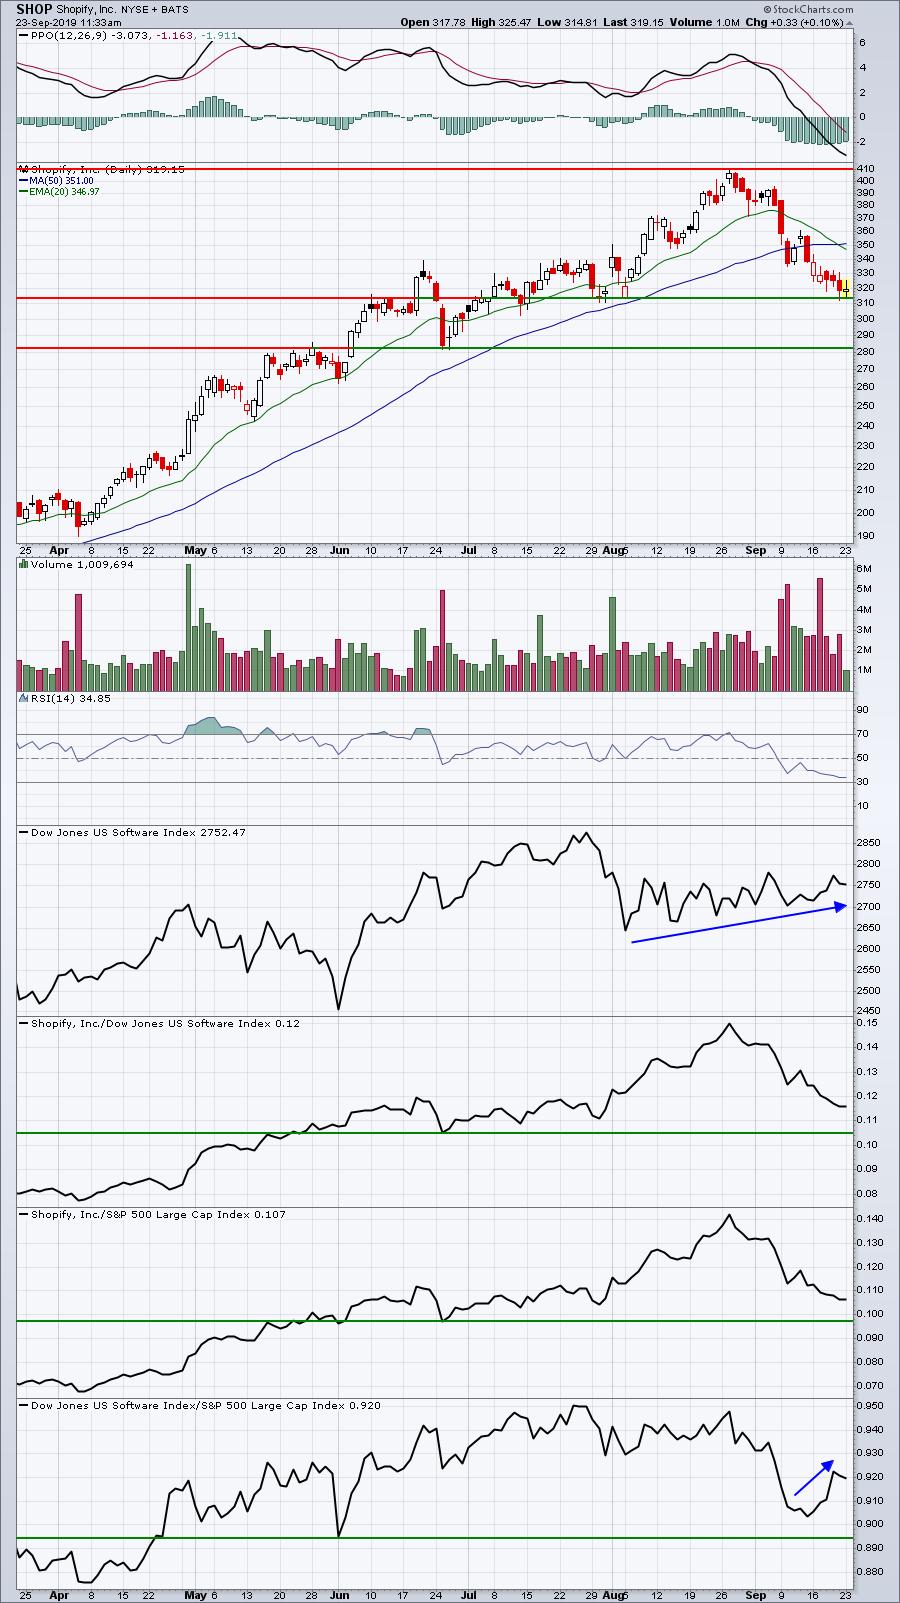
I believe that if SHOP recovers, it's likely to do so from its current price or from the big breakout in June above 282. That level held during the selling that took place later in June. One positive I see looking at the last two weeks is that 5 of the last 9 trading days have hollow candles, meaning that we're seeing closes above opens. While the stock is moving lower overall, I could argue there's accumulation taking place. Finally, I think it's imperative to always stretch the chart out and look at the bigger picture on a weekly chart. Yes, the selling has been intense, but I see a completely different picture here - one where SHOP became very overbought and it's come down from those overbought levels:
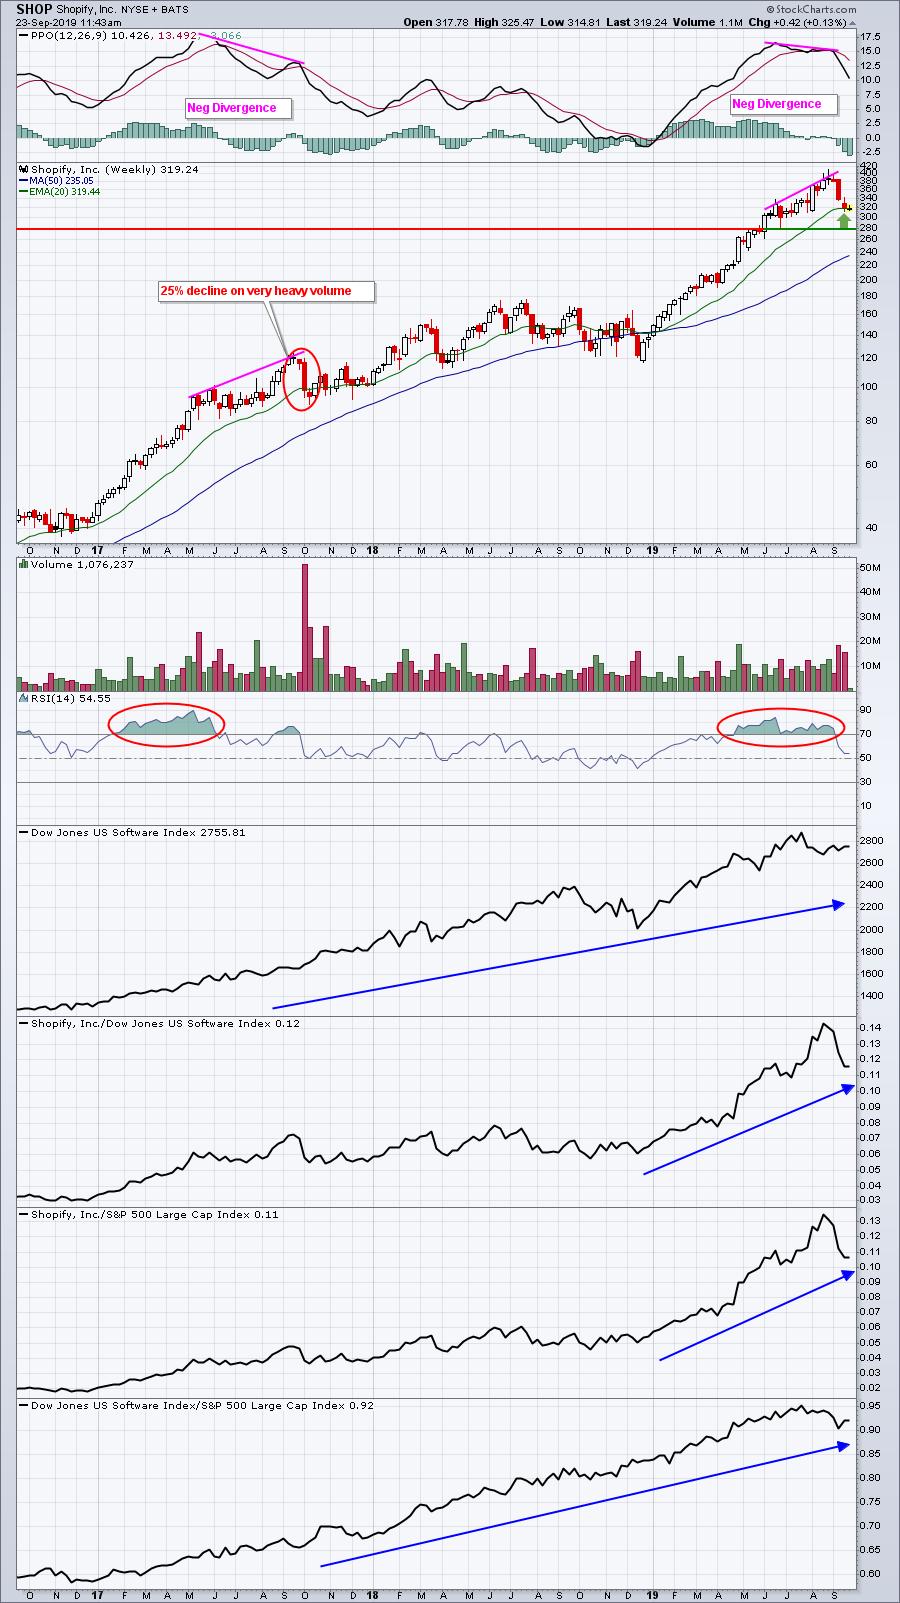
Recent developments look quite similar to 2017, don't they? SHOP becomes extremely overbought with a weekly PPO nearing 20 - nearly an impossible level for a stock to reach, and then we see selling to help relieve overbought conditions. SHOP is growing rapidly and it goes through periods of being overpriced and those buying at highs panic to the downside. It's as simple as that. There's a period of consolidation that follows and then the uptrend resumes. I expect SHOP to play out like that again. I don't know if the current price support level holds, but I'd be surprised if the June support near 280 is violated.
If software stocks return to favor in Q4, I look for SHOP to benefit.
Current Alerts
We have no current alerts at the moment. One reason is that our major indices are very close to overhead price resistance so adding alerts at this point could prove costly if the overall market environment turns bearish near-term, which is generally the case during the next several days.
We will likely add 2-3 alerts later this week if we see controlled selling back to key support.
Monday Setup
This might be a little bit of a stretch because Corelogic, Inc. (CLGX) has been a laggard amongst its peers in the business support services group ($DJUSIV). Still, the uptrend is firmly in place and we're approaching a very strong uptrend line:
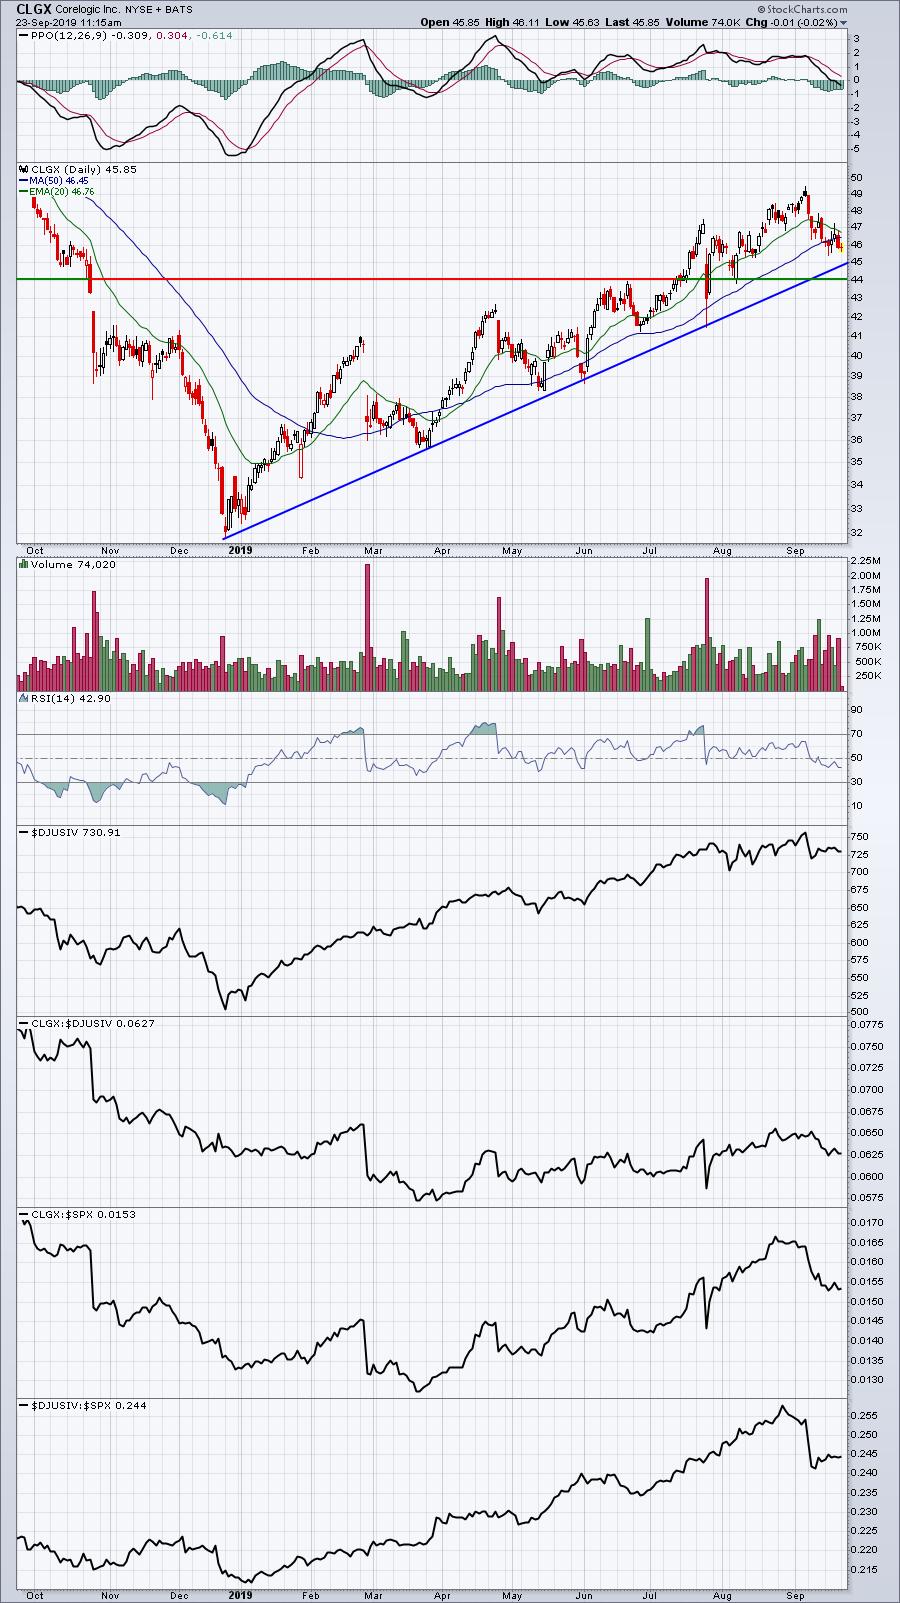
Entering at the current price and perhaps again if the 44.00 price support level is tested would result in average entry just beneath 45. A closing stop beneath 44.00 and a short-term target at 49.00-49.50 would provide a solid reward to risk trade of better than 4 to 1.
Today's Movers
For today's movers, I ran a scan looking for unusually heavy volume among S&P 500 stocks. The following were returned as S&P 500 stocks that have traded more than 50% of their normal daily volume in the first 90 minutes of trading today:
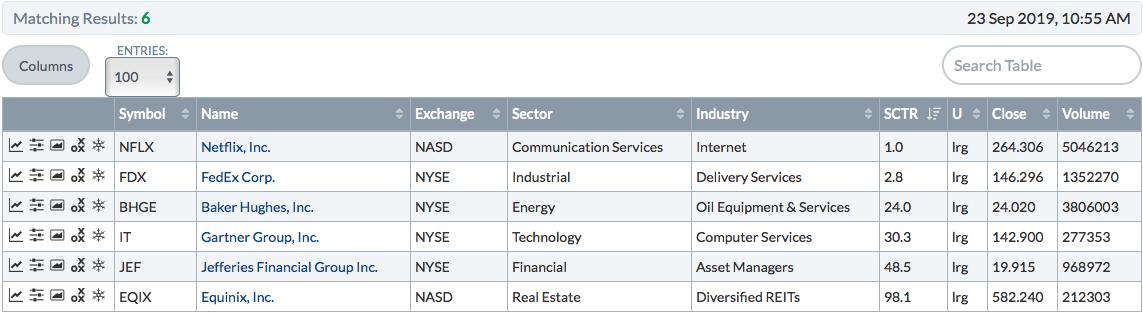
The only bullish case on this list, in my opinion, is EQIX, a diversified REIT ($DJUSDT). EQIX is a leader in its group, so if you're looking for some defense in this period of consolidation, EQIX could be a great choice. It would be better to catch it on a 20 day EMA test, however.
NFLX is breaking down further. Stay away. I see a continuing trip lower (with possible bounces along the way) to test the December bottom near 230. That's still another 13% or so away.
FDX is definitely a problem child. I didn't much care for the stock when it was approaching its earnings and, after missing estimates and issuing a warning, it remains a fundamentally-challenged company. The technical outlook isn't any better:
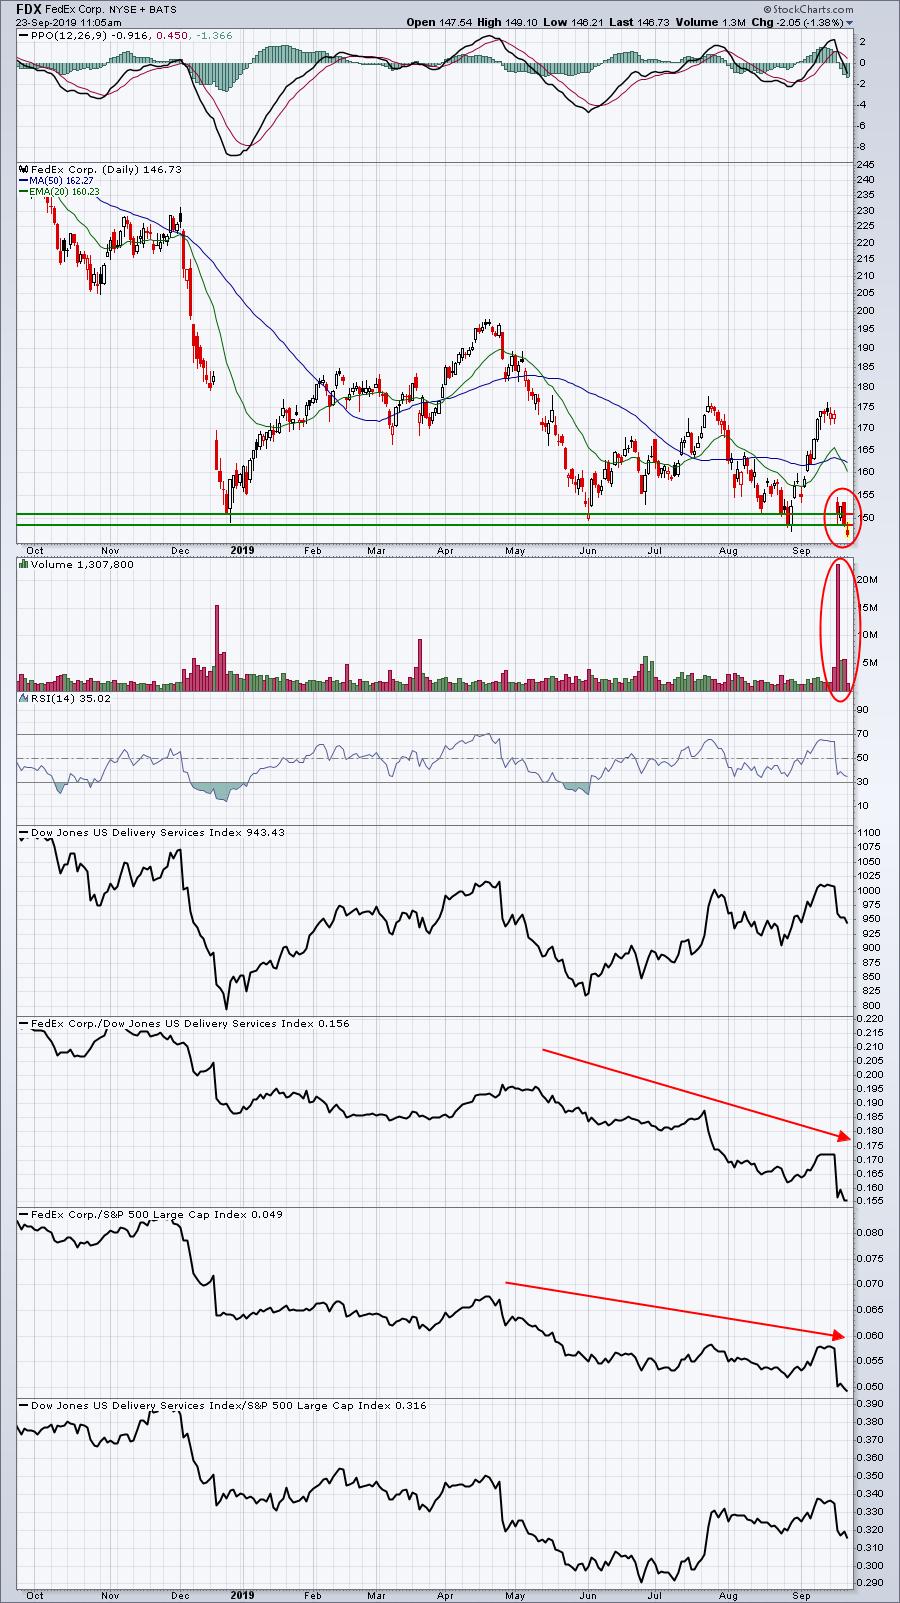
The red directional lines in the lower panels show that FDX is a relative laggard, not what we want to trade if we're looking to outperform the benchmark S&P 500. There'll likely be a day to be interested in FDX, but it's not now. Same goes for NFLX.
Earnings Reports
Here are key earnings reports for this wee:
Monday, September 23:
CMD
Tuesday, September 24:
Portfolio stocks: KMX (Model portfolio - before market open), CTAS (Model portfolio - after market close)
Others: NKE, AZO, INFO, SNX, JBL, BB
Wednesday, September 25:
KBH, FUL, DAVA, WOR, AIR
Thursday, September 26:
ACN, MU, CAG, FDS, MTN, PRGS, ATU
Friday, September 27:
None
Economic Reports
September PMI composite flash released at 9:45am EST: 51.0 (actual) vs. 51.2 (estimate)
Happy trading!
Tom