
EB Daily Market Report - Thursday, October 10, 2019
Executive Market Summary
- Dow Jones higher by nearly 250 points with the NASDAQ showing slightly leadership
- 10 of 11 sectors higher; only utilities (XLU, -0.21%) lagging
- 10 year treasury yield ($TNX) up 6 basis points to 1.65%; rotation from bonds lifting equities
- Rising yields aid financials (XLF, +1.66%), which is the best performing industry group today
- Delta Airlines (DAL) reports revenues below expectations, falls 3.5% despite EPS beat
- Active trade alerts all fine technically, more details below
Market Outlook
The S&P 500 had support in the 2940-2960 area during September. After the early-October selling, that support zone was lost and became resistance and we're now battling it for the second time this week:
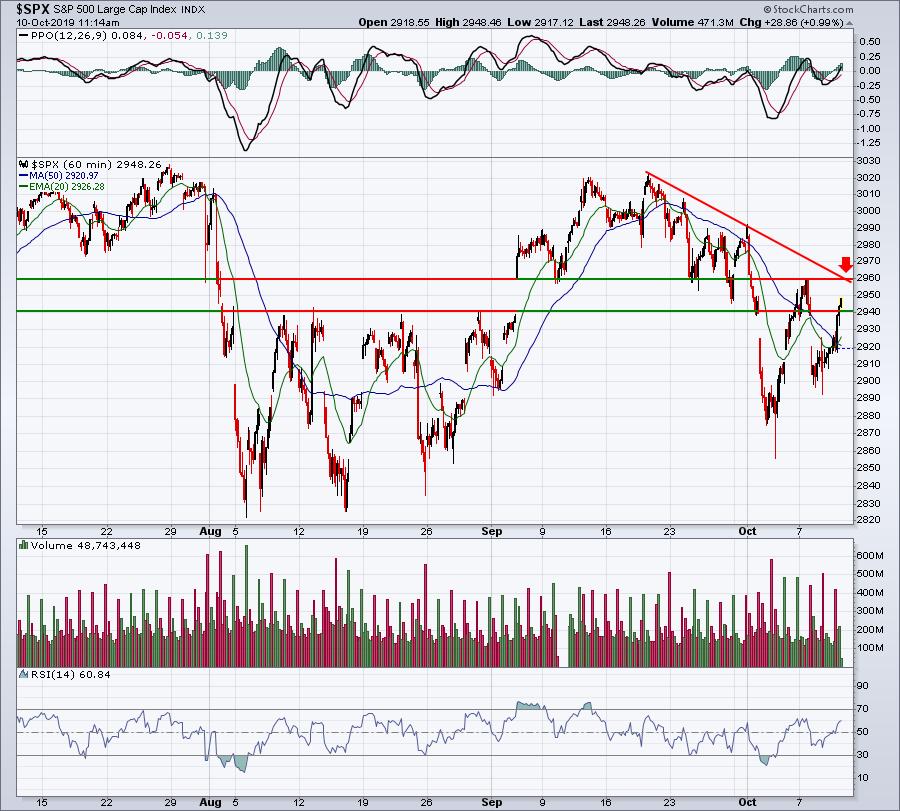
It's only a short-term area of resistance, but we obviously cannot break to all-time highs without first clearing this level. The S&P 500 trading above 2960 should be viewed quite positively, especially since we're heading into earnings season. There have been few warnings from highly visible companies and I interpret that bullishly.
Sector/Industry Focus
Internet is supposed to be a great industry group during the month of October, where it's averaged gaining 8.2% over the past 19 years. That's a nice annual return, much less an October return! It's been flat the first 10 days of October, however, and the longer-term weekly chart shows a few key levels to watch:
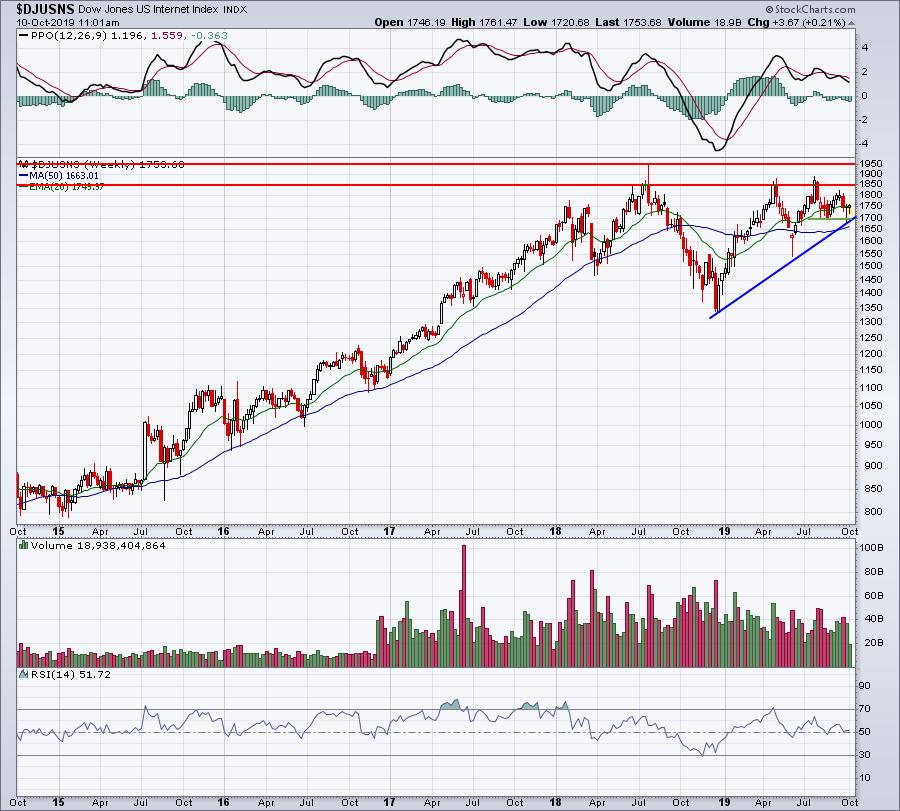
The day-to-day chart appears congested, but stepping back and looking at the DJUSNS from a big picture perspective helps to ease any concerns I have about the group. 1700 is a shorter-term price and trendline support level to watch, while overhead resistance will likely be felt in the 1850-1950 area.
Strong Earnings ChartList (SECL)
I ran a scan of SECL stocks that have SCTRs above 75 (solid relative strength), but RSIs between 40-45 that suggests consolidation. My scan returned 20 of 307 stocks on the SECL. Here they are:
AEM, AIR, APPN, AVLR, AYX, CASY, EL, HEI, KBR, LAD, LDOS, MEDP, PRO, PSXP, RMD, SBAC, SHAK, SKY, TRU, TTWO
I would pay particular attention to the following two:
MEDP:
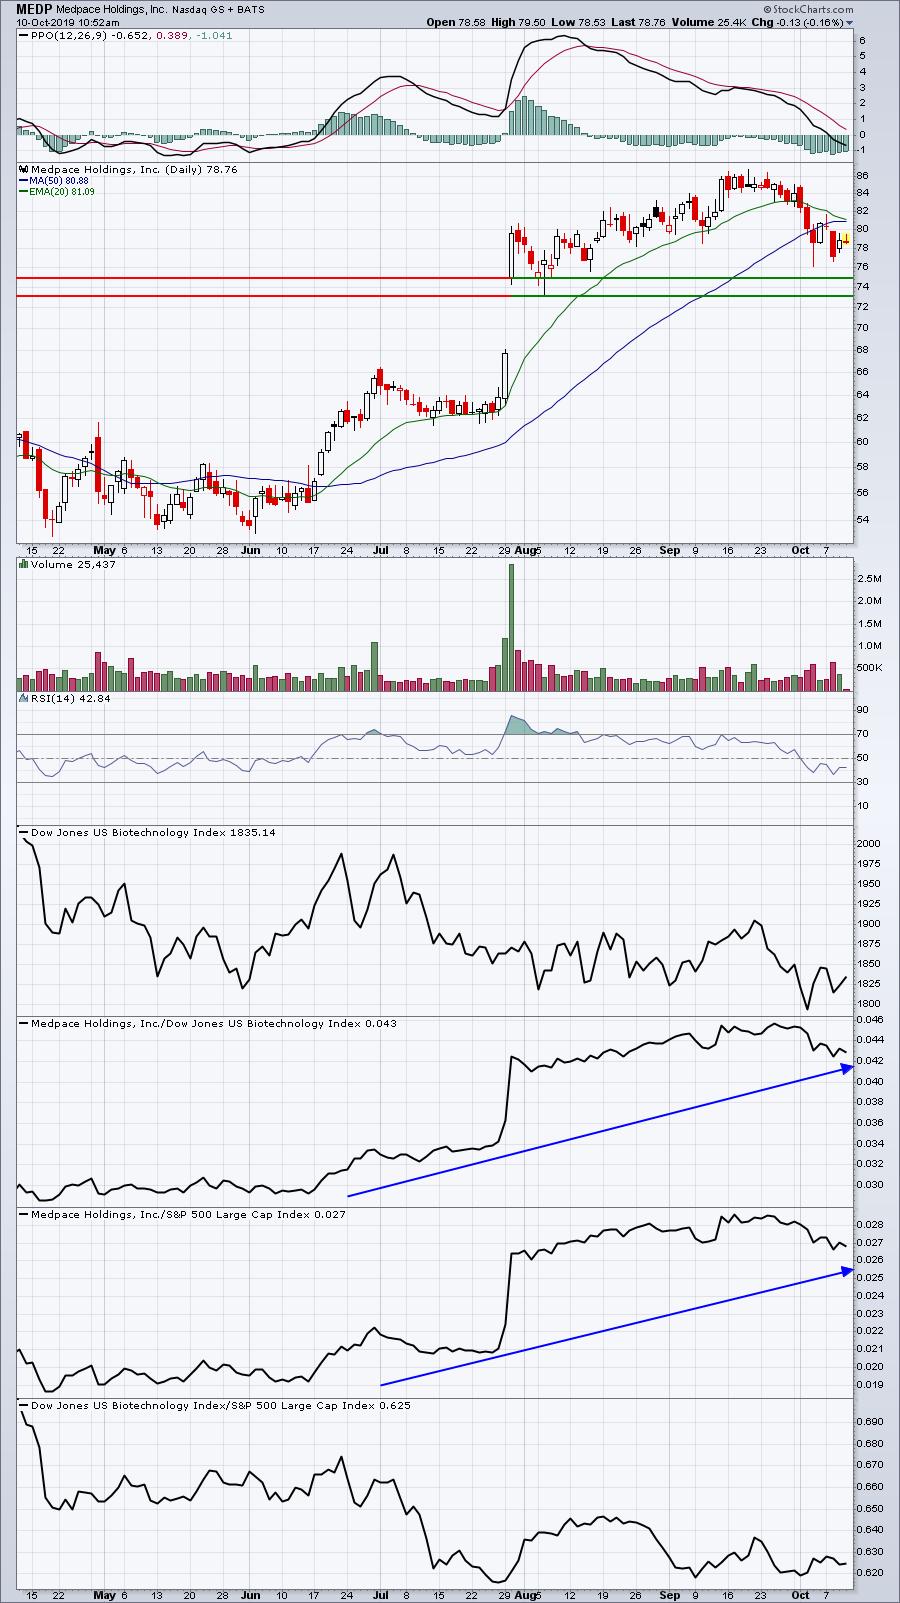
MEDP has been a bright light in a very dark biotech space ($DJUSBT). The weakness in the DJUSBT might allow MEDP to see enough selling to reach key price support closer to 75. That's where the best reward to risk would be found for entry.
SKY:
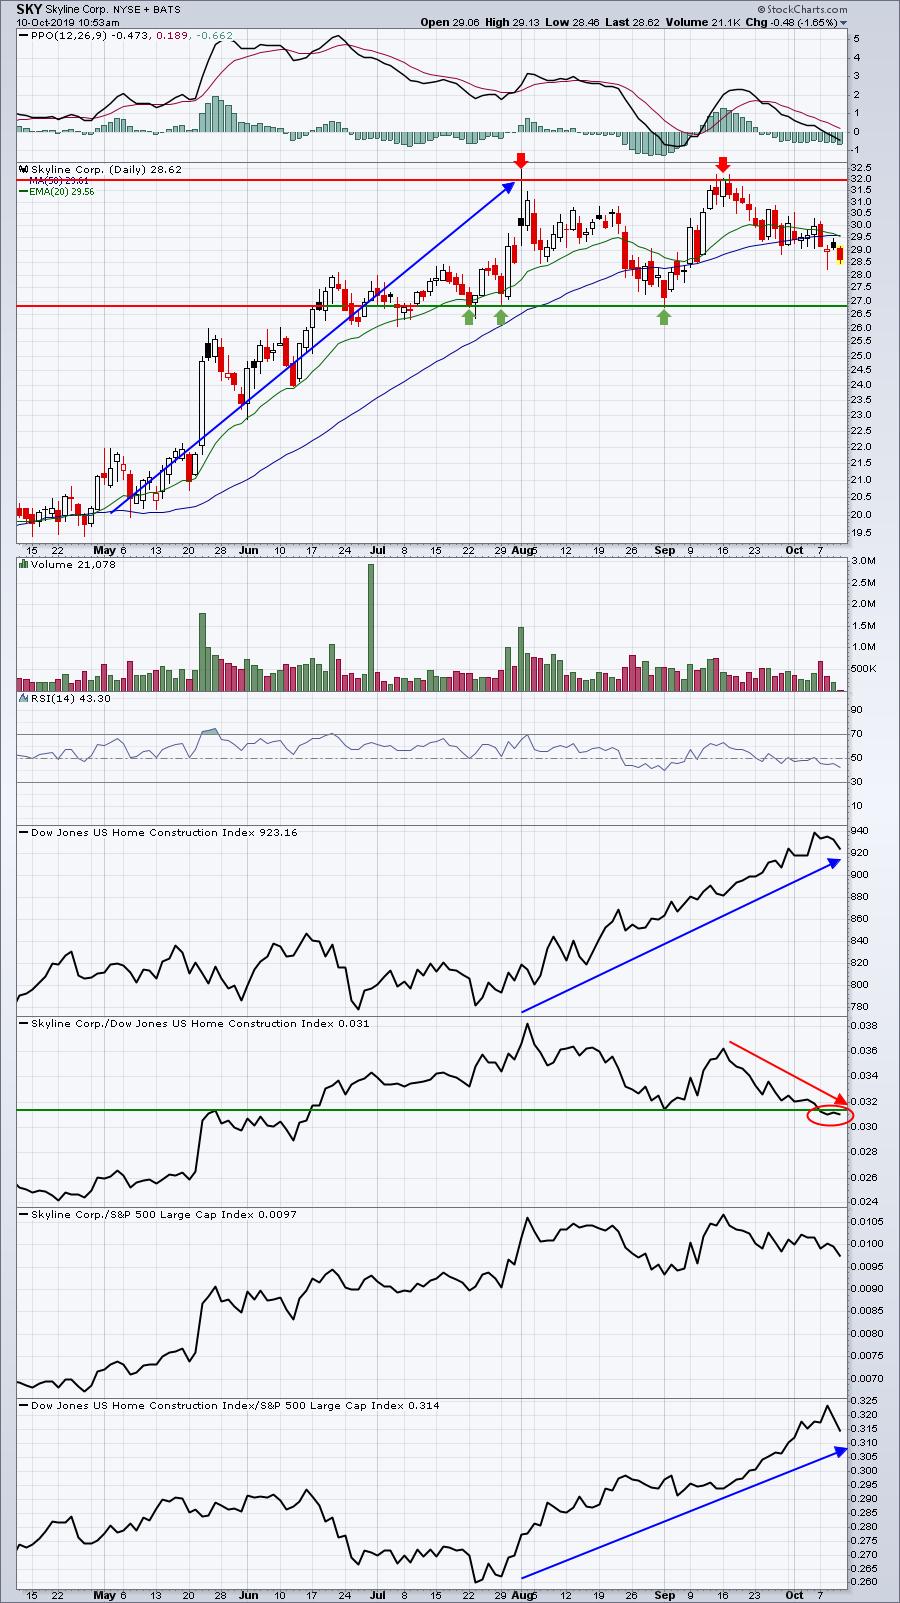
SKY, after being a home construction ($DJUSHB) leader for months, has fallen upon hard relative times of late. It's broken to a 4 month relative low vs. the DJUSHB. I wouldn't give up on SKY just yet, however, as it moved 50% higher in 3 months prior to the current consolidation. Instead, I'd view continuing weakness as an opportunity, especially if SKY approaches 27 price support.
Active Trade Alerts
Here are our current active trade alerts:
NOC (+0.83%) - defense stocks ($DJUSDN) are rising today and NOC is as well, although it's really been doing more consolidating than rising this week.
ZBH (+1.03%) - thus far, the medical equipment group ($DJUSAM) has held price support and attempting to bounce. ZBH is showing leadership by outperforming its peer group.
TWTR (+0.81%) - Internet stocks ($DJUSNS) have rallied a bit the past week or so, although TWTR hasn't participated in that. The key for the DJUSNS will be to hold 1700 support and clear its overhead resistance. That chart is shown above in the Sector/Industry Focus section.
ZUMZ (-0.03%) - has been a bit volatile in the last couple trading sessions, but remains above its key price support level of 29.00. We still have a second entry at 29.50 that is open and unfilled.
All 4 active trade alerts remain solid technically.
Today's Movers
I ran a scan of U.S. stocks (no ETFs) that have traded at least 50% of their average daily volumes as of 10:20am EST and with a SCTR score of at least 50. The following 12 results were returned:
ADSW, AMX, ASUR, BBBY, CVM, DHT, FRO, GNRC, RARX, ROKU, RYAAY, SNN
Of these, GNRC was the most intriguing from a technical perspective:
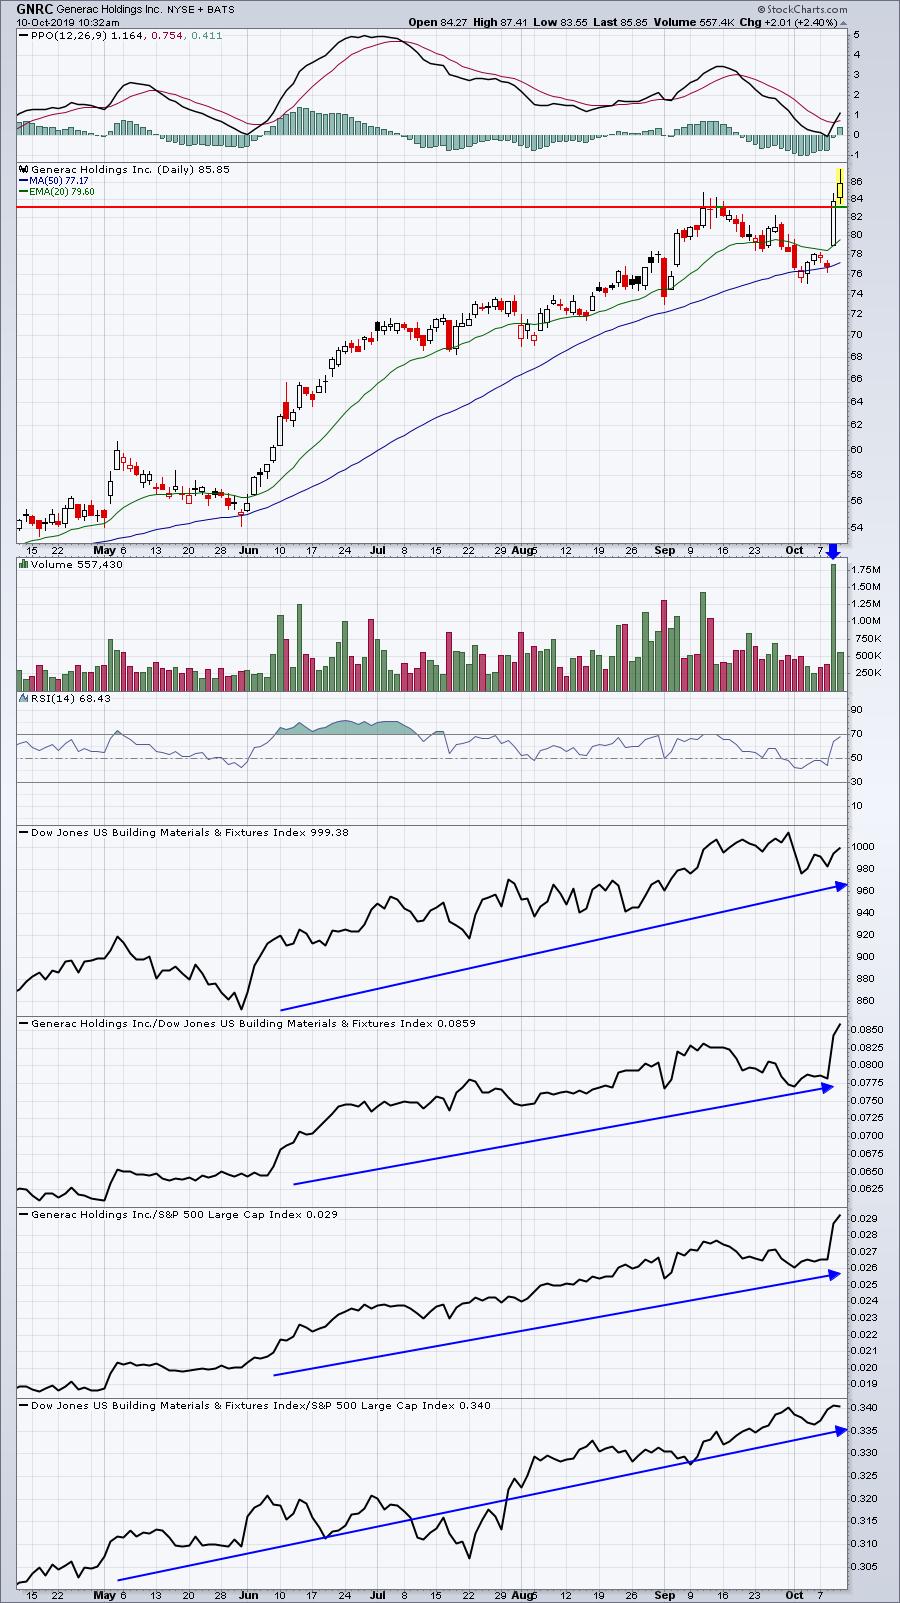
Volume trends are excellent and all indications are pointing to a continuing rise. Pullbacks should hold between 83 (price support) and the rising 20 day EMA, currently at 79.60.
Earnings Reports
Here are the key earnings reports for Friday and Monday:
Friday, October 11:
C, INFY, FAST
Monday, October 14:
None
Economic Reports
September CPI: +0.0% (actual) vs. +0.0% (estimate)
September Core CPI: +0.1% (actual) vs. +0.2% (estimate)
Initial jobless claims: 210,000 (actual) vs. 219,000 (estimate)
Happy trading!
Tom