
EB Weekly Portfolio Report - Sunday, October 27, 2019
Portfolio Rules and Objectives
Here are the common traits and objectives of each portfolio:
- There are 10 leading stocks from 10 leading industries in each portfolio (at the time of selection)
- They are held for an entire 90 day period, with no stops in place
- Every stock will be held through ONE earnings report
- The expectation is that relative winners will carry the portfolio to outperformance
- They are all entered into as of February 19, May 19, August 19, and November 19 (these dates are used as we are generally past the majority of earnings reports by these dates)
- Primary objective is to outperform the benchmark S&P 500
Here are several considerations for EB members:
- I would expect the Aggressive portfolio to be the riskiest, followed by the Model portfolio, and then the Income portfolio
- The Income portfolio stocks will all pay dividends, with the expected average dividend yield to be at least 1.5%
- Drawdowns (losses) should be much milder on the Income portfolio, with much more volatility on the other two
- You should own or trade these stocks in whatever manner is most comfortable for you; while we buy all 10 stocks as of the dates identified above, feel free to trade certain stocks or wait for pullbacks if the stocks are overbought
- We have no idea what risk each member is willing or able to take. We are not registered investment advisors so be sure you understand the risk you take.
- EarningsBeats.com shareholders/employees may own all or some of the portfolio stocks from time to time.
Weekly Summary
Benchmark S&P 500:
The S&P 500 is poised to make a breakout to an all-time high. Last week was historically the worst week of the year, dating back to 1950. That didn't even slow the bulls down. The S&P 500 pushed higher by 1.22%, gaining 36 points last week, to close at 3022, just 3 points below the all-time high close of 3025. The breakout is coming, but one obstacle is the upcoming Fed meeting, which will be held on Tuesday and Wednesday this week. Below target inflationary expectations should allow the Fed to once again lower the fed funds rate. As I've pointed out on several occasions, our economy doesn't need it. That's not why I'm suggesting it. The U.S. needs to restrict the strength of its currency and one way to do it is to lower interest rates. That will put upward pressure on commodity prices and lift inflation to the Fed's target levels. The lower rates will, however, add to economic growth, so the Fed lowering rates this week is a win-win, in my opinion. Here's a look at the S&P 500:
Weekly:
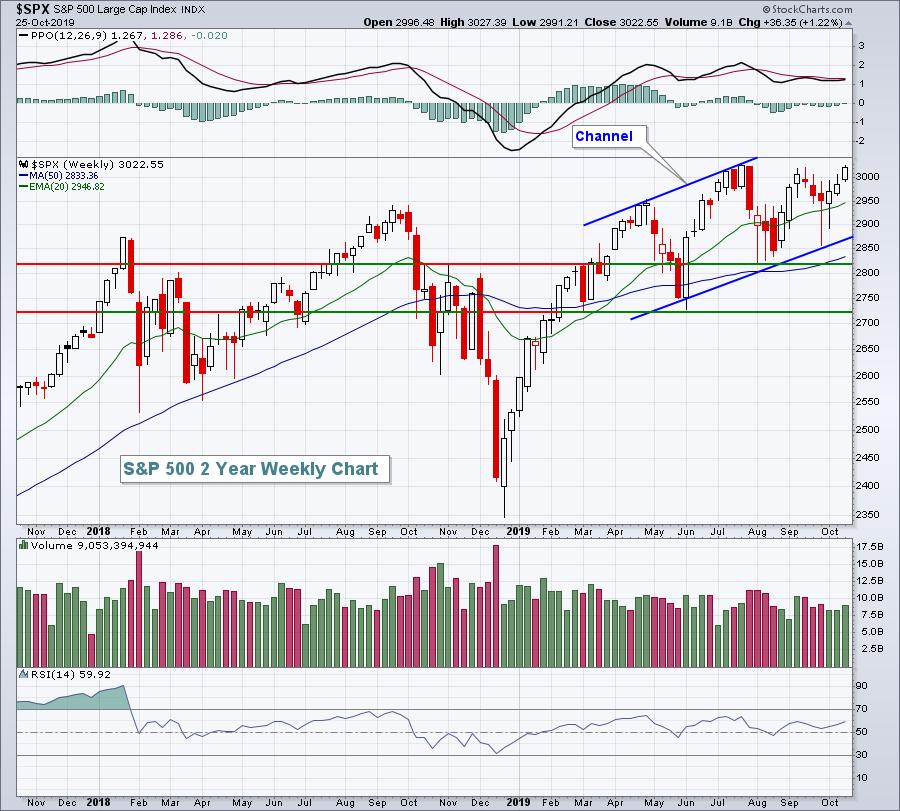
We saw considerable weakness in the S&P 500 a month or so ago and I pointed out a possible channel forming on the weekly chart. The above is the current view of that channel, which remains in play.
Daily:
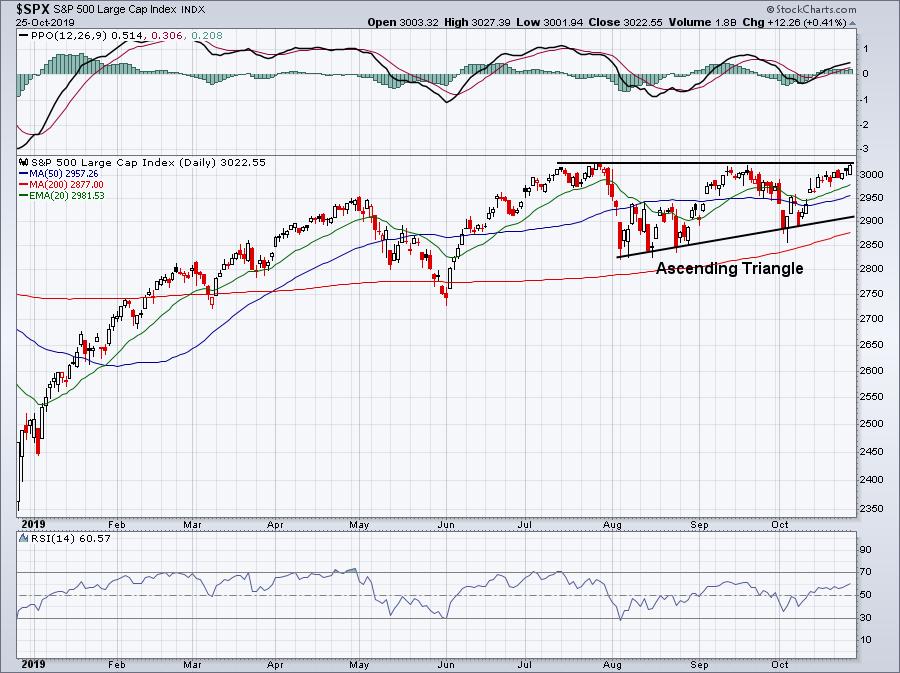
The ascending triangle still looks solid and quite bullish. A breakout would measure from the 3025 initial high down to the first low close to 2825, or roughly 200 points. Therefore, if we get the breakout, don't be shocked to see the S&P 500 above 3200 over the next couple months. I think we could see a very strong rally into year end and 2020.
Despite the strength last week in the S&P 500, we need to be mindful of where the strength occurred. Here's a quick glimpse of last week's sector winners and losers:
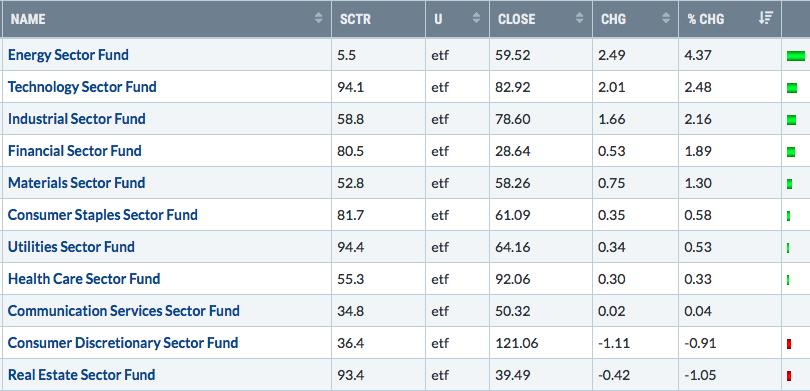
Our portfolios struggled again last week, especially on a relative basis, and there were two primary reasons. First, a lot of strength last week was found in energy (XLE), where we have no representation. That's been a great call for the past year as energy has been the worst performing sector. However, last week it had a negative impact.
The bigger problem, though, has been the shift over the past two months from aggressive growth stocks (IWF) to more defensive value stocks (IWD). While the S&P 500 challenged its all-time high and gained more than 1% last week, check out this continuing relative shift:
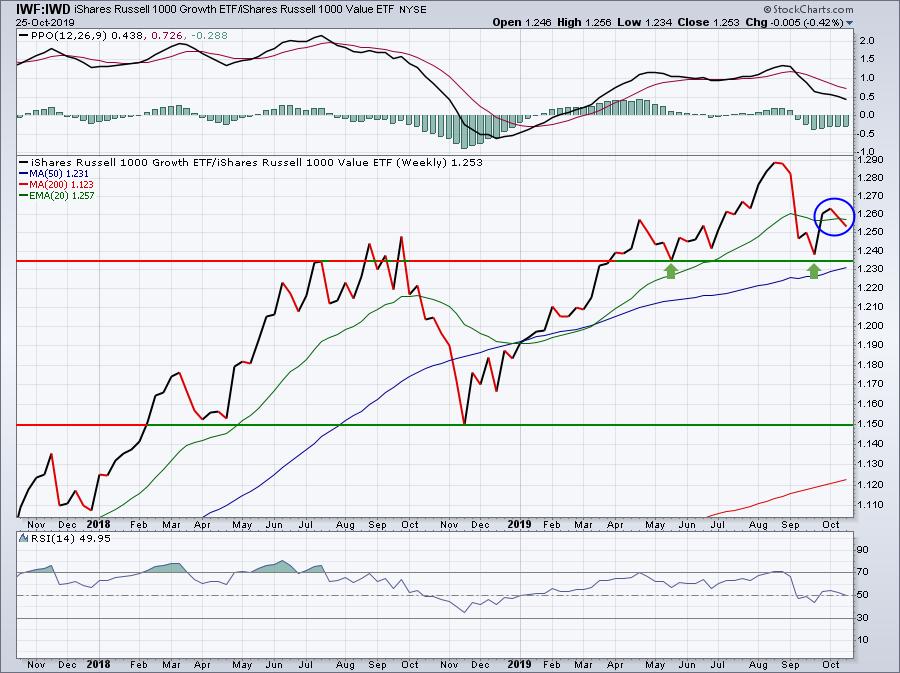
I believe growth stocks will regain form in time, but whether it happens before November 19th remains to be seen. Without a recovery in the above ratio, I don't see our portfolios making up ground on the S&P 500 unfortunately.
Model Portfolio:
The Model portfolio lost 2.12% last week and is now down 4.49% since August 19th, the date of the last selection process. All of last week's loss can be attributed to the reaction to Twitter's (TWTR) disappointing quarterly results. Here is a current look at the Model portfolio's user-defined index that I track daily:
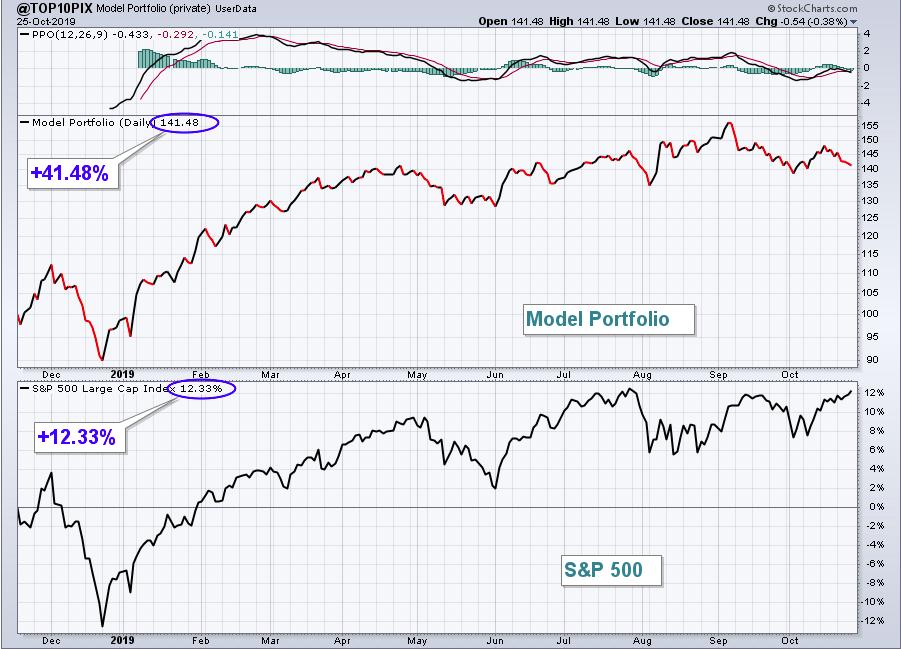
Over the past couple months, the Model portfolio's chart tracks very closely to the IWF:IWD relative chart that I posted earlier.
Here's a recap how each stock in the Model portfolio performed last week:
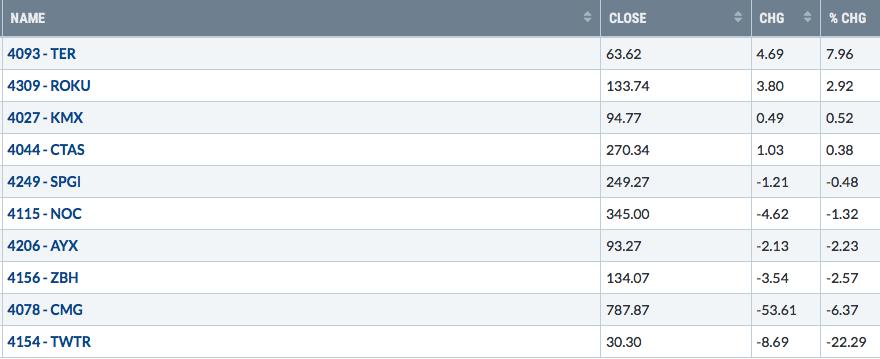
TWTR accounted for more than 2% of the portfolio's 2.12% loss last week. I suggested last week that TWTR and AYX would likely need to recover after earnings for the Model portfolio to push back into positive territory vs. the benchmark S&P 500. Well, TWTR's report is in the books and it wasn't pretty. EPS came in at $.17, short of the $.20 that was expected. Growth stocks rely on improving growth prospects, not declining prospects. While TWTR could recover off of oversold conditions, I suspect it's longer-term outlook is not very good:
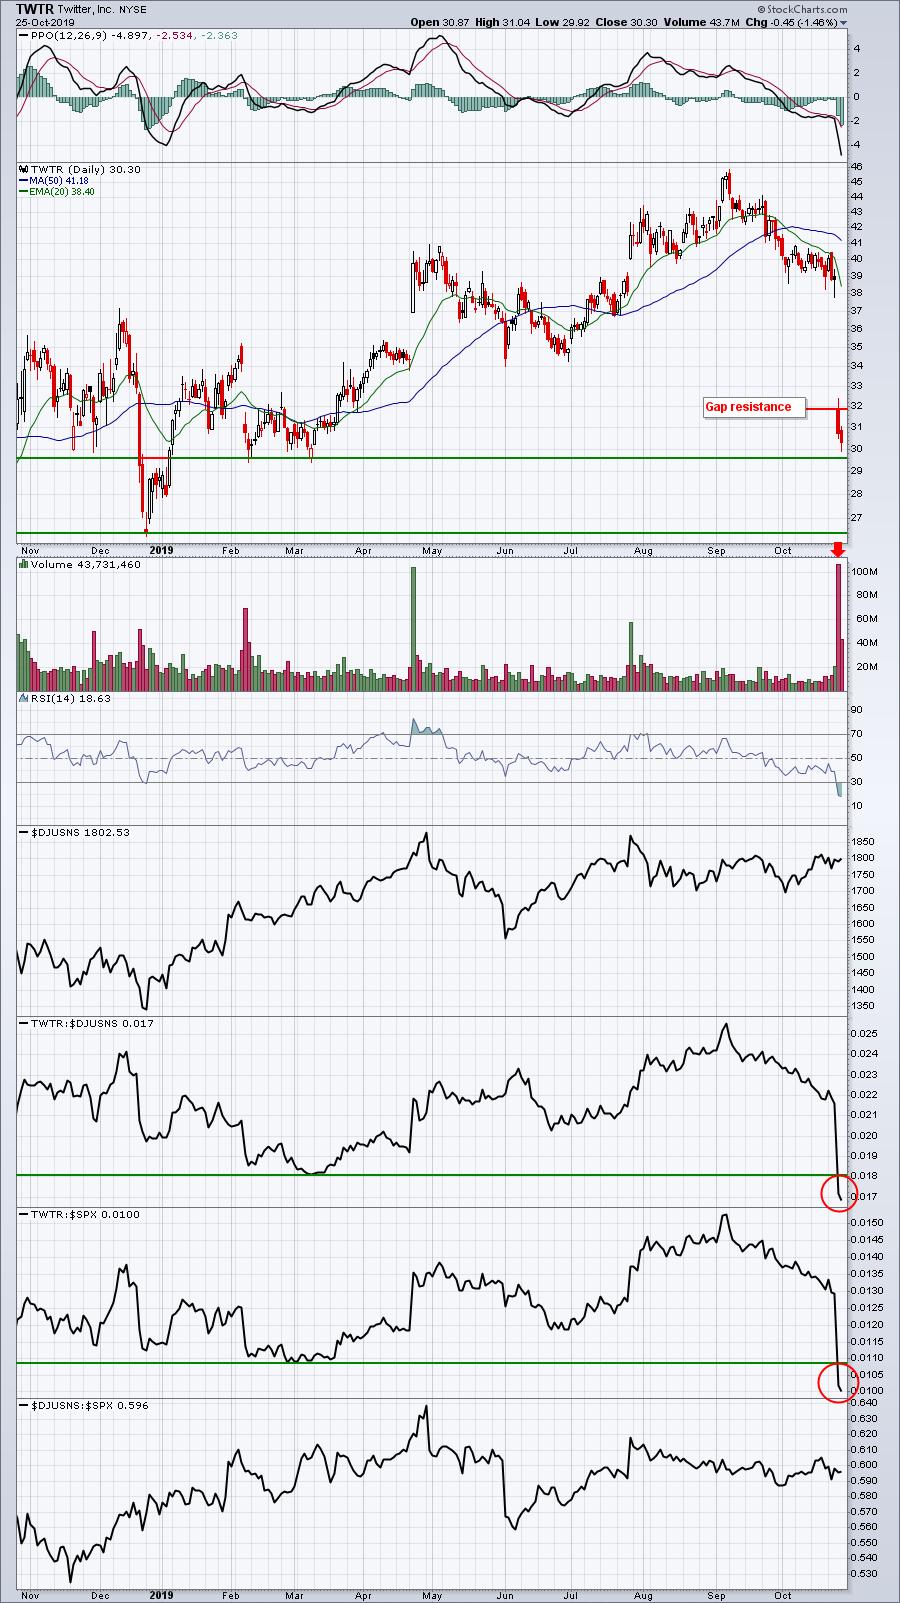
After the earnings-related gap lower on Thursday, volume was MASSIVE as over 100 million shares changed hands. And it kept going lower after the gap down. That's indicative of a lot of distribution so getting TWTR back above that opening gap just beneath 32 will be challenging. That would be a point to consider selling if you hold TWTR.
Meanwhile, Teradyne (TER) beat both revenue and EPS estimates and soared after its quarterly results were released on Tuesday evening:
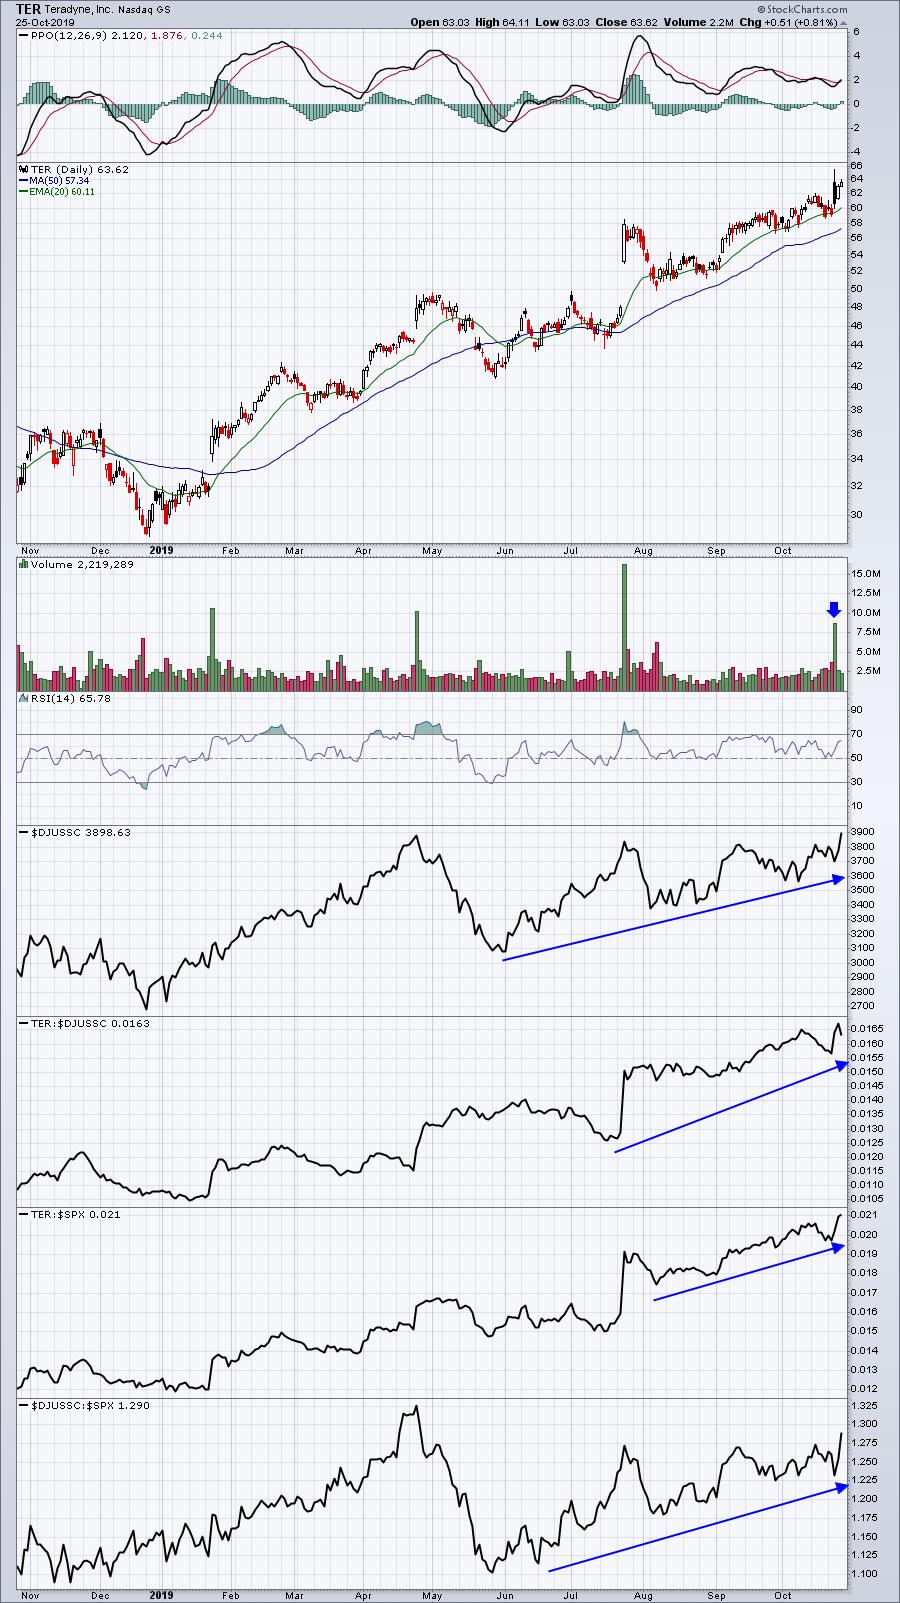
Relative strength heading into its earnings report was much stronger than TWTR and that is a clue to consider if you debate whether to hold stocks into earnings or not. My opinion is that there's a much better chance for positive results and reaction if it's a stock that's in favor heading into its report.
Aggressive Portfolio:
The Aggressive portfolio gained 0.67% last week, but trailed the S&P 500's 1.22% gain. The underperformance of the Aggressive portfolio continues, although we have seen notable rebounds in individual stocks there. Here's the portfolio's chart since inception:
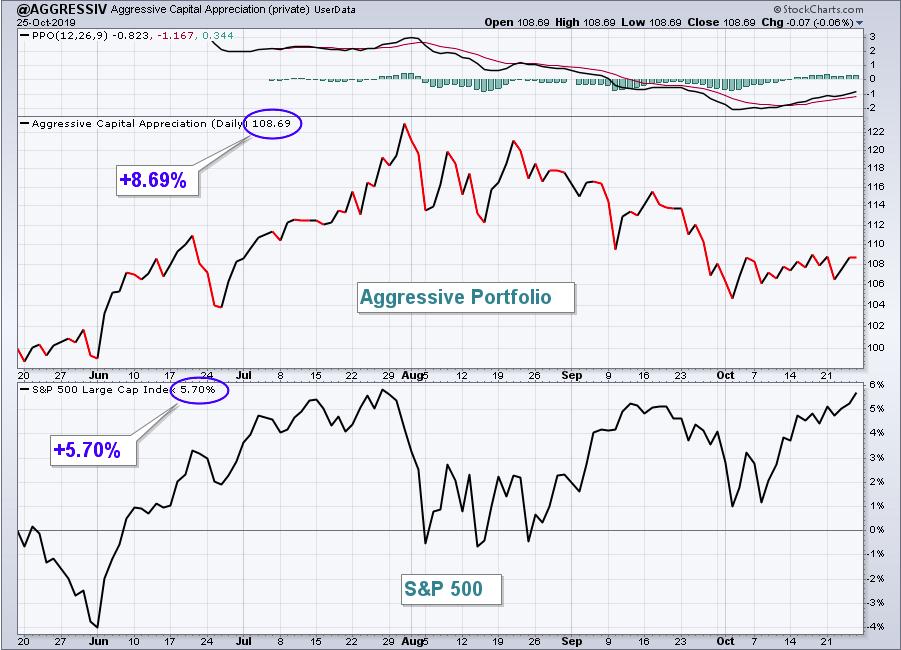
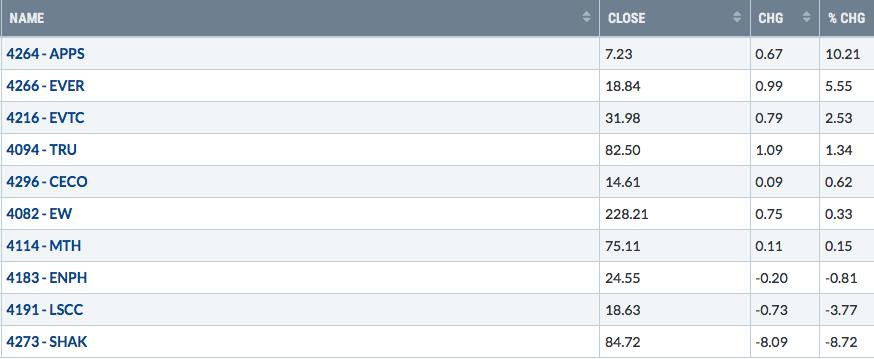
There's been little recovery in the portfolio in October, despite a solid recovery in the S&P 500. The shift to value stocks certainly isn't helping here. As for last week's individual performances:
A very solid rebound in Digital Turbine (APPS) is worth noting because of the increasing volume that accompanied it:
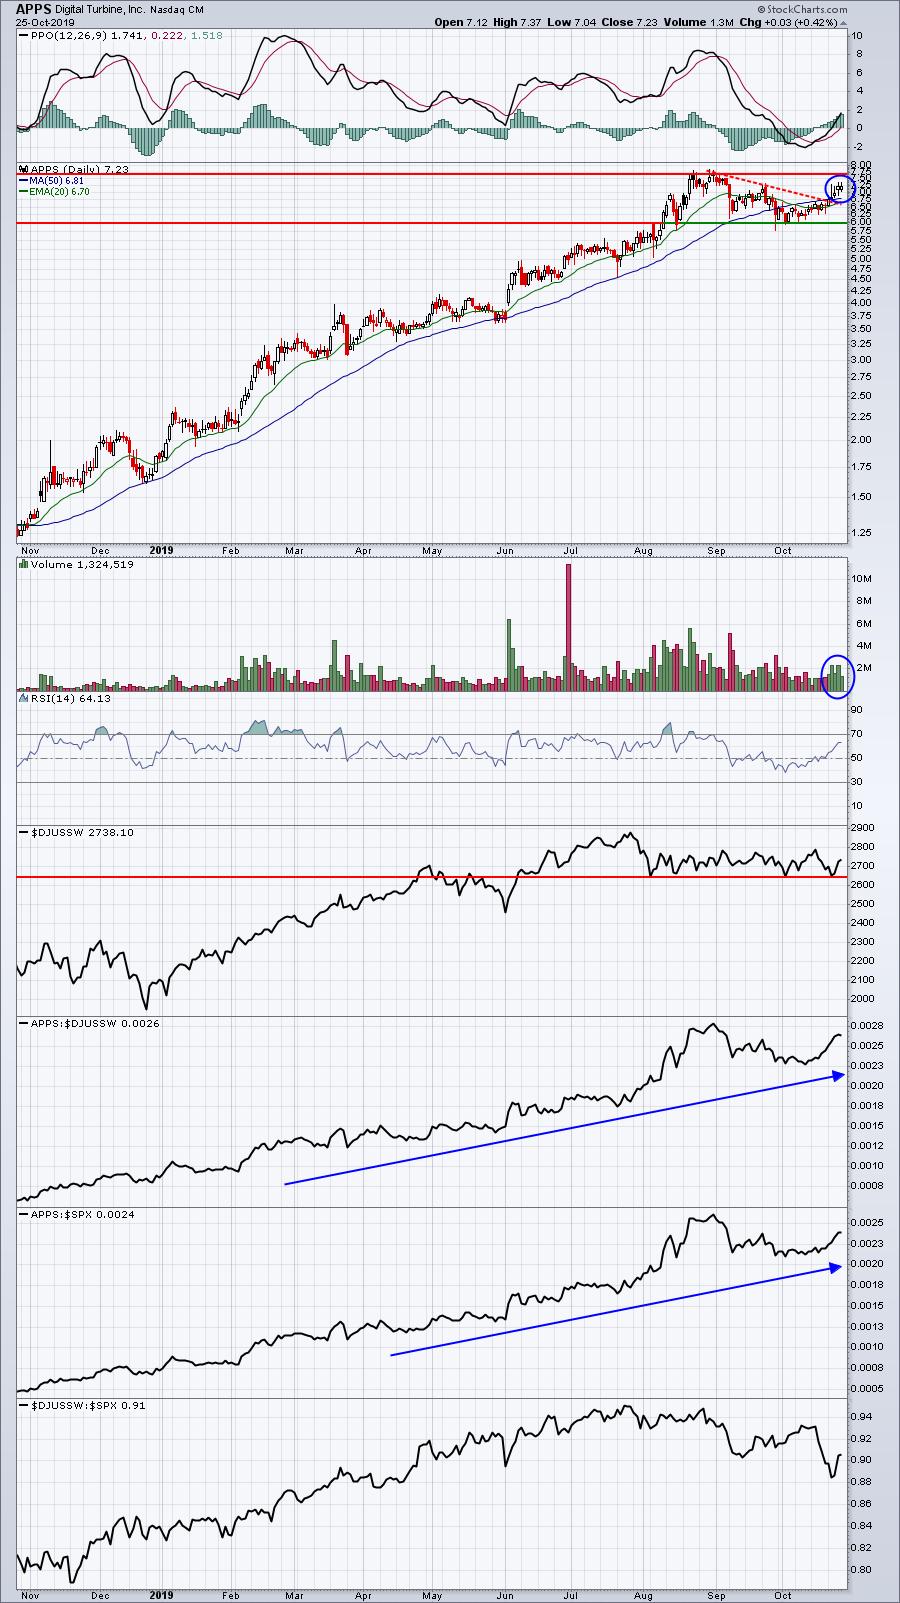
I expect we'll see a strong report from APPS based on its trading pattern. However, that doesn't guarantee that we'll break out of this consolidation pattern from 6.00-7.50 that we've been in. Last week we saw Chipotle Mexican Grill (CMG) in our Model portfolio break out just prior to earnings and then quickly weaken after they reported great results.
While growth stocks have been in relative decline the past two months, restaurant stocks ($DJUSRU) have been the poster child for that relative underperformance. The DJUSRU hit a high near 2100 on September 6th and closed on Friday at 1882. The group broke out above 1850 in early June, so bottoming near this level would make technical sense. The Aggressive portfolio's worst performer last week was Shake Shack (SHAK), which is being dragged lower by weak restaurant stocks. Here's the current outlook for SHAK:
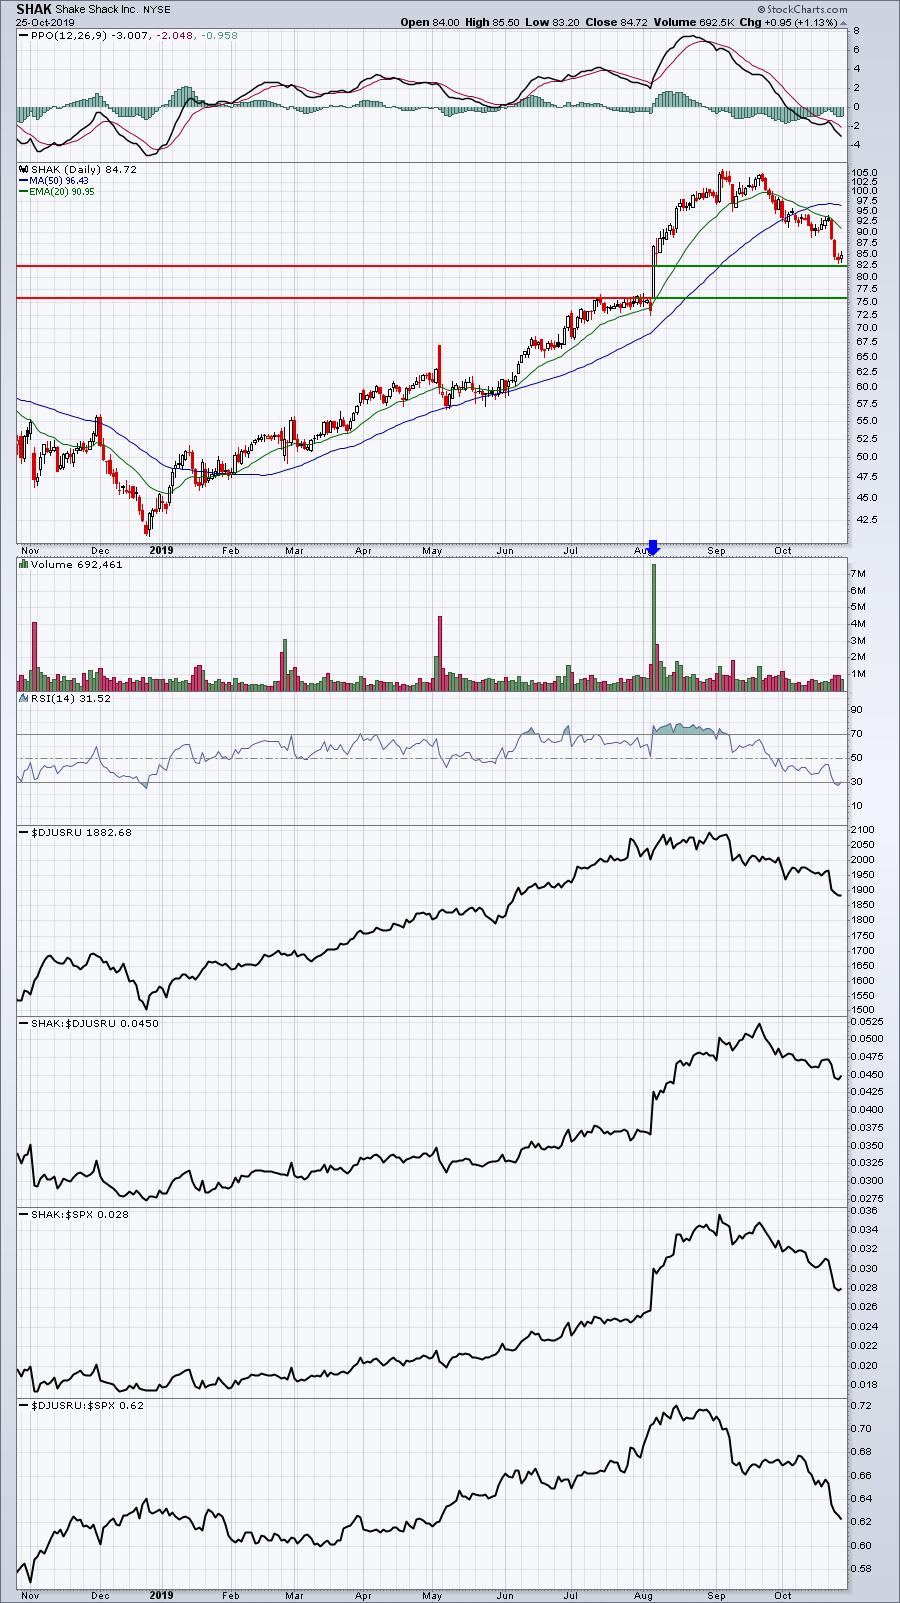
After its last surge post-earnings in early-August, the reaction low the next day was 82.50 or so. That's where the buyers stepped back in. I suspect we'll see buyers re-emerge this week on SHAK. Failure to hold 82.50 would open the door to its breakout level near 76.
Income Portfolio:
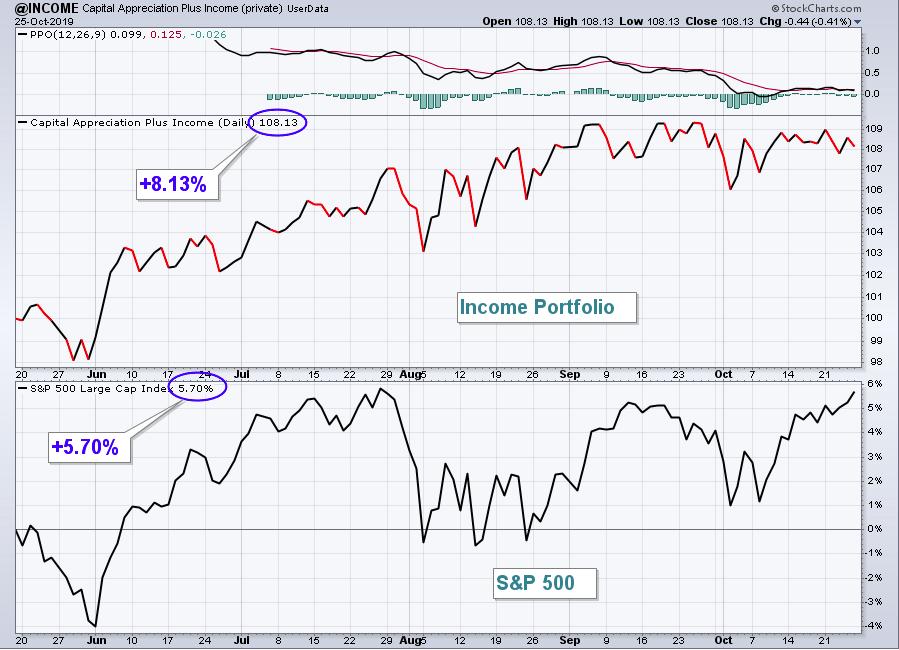
The Income portfolio was relatively flat last week (-0.13%), but did trail the S&P 500 like its other portfolio counterparts. It was probably the most volatile week thus far for this portfolio. However, strength in a couple stocks offset weakness in others. Here's a chart of the Income portfolio since its May inception:
Here's how the individual stocks in the Income portfolio performed last week:
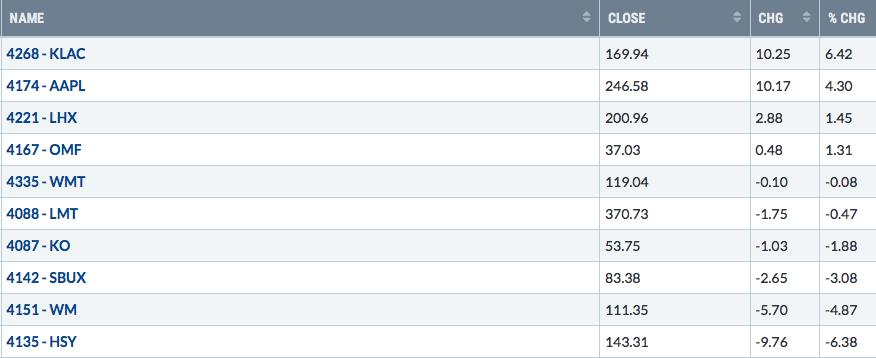
KLAC was buoyed by a huge earnings report from Lam Research (LRCX), while AAPL has simply maintained excellent relative strength heading into what should be an earnings blowout this week (Thursday after the bell). While these two companies led without reporting earnings, both HSY and WM trailed because of earnings reactions. Let's look at these last two individually:
HSY:
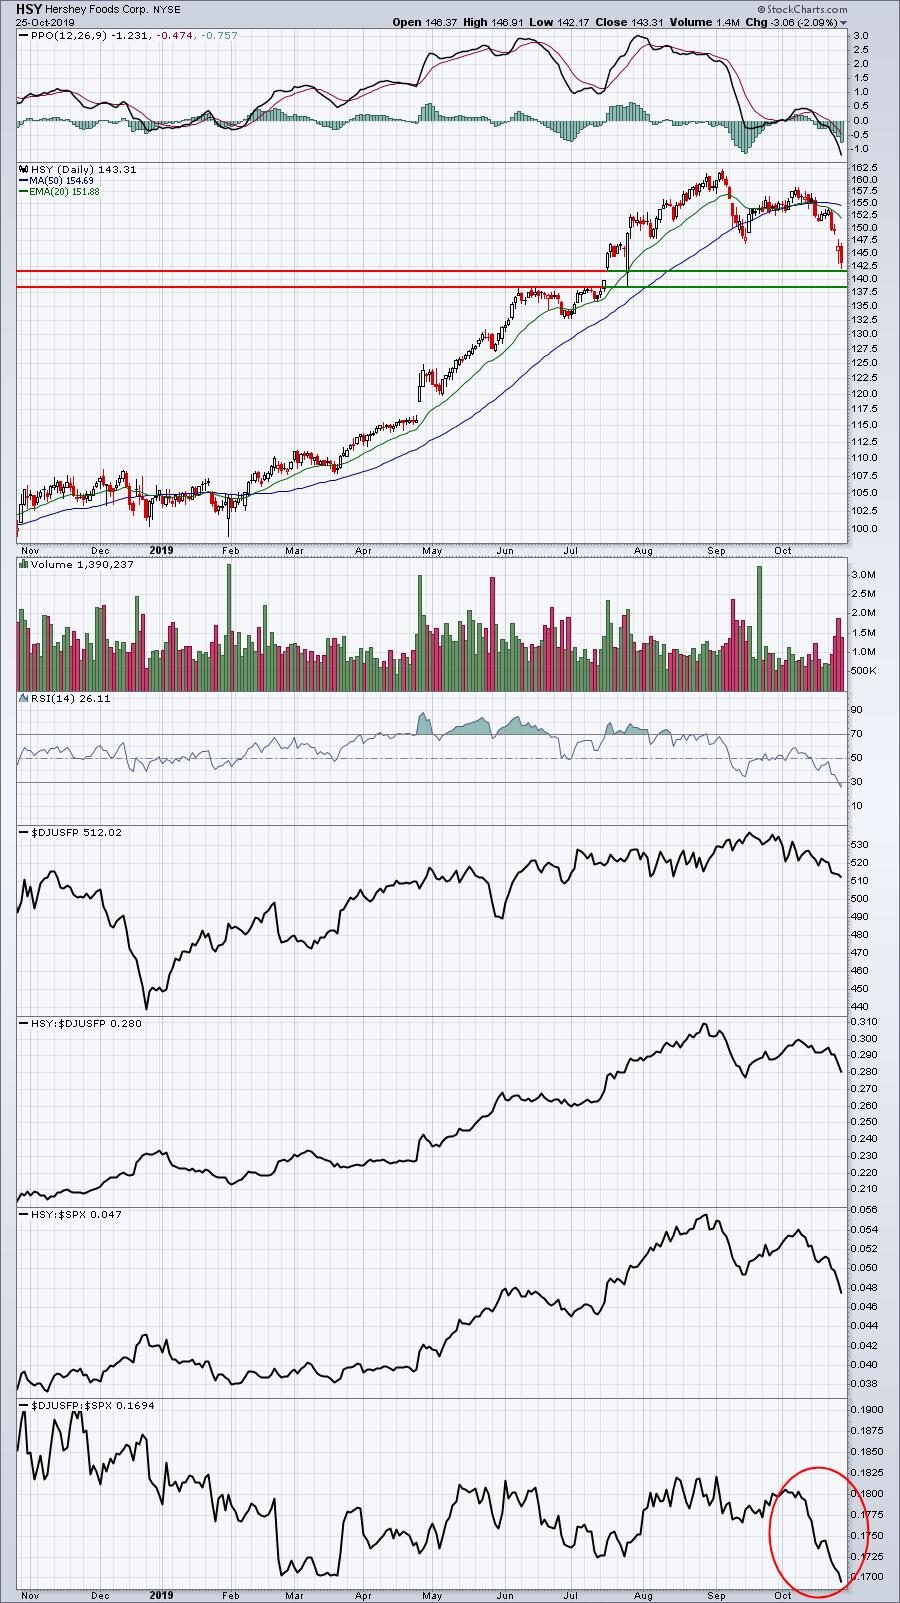
HSY actually beat its revenue estimate and matched its EPS estimate. Clearly, investors were looking for more. While last week was a mess for HSY, I expect it will find solid support in the 138-142 support area. October has been a very bad month for food products companies ($DJUSFP) on an absolute as well as relative basis, as you can see from the red circle above.
WM:
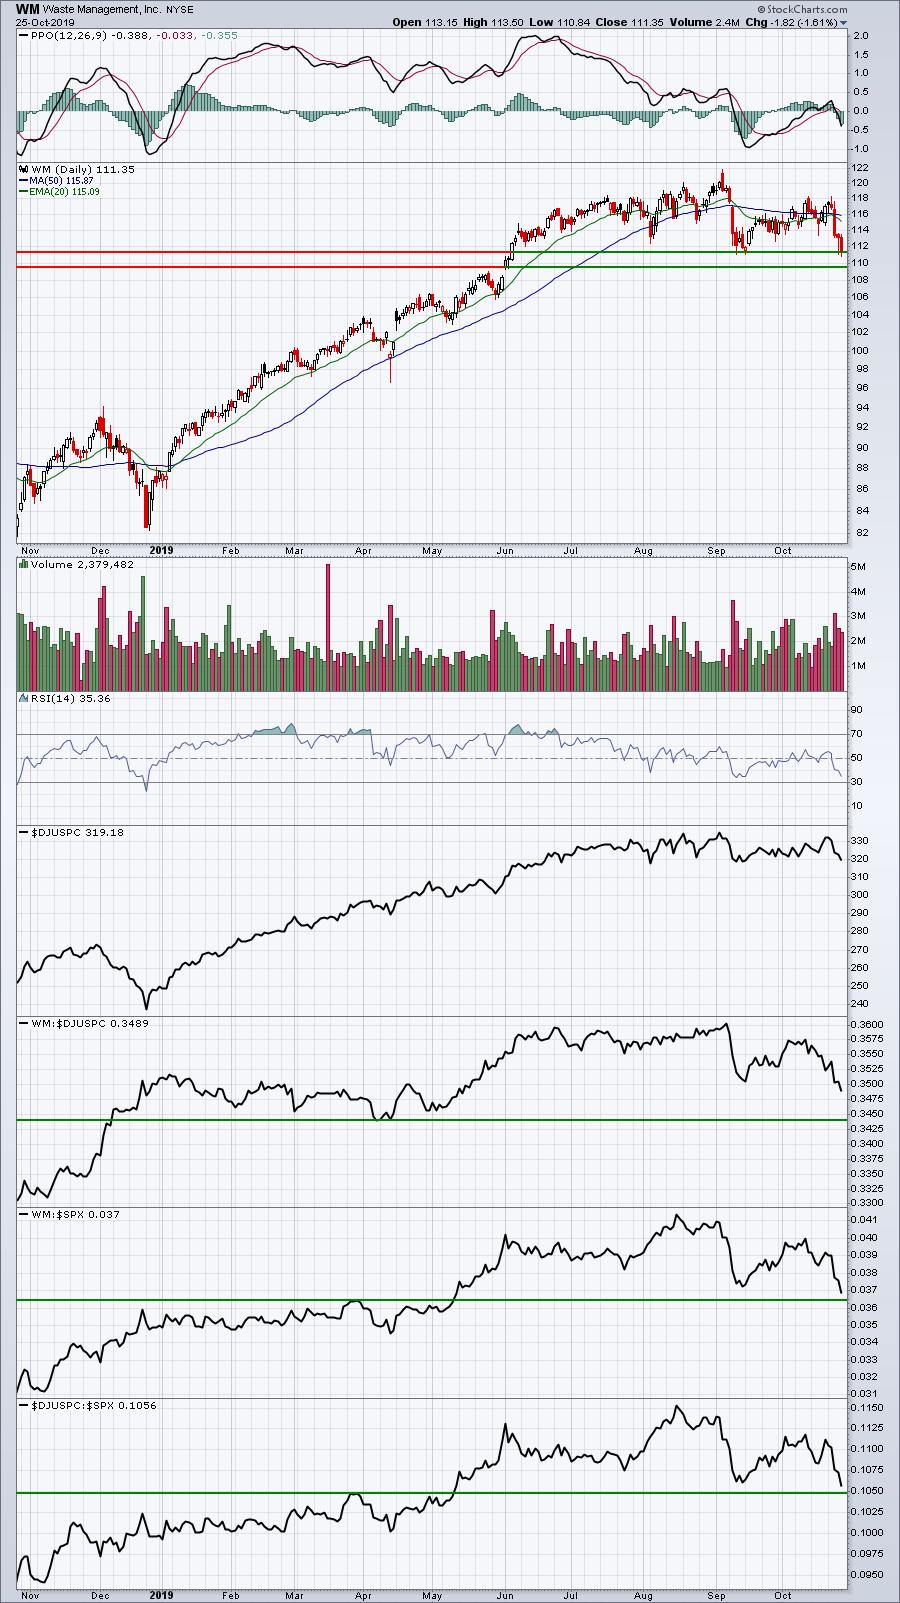
Waste disposal companies ($DJUSPC) have been downtrending and last week pushed to a 5 month relative low. WM struggled as it missed its revenue estimate. Earnings surpassed expectations, but that wasn't enough in what's become a difficult environment for waste disposal in general. 109.50-111.25 should offer up support in the week ahead - if the recent selling continues.
Summary
The good news is that the S&P 500 is poised to make another stab at an all-time high closing breakout. While new money is coming into the market, the bad news is that the "growth to value" rotation has continued and is no doubt pressuring our portfolios as they're very much growth-oriented.
While this quarter has been humbling, to say the least, I do not waver in my belief that relative strength should play a part in everyone's portfolio. There's a reason why the Model portfolio, with 11 months under its belt, has outperformed the S&P 500 by nearly 30 percentage points and it's sticking with relative strength.
I wish everyone a great week ahead!
Happy trading!
Tom Bowley, Chief Market Strategist
EarningsBeats.com
"Better timing. Better trades."