
EB Daily Market Report - Wednesday, October 30, 2019
Executive Market Summary
- October nonfarm payrolls will be out on Friday, but this morning's ADP employment report matched estimates
- General Electric (GE) is up more than 10% on its quarterly earnings report
- U.S. crude inventory increased as the price dropped 1.64% to $54.63 per barrel; energy (XLE) is down 1.62%, easily the worst performing sector
- Defensive sectors are leading the action today as our major indices see some profit taking; our major indices are bifurcated with mostly small gains/losses
- We added a 3rd Active Trade Alert today (ROST);
Market Outlook
Today is Fed day. While I was worried throughout much of 2019 because the Fed continued disappointing, I believe they're beginning to get it right with their accommodative moves. It's widely anticipated that we'll see another 25 basis point cut this afternoon, but I would not be shocked to see 50 basis points. Inflation is below target levels and one way to "stabilize prices", which is a mandate of the Federal Reserve, is to weaken the U.S. Dollar ($USD). That, in turn, would inflate commodity prices and help inflation return to the Fed's 2% target level. Honestly, I feel like this is nirvana for U.S. equities - a lowering interest rate environment with modest and improving economic activity in 2020.
One chart to watch for the next few months will be the yield curve. It's defined a number of different ways, but I view the 10 year treasury yield vs. the 2 year treasury yield ($UST10Y-$UST2Y) as a key barometer for bank profitability. Banks ($DJUSBK) have been rolling of late, so after the Fed meeting and for the next few weeks, keep checking out this chart:
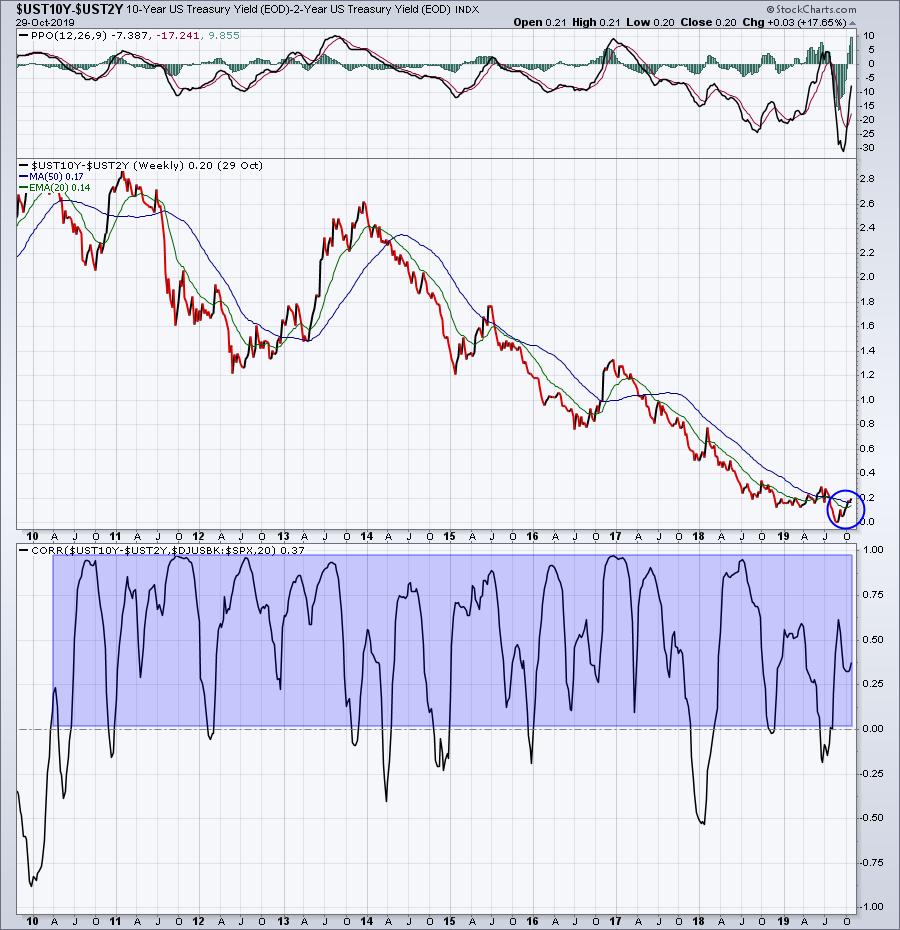
The yield curve briefly went negative recently, but we've now begun to turn back higher. I expect this spread to grow, which would be very bullish for banks. The blue-shaded area in the bottom panel show the positive correlation between the direction of the yield curve and the relative performance of banks vs. the S&P 500.
The Fed will announce its latest policy statement at 2pm EST today and banks will be taking a cue from the Fed's statement and outlook. Stay tuned.
Sector/Industry Focus
Healthcare (XLV) has been leading the market higher this week and it's making an all-time breakout of its own:
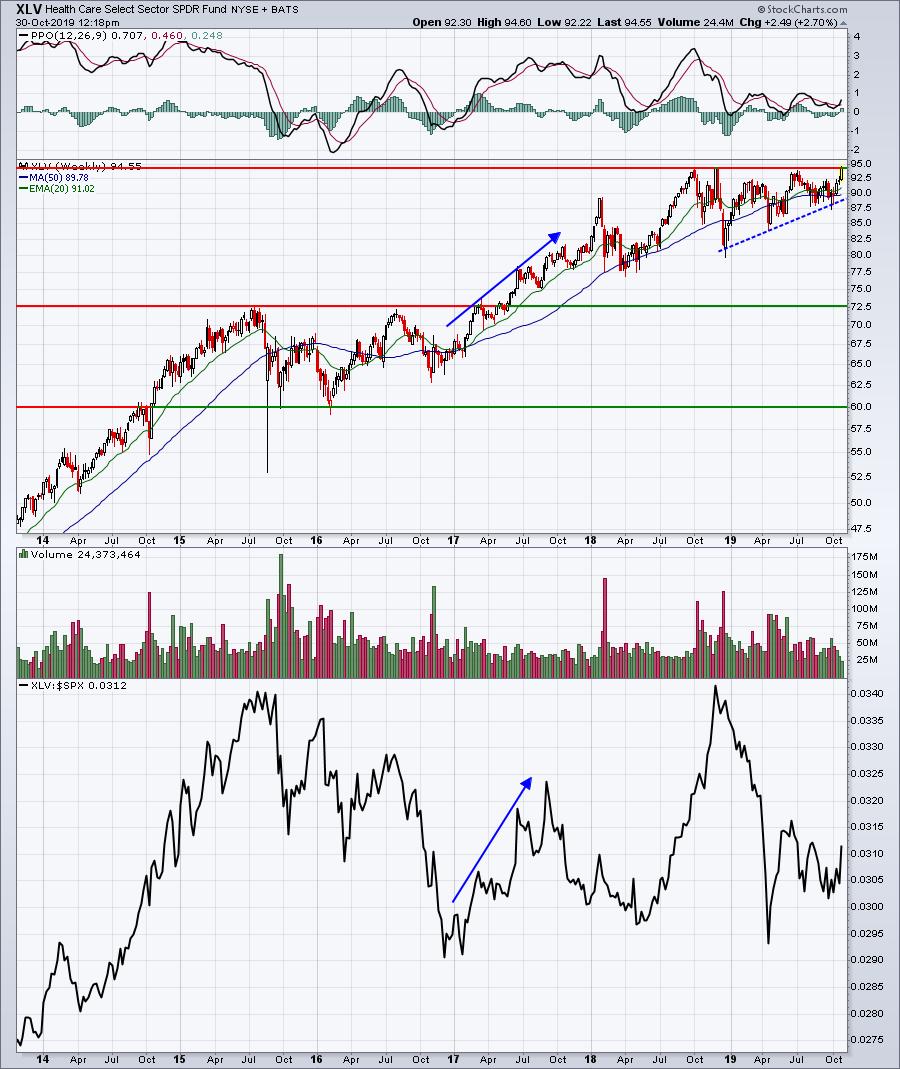
The breakout is out of a bullish ascending triangle continuation pattern. I'd expect to see an absolute and relative rally to match what we saw in 2017 as a similar setup was in play then. Longer-term, say for the next few years, I wouldn't expect the XLV to be a relative leader, but I do expect it to go along for the ride.
Strong Earnings ChartList (SECL)
I ran a scan of SECL stocks with RSIs between 40-50 (indicating pullbacks or consolidation) and SCTRs (StockCharts Technical Rank) above 60 and it returned 14 stocks:
EVER, TGT, APPN, BMCH, AIR, BURL, SYNH, WMT, LEN, TTWO, ROST, CCI, HEI, USFD
Of these, APPN and BMCH look interesting. BURL, not shown below, is testing an area of price support as well:
APPN:
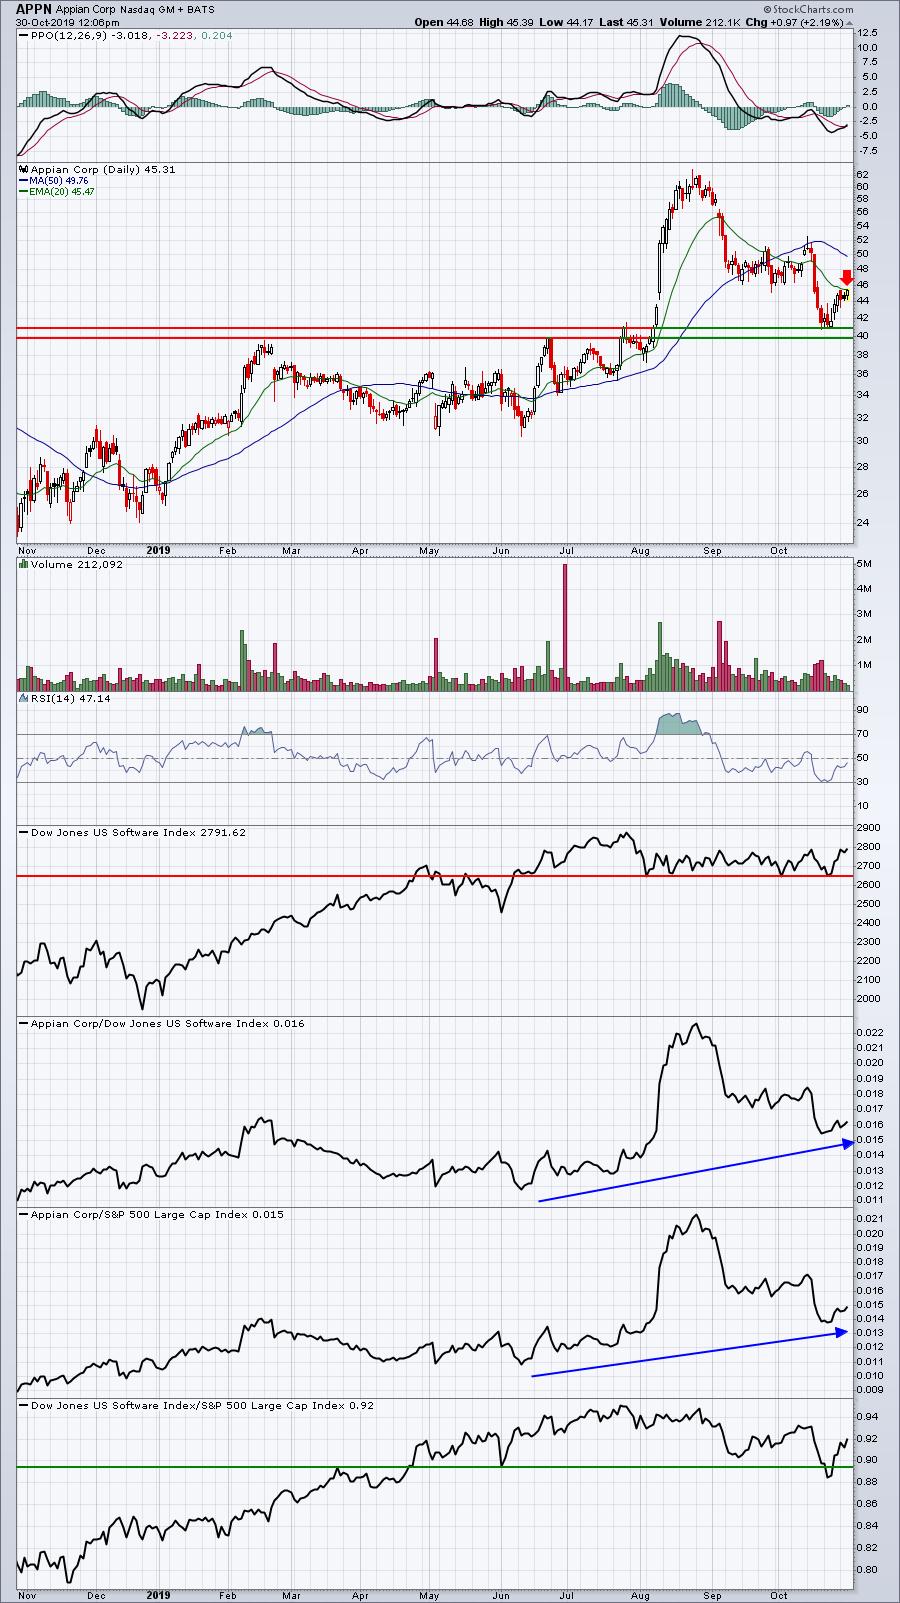
APPN made an incredible move to the upside back in August on extremely heavy volume. Its relative strength was off the charts (well, not literally) as well. It's come all the way back down to key support in the 40-41 area and could very well bounce longer-term from here. But it's also quite risky because it's part of the software industry, where stock after stock seems to be falling apart.
BMCH:
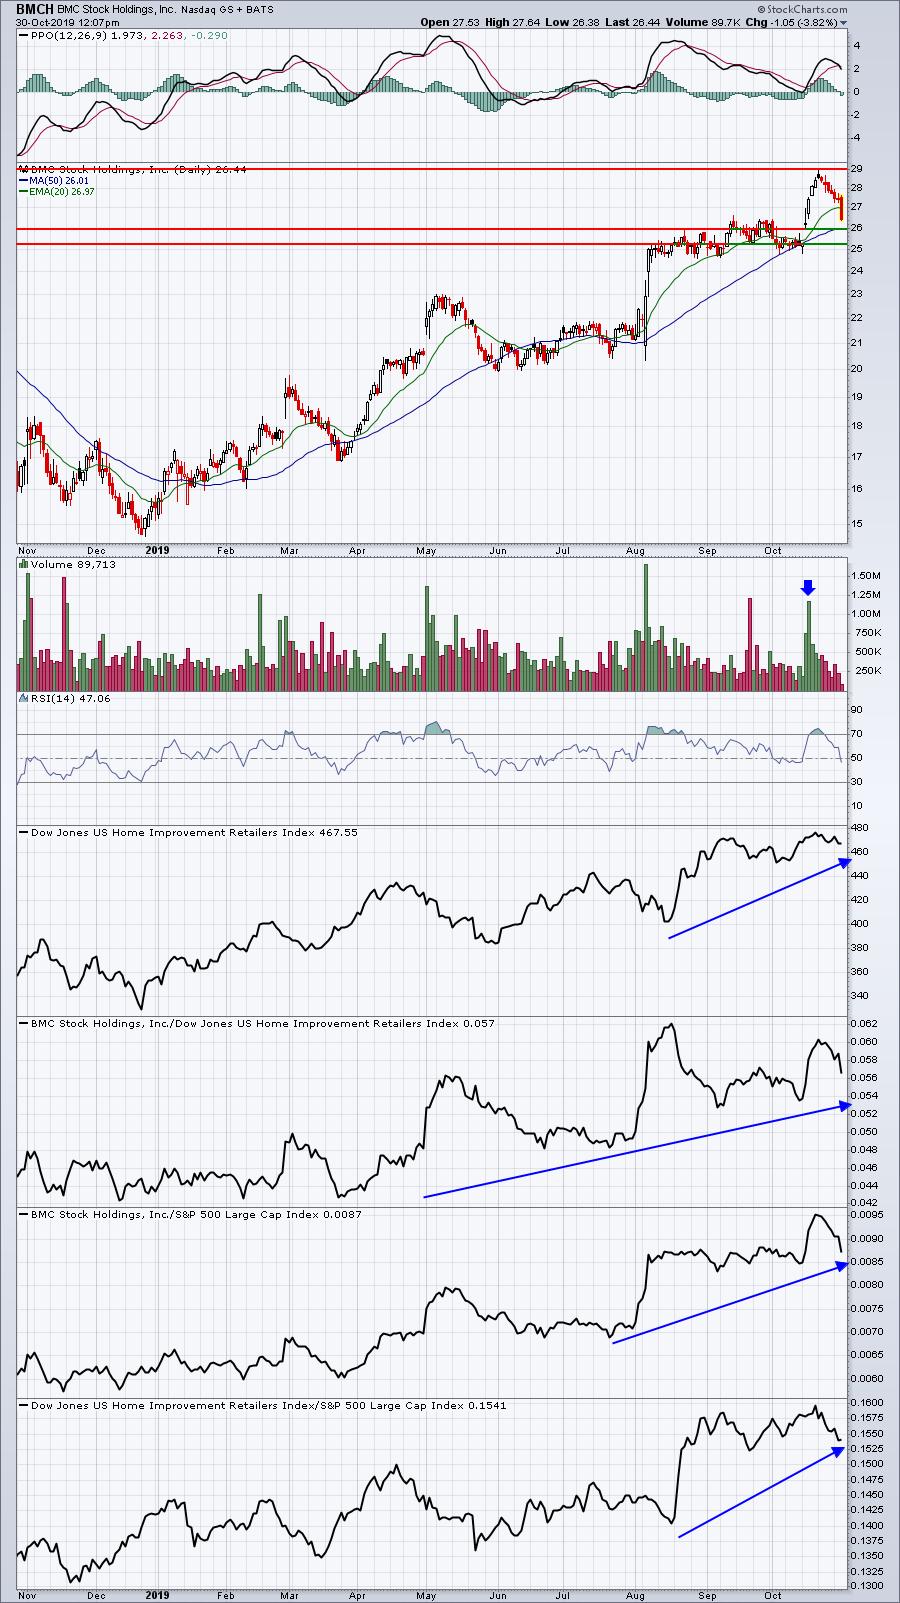
The volume has been dwindling here on BMCH over the past 1-2 weeks as the stock pulls back close to 10%. Home improvement ($DJUSHI) has been a very strong area of the market in 2019, especially the past couple months, so considering entry here as we approach the two gap support levels could make a lot of sense.
Active Trade Alerts
Here are our three current active alerts after issuing an alert on ROST:
ZUMZ (-1.15%) - earnings date is December 5th. ZUMZ is down on very light volume and just beneath its 20 day EMA.
NKE (+0.59%) - recently reported earnings so the next earnings date won't be for another couple months. Our second entry into NKE at 90.50 has triggered to lower our average cost. NKE could not hold recent price support just above 90 and quickly fell to its 50 day SMA at yesterday's close. It's bouncing today off that moving average. We are maintaining a closing stop beneath 87, which would clear key gap support just above that level. If you'd like a tighter stop, you could consider a close below 89 as that would confirm a break beneath the 50 day SMA.
ROST (+0.86%) - earnings date is November 22nd. We just alerted ROST as it's typically one of the best apparel stocks in the market. It's been uptrending nicely for months and the recent weakness gives us a low risk opportunity to enter near the 50 day SMA. It's up slightly from our earlier alert. Here's the current chart:
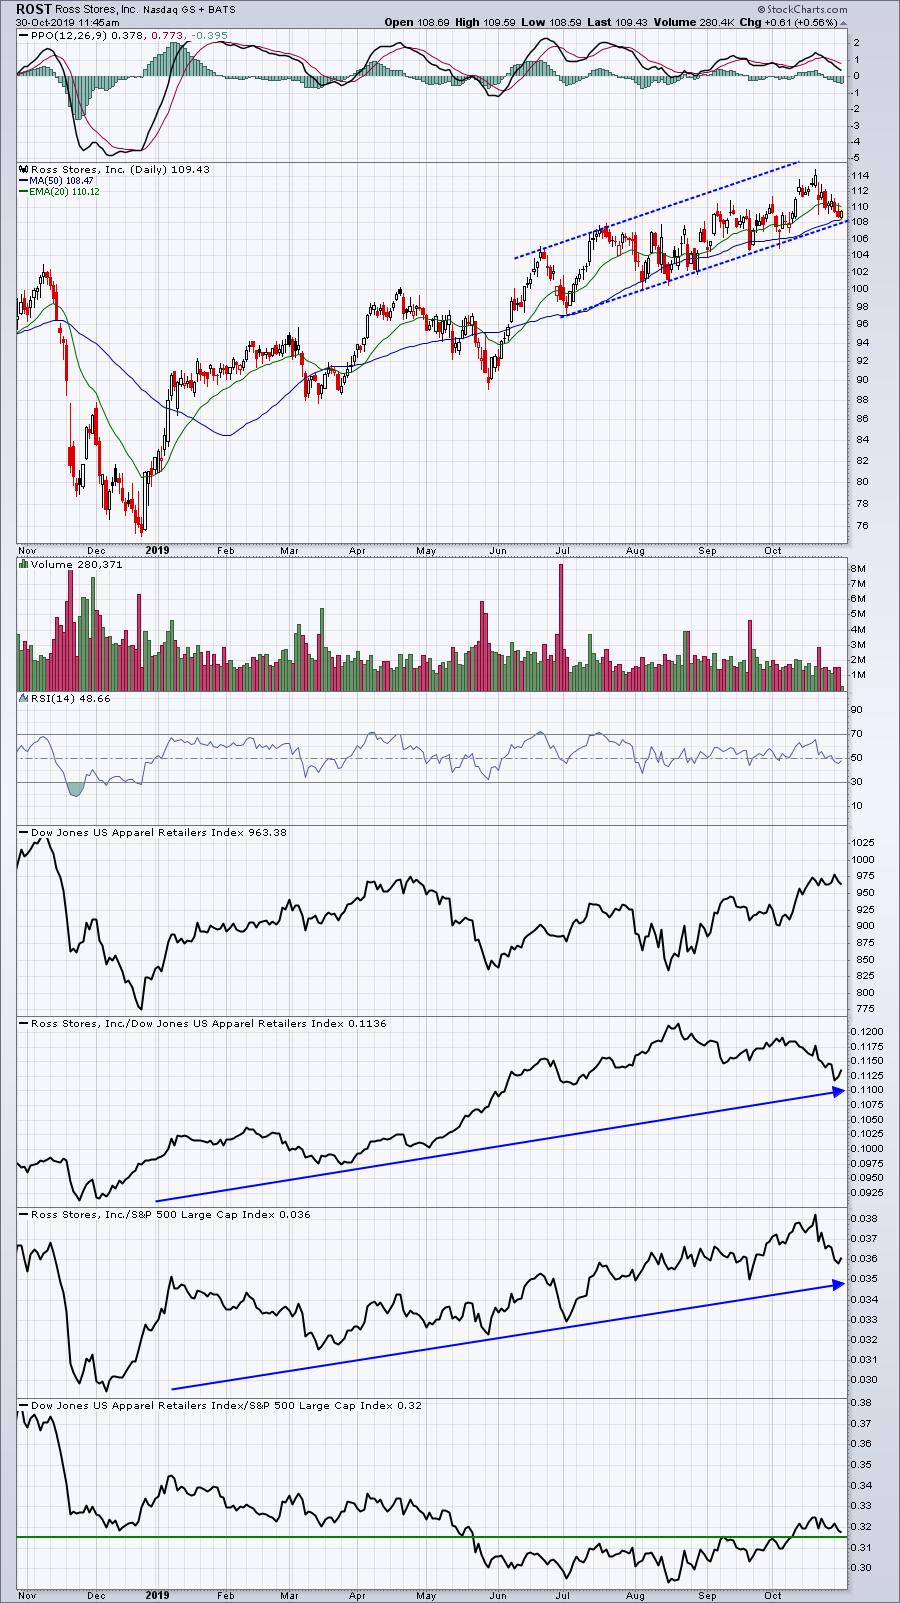
ROST is down roughly 5% over the past couple weeks, providing a solid reward to risk entry. We're going to keep a very tight stop in place on any close beneath 107.50. There is gap support and a couple of price lows down in the 104-105 area if you want to give it a bit more room.
Today's Movers
There are times when big moves to the downside are precursors to further downside action. But other times, they can be opportunities. Here are two big SCTR movers lower today that could be providing opportunities:
MCK:
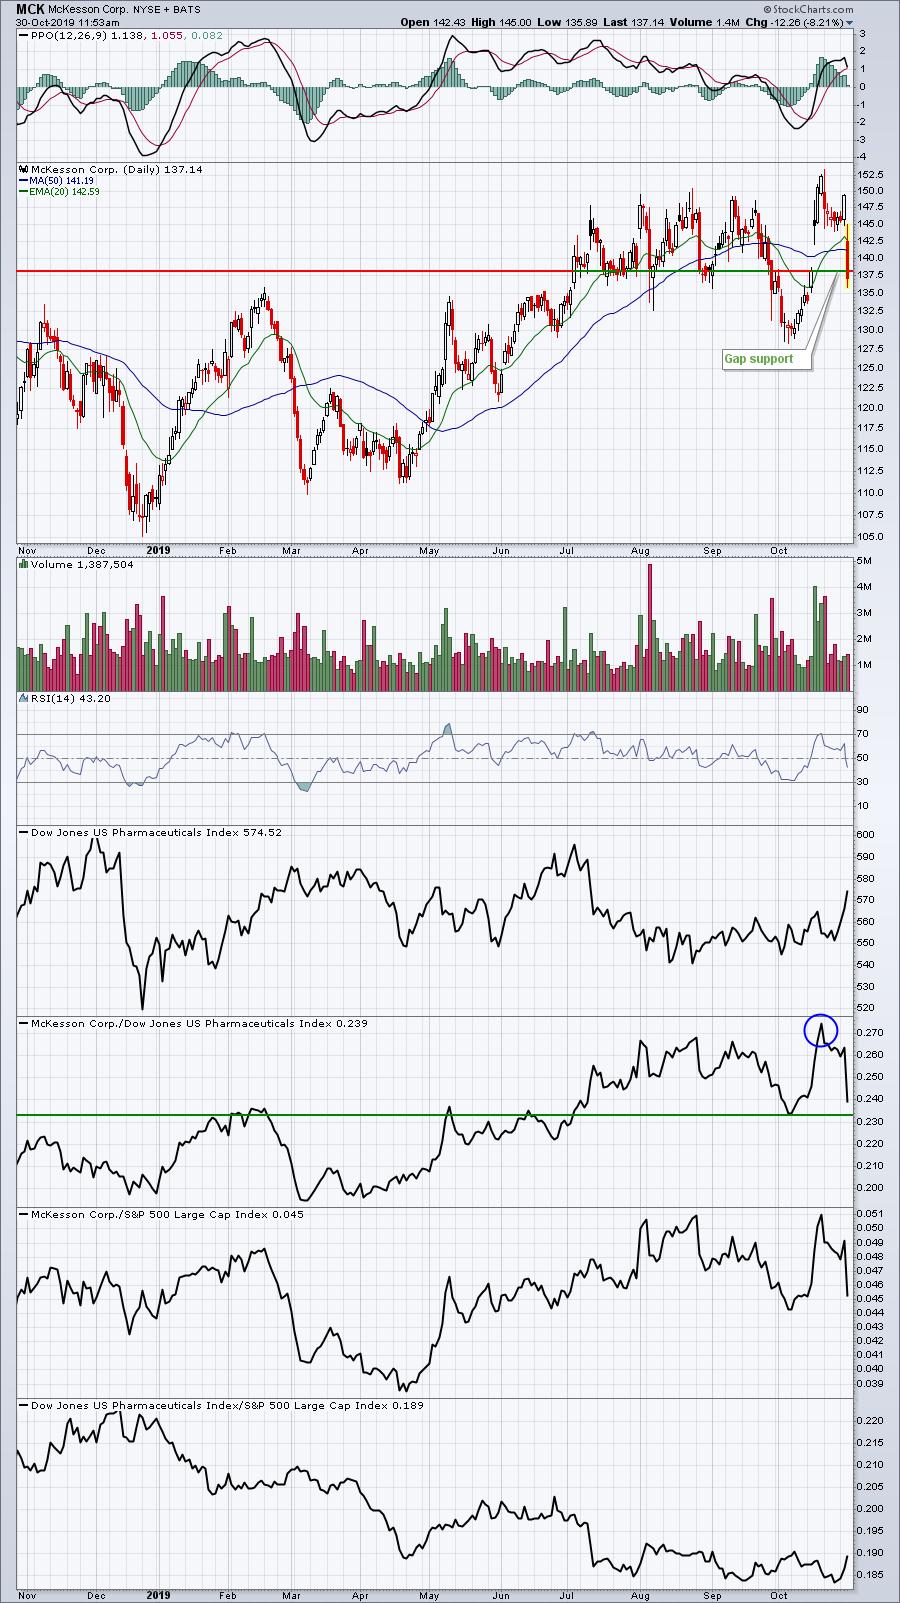
MCK gapped up with earnings recently on very heavy volume and broke out. Further, it was showing considerable strength vs. its pharma peers ($DJUSPR), hitting a new 52 week relative high. If MCK can hold gap support at today's close, it could be a significant bottom.
IQV:
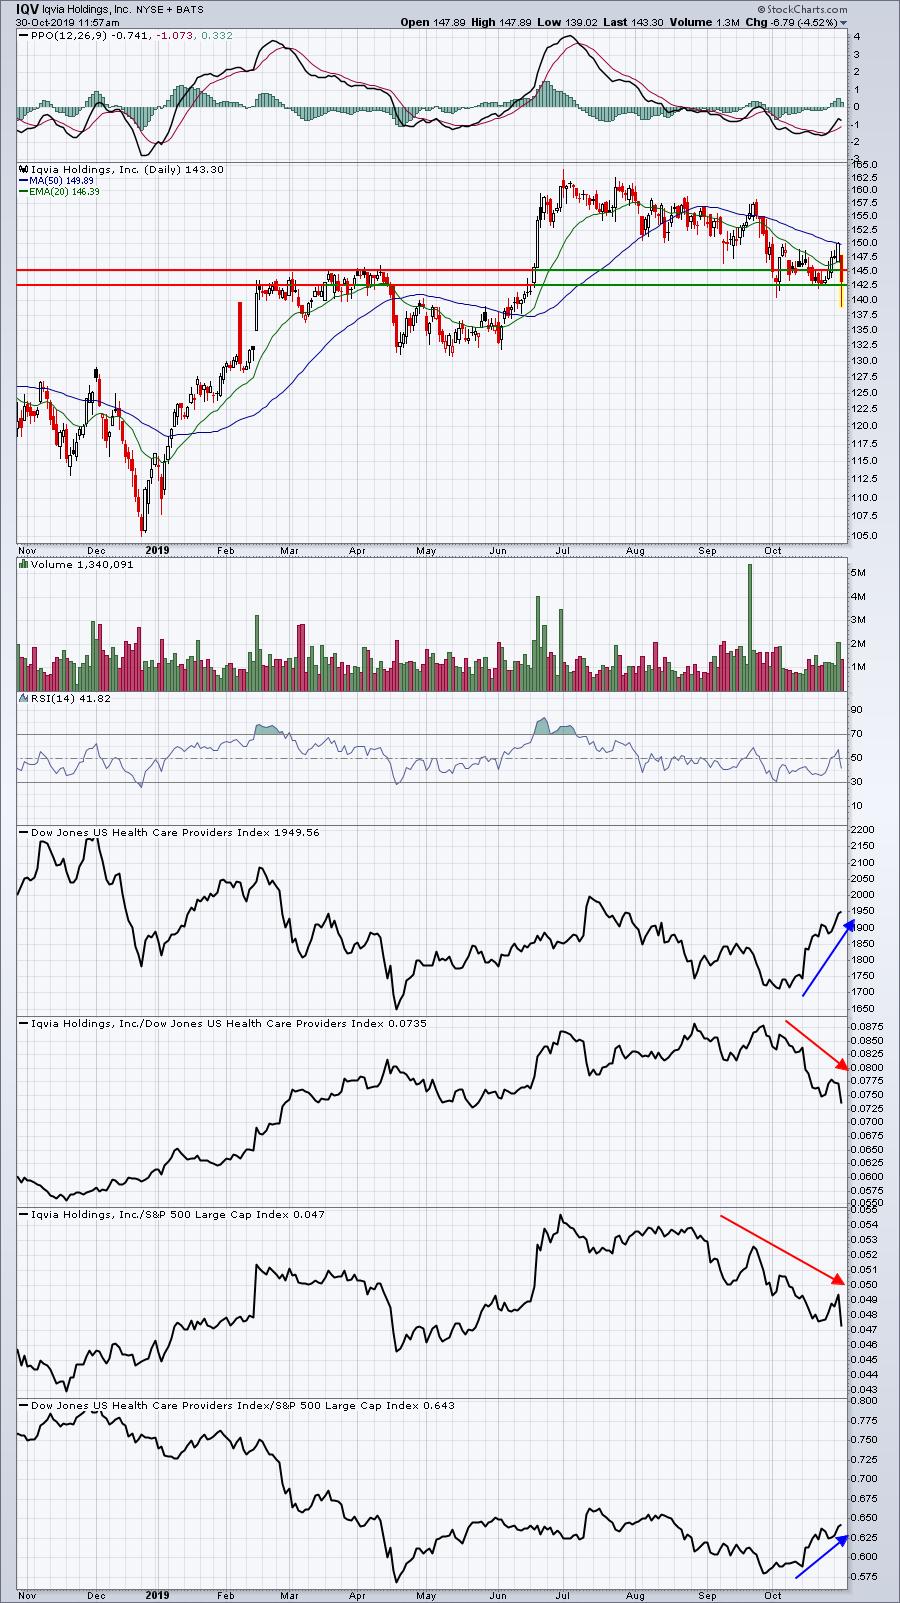
IQV will be very interesting for a couple reasons. First, IQV reports its earnings after the bell today. We're beginning to see relative strength in health care providers ($DJUSHP). IQV fell below recent support earlier on heavy volume. Was it an indication of further decline and a poor report? Or was it an opportunity to accumulate shares prior to a big report? We'll know later today. But if you don't think this happens, check out IPHI, a semiconductor ($DJUSSC), which was on the verge of breaking down yesterday and is soaring today on earnings.
Earnings Reports
Here are the key earnings reports for this week, featuring stocks with market caps of more than $10 billion. I also include a few select companies with market caps below $10 billion. Finally, any portfolio stocks that are reporting are highlighted in BOLD. The number of companies reporting will be significant over the next two weeks, so please make sure you check for earnings dates for any companies you own or are considering owning:
Wednesday, October 30:
AAPL, FB, GSK, SBUX, GE, SNE, CME, ADP, SO, VRTX, SPG, SU, EQIX, LHX, MET, MCO, CTSH, YUM, TEL, IQV, WMB, RSG, MSI, MCK, KLAC, S, ETR, BKR, RCL, APTV, AWK, HES, HCP, WDC, GRMN, MAA, MGM, TWLO, WCG, NLY, BSAC, LYFT, MAS, TAP, DRE, LNC, TS, REG, MLCO, CLR, NI, FRT, TYL. Others below $10 bil: OLED, ETSY, CREE, CRUS, TMHC, EVTC, CROX, ELY, HTLD, BOOT, DDD
Thursday, October 31:
RDS.A, SNY, AMT, BMY, MO, CELG, EL, CI, ICE, DD, EXC, MPC, BCE, KHC, TRI, PEG, SIRI, MPLX, MELI, FCAU, GPN, WLTW, PH, BLL, IDXX, ADM, AME, CTVA, CLX, MSCI, CHD, ANET, CDW, IP, TFX, XYL, LYV, MMP, PINS, FTNT, WAB, IT, SSNC, CPT, VICI, CVE, OTEX, W, WU, BIO. Others below $10 bil: DNKN, AYX, GNRC, SRCL, JCOM, YETI, X, FLWS, FNKO
Friday, November 1:
BRK.B, BABA, XOM, CVX, ABBV, HDB, D, CL, TRP, AIG, SRE, LYB, IMO, PBA, FTS, LNG, WPC, STX, CBOE. Others below $10 bil: FND, TDS
Economic Reports
October ADP employment report: 125,000 (actual) vs. 125,000 (estimate)
Q3 GDP (initial estimate): 1.9% (actual) vs. 1.7% (estimate)
FOMC policy statement to be released at 2:00pm EST
Happy trading!
Tom