
EB Daily Market Report - Tuesday, November 5, 2019
Executive Market Summary
- Crude oil prices ($WTIC) are higher again today, this time up 1% and above $57 per barrel
- Energy (XLE) led U.S. stocks earlier, but were flat at last check; consumer stocks are perking up and showing leadership
- Defensive sectors are under pressure with real estate (XLRE) leading to the downside
- The 10 year treasury yield ($TNX) is up 8 basis points to 1.87%, adding further selling pressure to a suddenly reeling home construction industry ($DJUSHB)
- Our three Active Trade Alerts are all higher on today's session
Market Outlook
Transports ($TRAN) are doing their part to set the U.S. stock market up for a major advance. I've shown this chart before, but it's important enough to highlight once again:
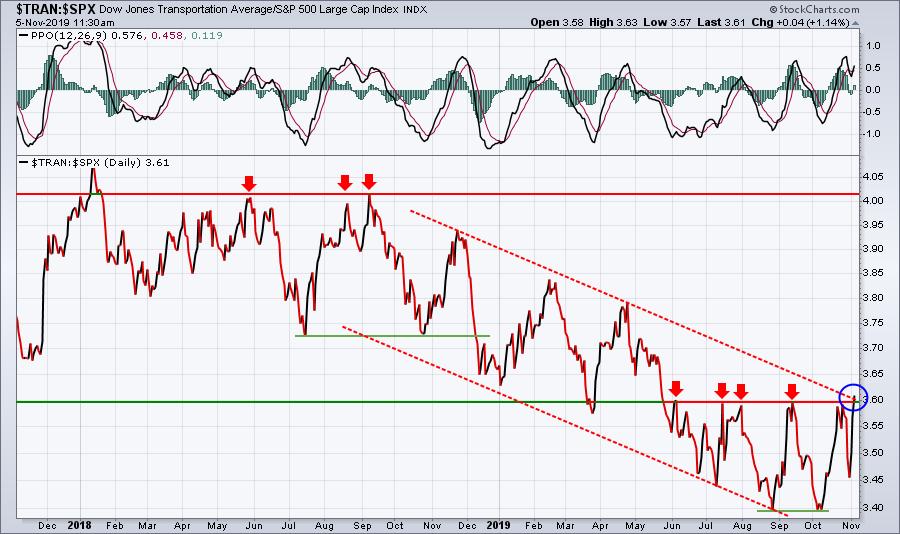
There is only one reason why transports would move higher and that's in anticipation of shipping more goods. The stock market is SCREAMING at us that our economy will continue to improve during the balance of 2019 and likely throughout 2020. The above chart was highlighted four weeks ago just as transports began to strengthen. I pointed out that a key relative resistance level needed to be cleared as the TRAN:SPX had been trending lower. That indicates underperformance by transports. Now we have a BIG opportunity. A sustained break above 3.60 on this relative chart would be extremely bullish for equities.
It's all coming together.
Sector/Industry Focus
Yesterday, I featured energy (XLE) and today I want to follow up on components of the XLE. Over the past week, energy has been the top performing sector. Its two leading industry groups have been oil equipment & services ($DJUSOI) and integrated oil & gas ($DJUSOL), which have gained 5.01% and 4.68%, respectively. Are these moves for real? I believe it's a bit too early to make that call, but there's no doubt that energy stocks are benefiting from the market's recent move away from growth and move to value. First, both of the industry groups need to clear the mid-September price highs before I'd grow more bullish. Second, relative downtrends remain firmly in place so that's honestly an even bigger deal. Here's a quick look at the relative weakness of both groups:
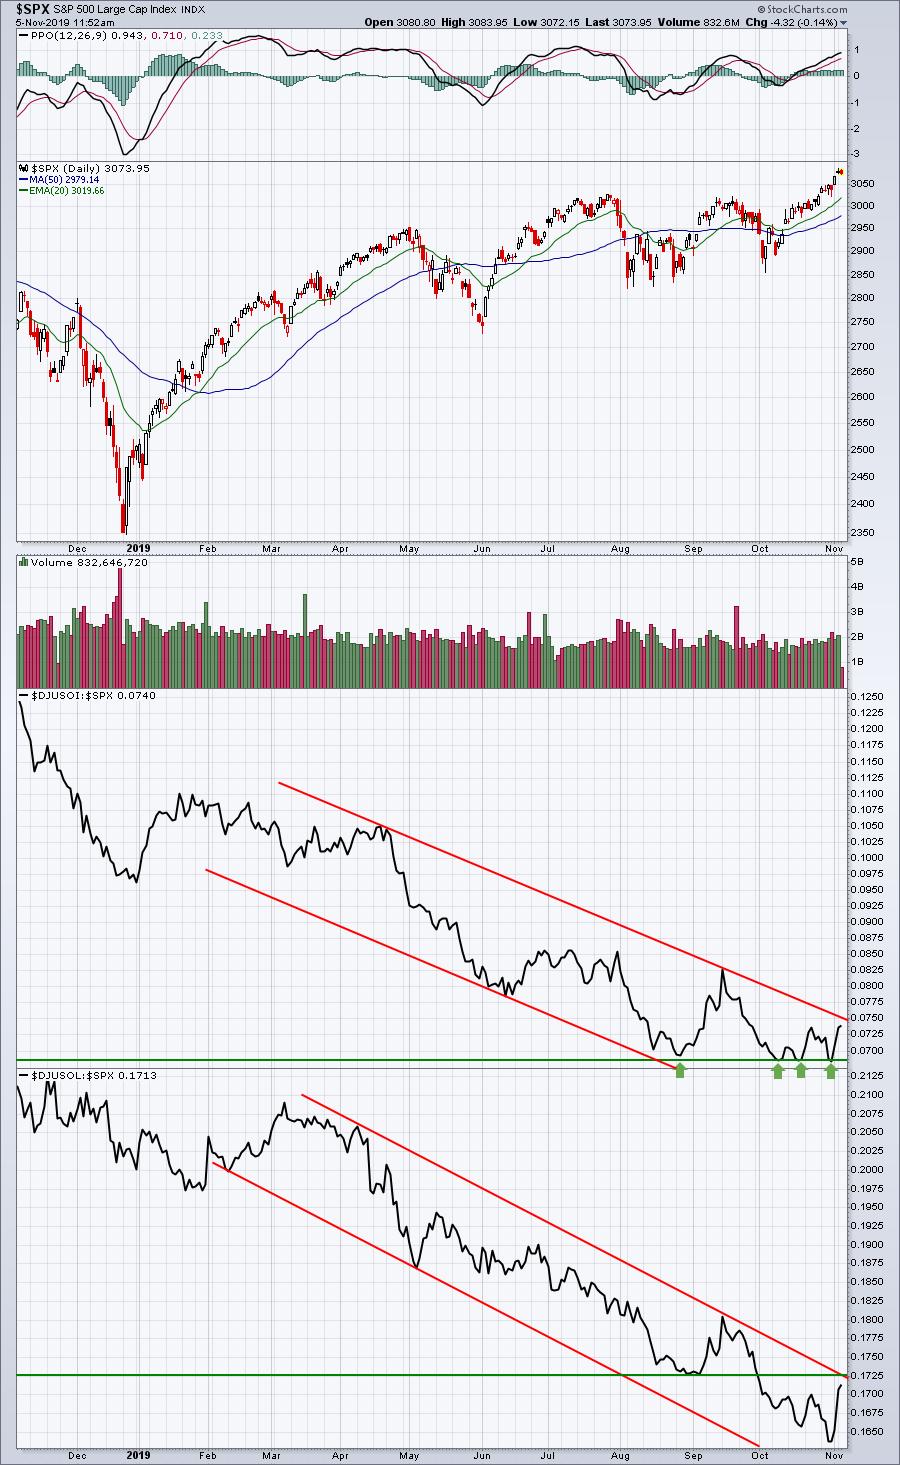
The relative down channels are quite obvious. We've seen short-term rallies before. I'd like to see a rally with a bit more staying power before I'd be convinced that a relative low has printed.
Strong Earnings ChartList (SECL)
I ran a scan against the SECL that included a PPO reading above 0.5 (suggests positive momentum) and a 20 day EMA test (short-term pullback). There were 4 results among the 157 companies on the SECL.
COST, ENTG, EW, HLX
Of these, I'd prefer COST which continues to consolidate in a cup with handle pattern and shows excellent relative strength:
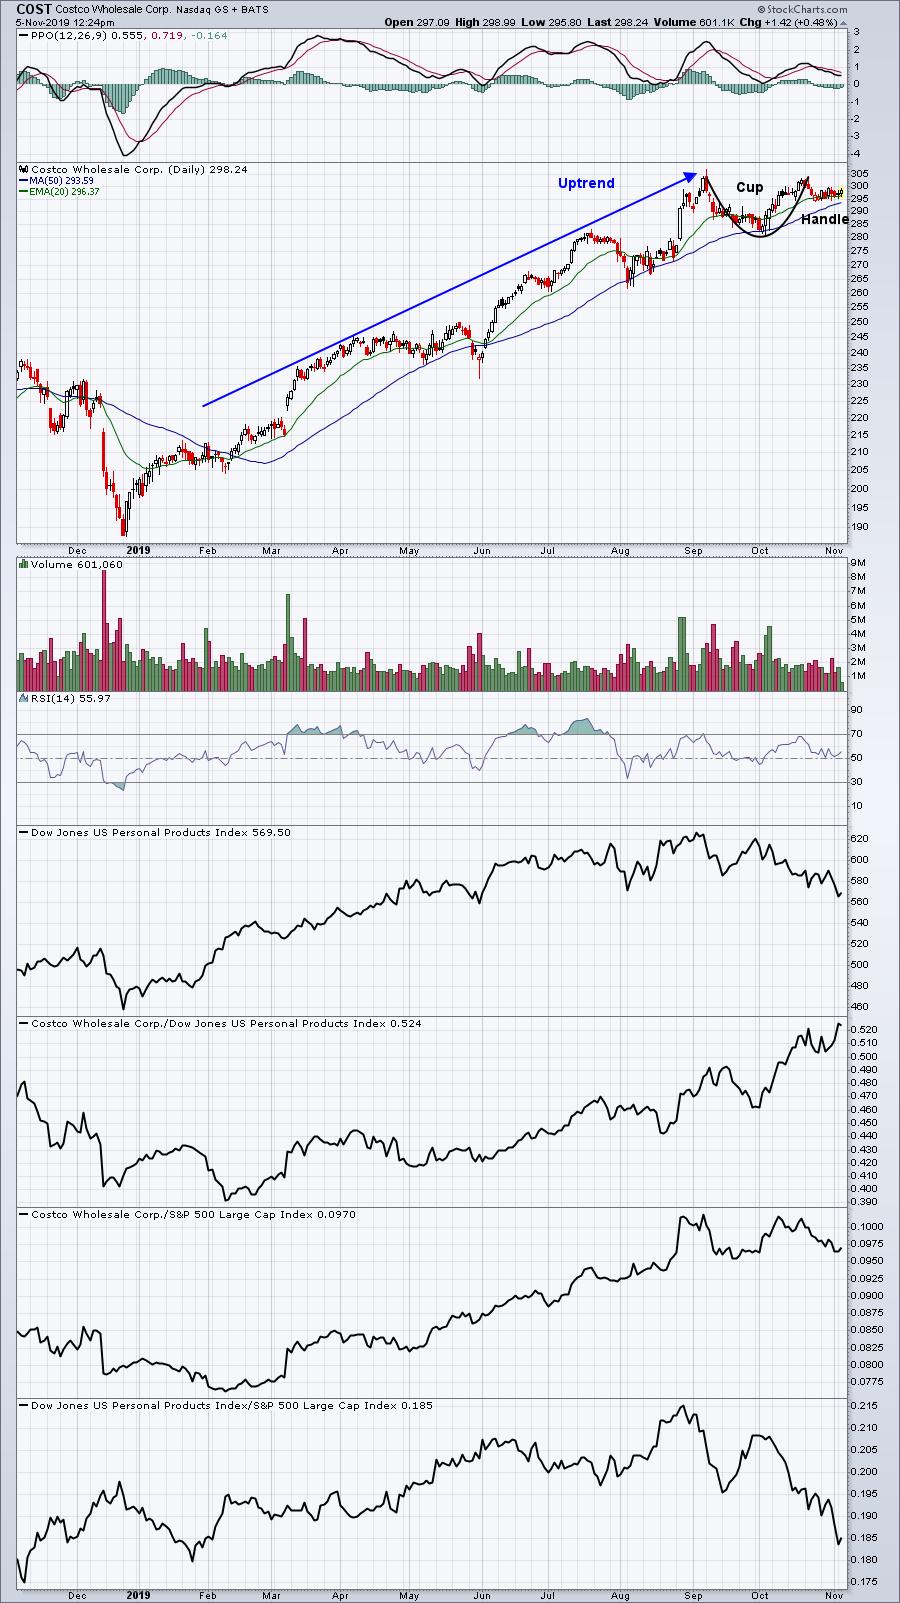
COST just set a fresh 52 week relative high vs. its industry peers and its overall chart pattern is quite bullish. A breakout above 305 with confirming volume would measure up close to 330. (Disclosure: I own COST shares)
Active Trade Alerts
Here are comments on our three current active alerts:
ZUMZ (+1.73%) - earnings date is December 5th. Volume remains light, but up beats the alternative. The recent back and forth action is taking place almost squarely on the 20 day EMA, currently at 31.97.
NKE (+0.28%) - recently reported earnings so the next earnings date won't be for another couple months. We changed our stop yesterday to any INTRADAY move below last Thursday's low of 88.94. So if you see an intraday print of 88.93, we're exiting and taking no chance of a further drop to gap support at 87.18 from September 24th. NKE has dropped to a 3 month relative low vs. the S&P 500. When I see relative strength deteriorate like that, I take precautionary measures. If we get a bounce to the 20 day EMA and relative strength doesn't improve, we may remove NKE closer to break even. I'll keep you updated.
ROST (+0.35%) - earnings date is November 22nd. The recent trend back to the upside continues today. Technically, ROST remains sound.
Today's Movers
I ran the same scan against the S&P 500 that I ran against the SECL above. It returned seven stocks as follows:
ATVI, BSX, COST, EW, LLY, LOW, SEE.
My favorite on this list would be ATVI (EW is a portfolio stock that remains very strong) because of its ascending triangle and improving relative strength vs. internet peers ($DJUSNS):
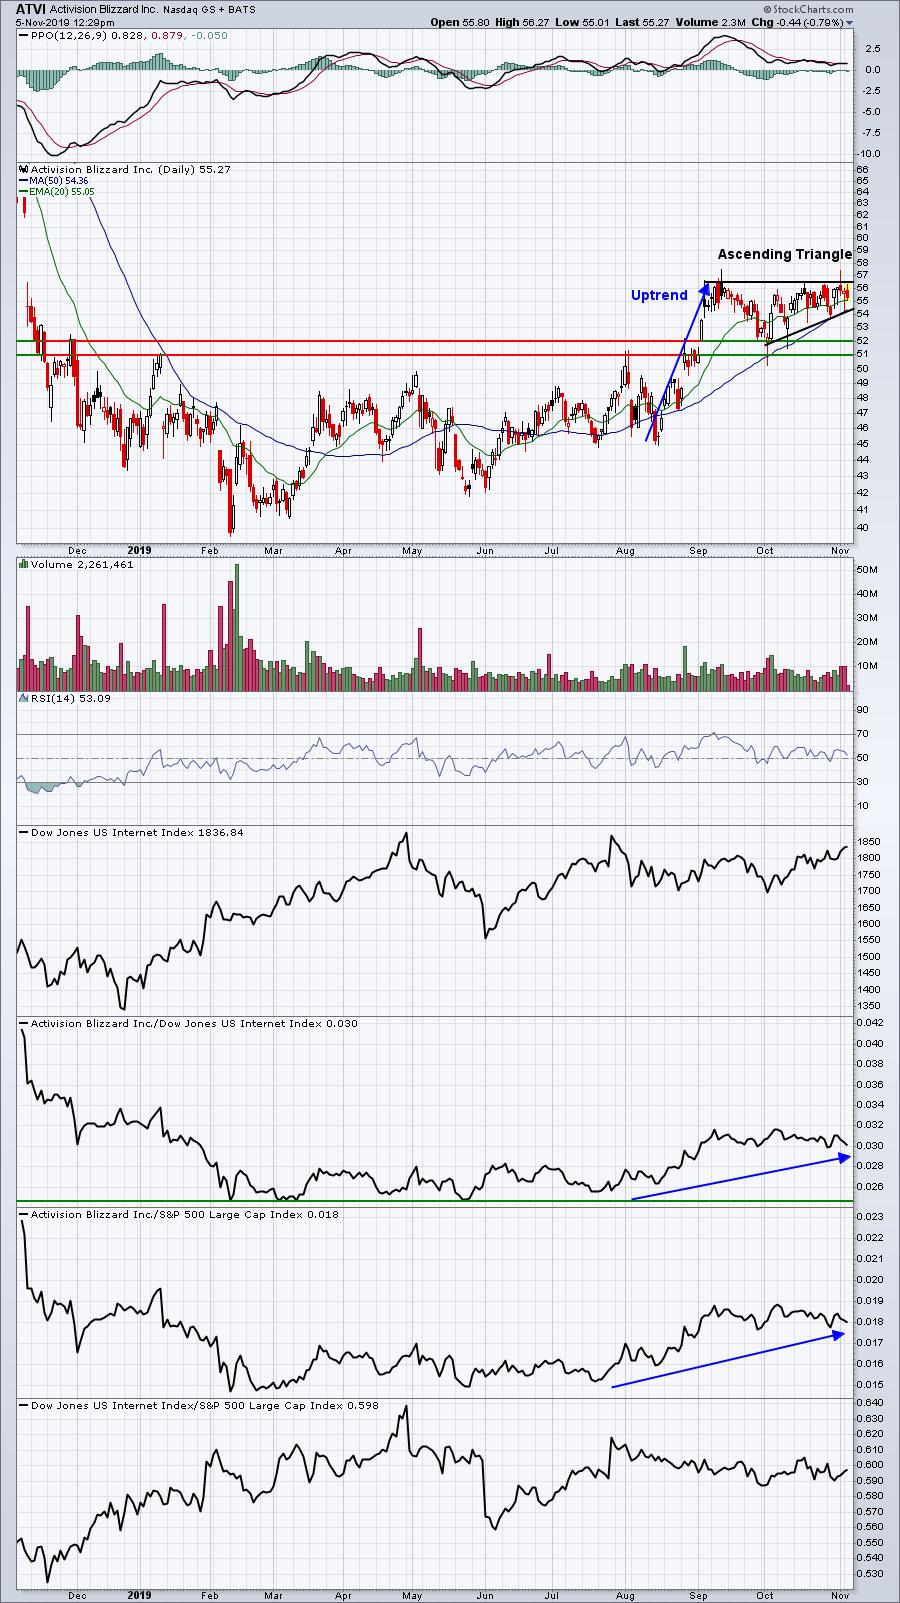
If you see volume increase and ATVI is able to close above 56.50, the measurement would be to 63-64. The blue directional lines above illustrate ATVI's improving relative strength over the past three months.
Earnings Reports
Here are the key earnings reports for this week, featuring stocks with market caps of more than $10 billion. I also include a few select companies with market caps below $10 billion. Finally, any portfolio stocks that are reporting are highlighted in BOLD. Please make sure you check for earnings dates for any companies you own or are considering owning:
Tuesday, November 5:
FIS, BDX, AGN, EMR, REGN, NEM, ZBH, ES, PPL, MCHP, VIV, MTCH, ATUS, FANG, VST, PAA, EXPD, ARNC, HST, Y. Others less than $10 bil: PODD, AVLR, RPD, KTOS, BMCH
Wednesday, November 6:
QCOM, CVS, FISV, EOG, HUM, MFC, BIDU, ET, GOLD, WEC, SLF, SQ, FLT, GIB, EXPE, FOXA, IAC, VMC, ANSS, LBTYA, CBRE, ROKU, DISH, EVRG, CNHI, BR, CTL, DXCM, ATO, WYNN, HOLX, IQ, CVNA, GDDY, AES, EQH. Others less than $10 bil: MRO, TRIP, SEDG, NTRA, AYR, FIT, CECO, ELF
Thursday, November 7:
DIS, BKNG, ZTS, APD, ATVI, KDP, JCI, MNST, CNQ, ABC, MTD, BAP, AZUL, MT, CNP, DISCA, CAH, SYMC, BIP, TTWO, BCH, XRAY, NCLH, PNW, NRG. Others less than $10 bil: TTD, DBX, RL, ZG, PLNT, SVMK, STMP, SYNA
Friday, November 8:
ENB, DUK, HMC, AEE, MGA. Others less than $10 bil: None
Economic Reports
October PMI services index: 50.6 (actual) vs. 51.0 (estimate)
October ISM non-manufacturing index: 54.7 (actual) vs. 53.5 (estimate)
Happy trading!
Tom