
EB Daily Market Report - Thursday, November 14, 2019
Executive Market Summary
- Futures were down again this morning, not at all disappointing given the negative divergences that had previously printed
- Initial jobless claims hit a 5 month high, well above expectations
- Inflation at the producer level jumped a bit more than expected
- Cisco Systems (CSCO) beat estimates, but provided a weak outlook; CSCO was down more than 7%, breaking below key support at 46
- The 10 year treasury yield ($TNX) retreats 6 basis points to 1.81% on weak economic news
- Our two Active Trade Alerts are higher today as retail stocks (XRT) continue yesterday's bounce off 20 day EMA support
Market Outlook
It's generally a good idea to follow the price of crude oil ($WTIC) as it provides us a decent picture of the global economy. Crude oil moves up and down on simple supply and demand. If the global economy is strengthening, we should see that reflected in more demand for crude oil. Of course, there is the supply issue that must be considered as well. Global demand can be accelerating, but we may still not move higher in crude prices as oil-producing countries can flood the market with supply. Still, watching crude oil is still worth the time:
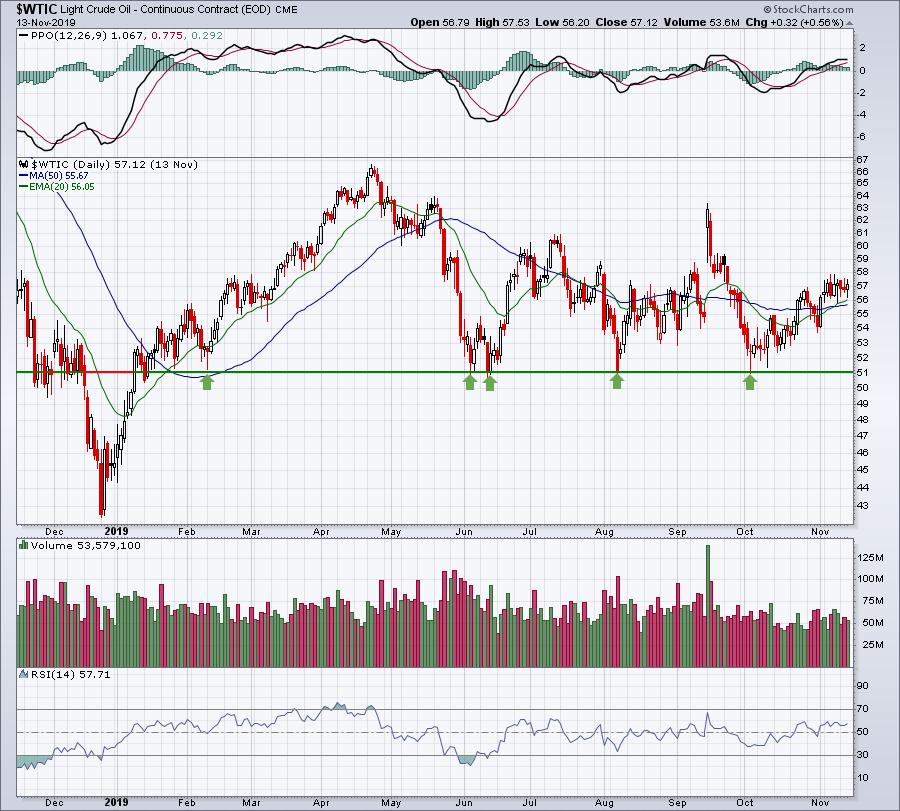
The big rally in global equities really began in early October and you can see from the above that crude oil prices have been rallying since that time as well.
Sector/Industry Focus
When I reviewed the best performing industry groups of 2019, renewable energy ($DWCREE) surprisingly remained the leader, although the gap between the DWCREE and others has definitely narrowed. It's difficult to be bullish on the group, however, until it can climb back above its 20 day EMA:
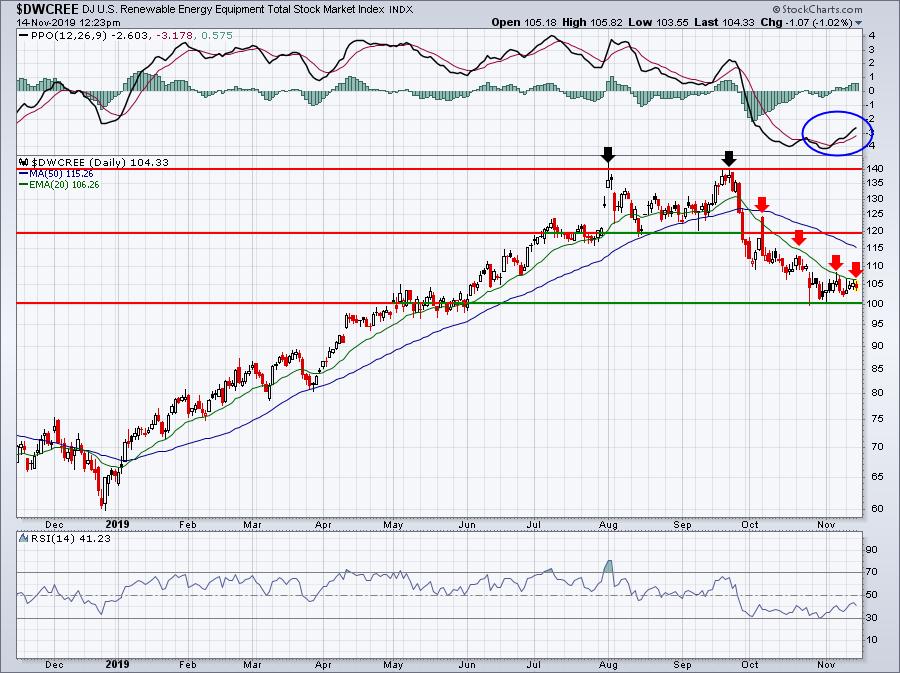
There was a double top that confirmed on the breakdown beneath 120 in late-September. Since that time, the DWCREE has not closed above its 20 day EMA, the first necessary ingredient to re-establish an uptrend. There was a 20 point measurement on the breakdown beneath 120, which would have signaled an initial downside target of 100. That has been reached and selling momentum (PPO), though weakening, still is negative. If the DWCREE attempts another breakdown and fails to do so, an important bottom could be set as a positive divergence (lower price, higher PPO) would very likely emerge.
It may be premature to jump into renewable energy stocks right now, but I wouldn't be surprised at all if the group regains strength into year end.
Strong Earnings ChartList (SECL)
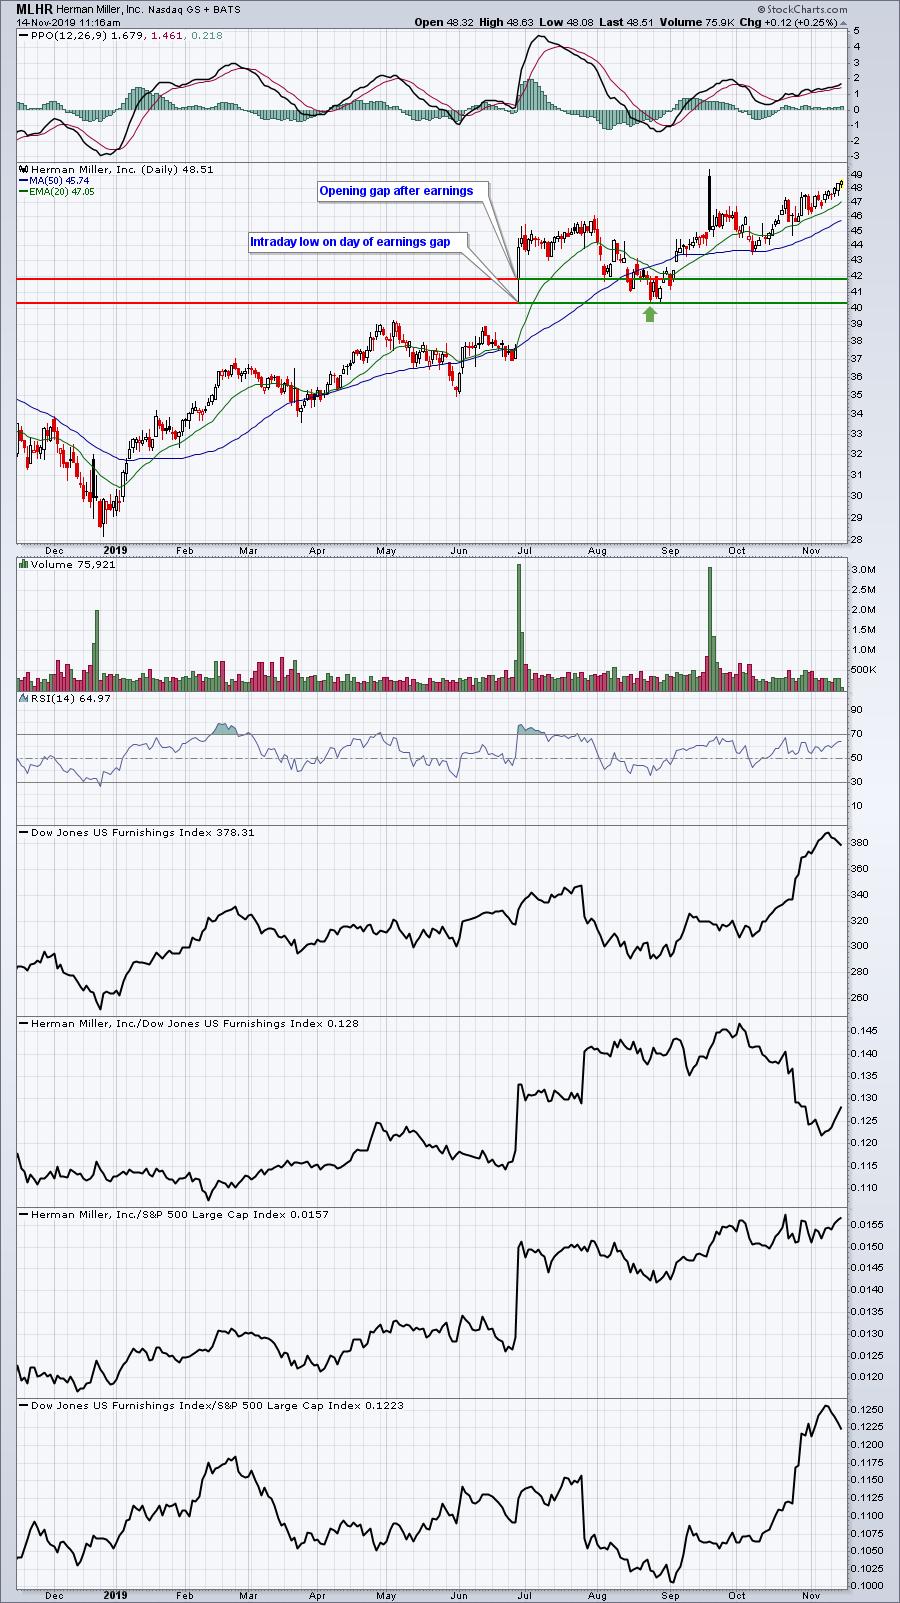
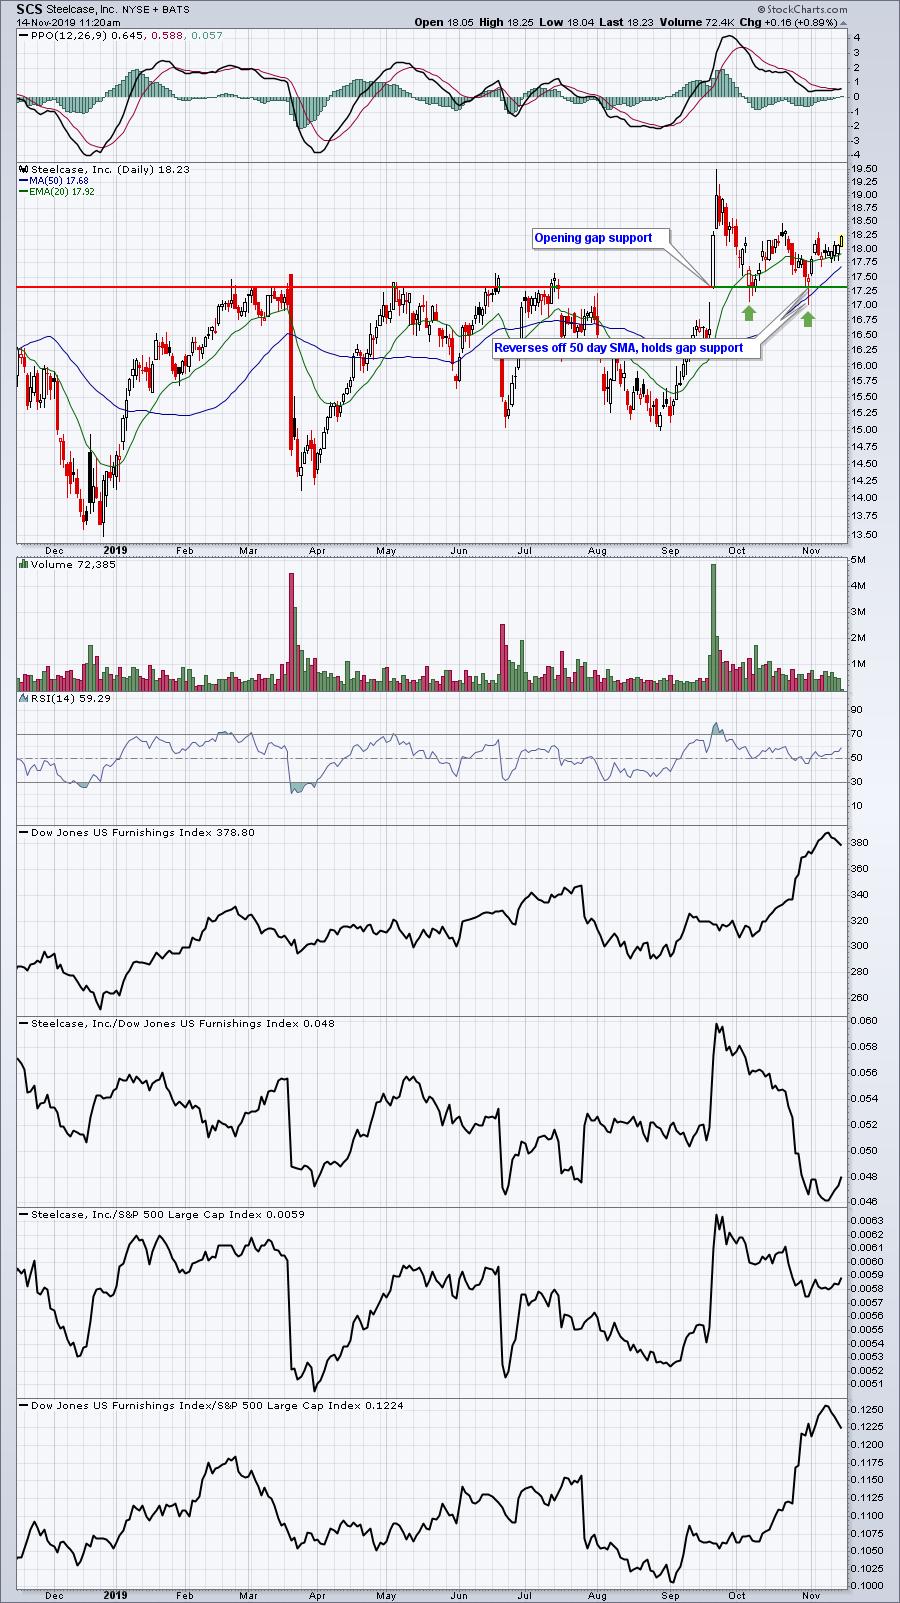
My absolute favorite trade is one where I can buy a stock that's on my SECL, gapped higher on extremely heavy volume, was followed by further buying, then pulls back to test that initial gap support level or its intraday low the day of the gap. If it also simultaneously tests a trendline or key moving average, all the better. Here are a couple examples:
MLHR:
SCS:
KSU:
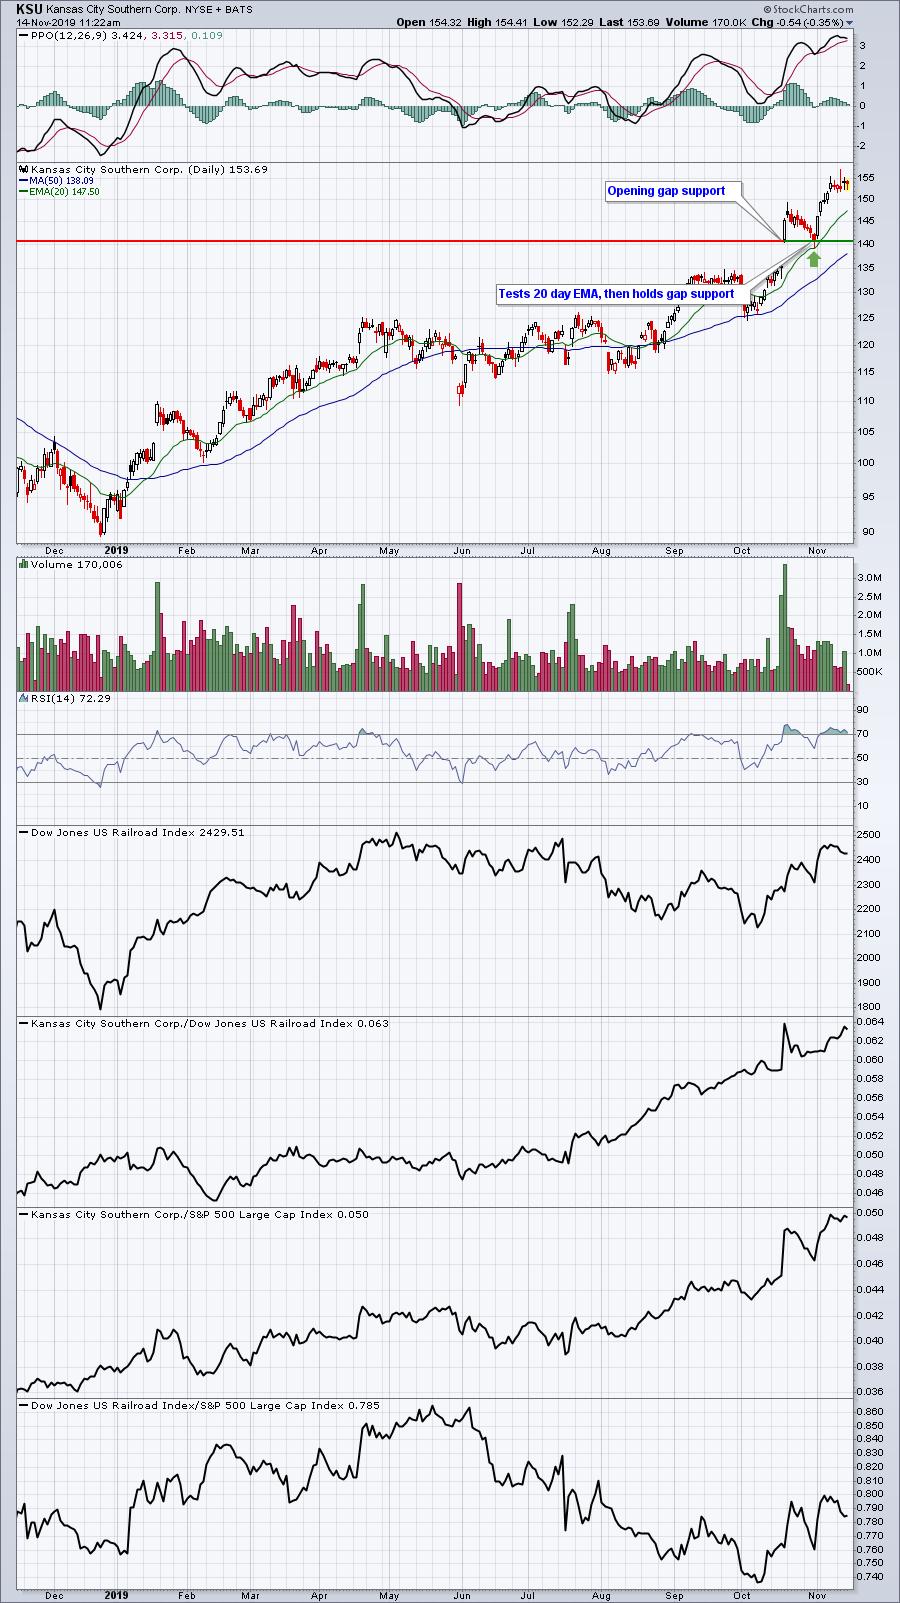
Hopefully, the above charts give you a better sense of what I look for. Keep in mind that intraday lows beneath gap support can be dangerous because you don't know that there'll be a reversal until you see it. However, once the reversal is in place, you can quantify your downside risk as that intraday low.
Active Trade Alerts
Here are comments on our two current active alerts:
ZUMZ (+0.79%) - earnings date is December 5th. ZUMZ is rebounding off of key price support near 30. Volume is light, so seeing a pickup there to accompany a move back above its 20 day EMA and 50 day SMA would be very encouraging.
ROST (+0.63%) - earnings date is November 22nd. ROST is continuing to push higher today after Wednesday's reversal and kick save at the rising 20 day EMA. We are raising our stop to any CLOSE beneath the 20 day EMA. Earnings are now one week away, so we can't let ROST get away from us to the downside as we won't have any time to recover.
Today's Movers
For those of you who like to try to find bottoms, I have a few stocks for you today. Please understand first and foremost that trying to find bottoms is not a favorite trading strategy of mine. I let others find bottoms and I try to follow momentum. But.....if I were to try to find bottoms, I'd do it with stocks that are testing long-term support levels.
GPS:
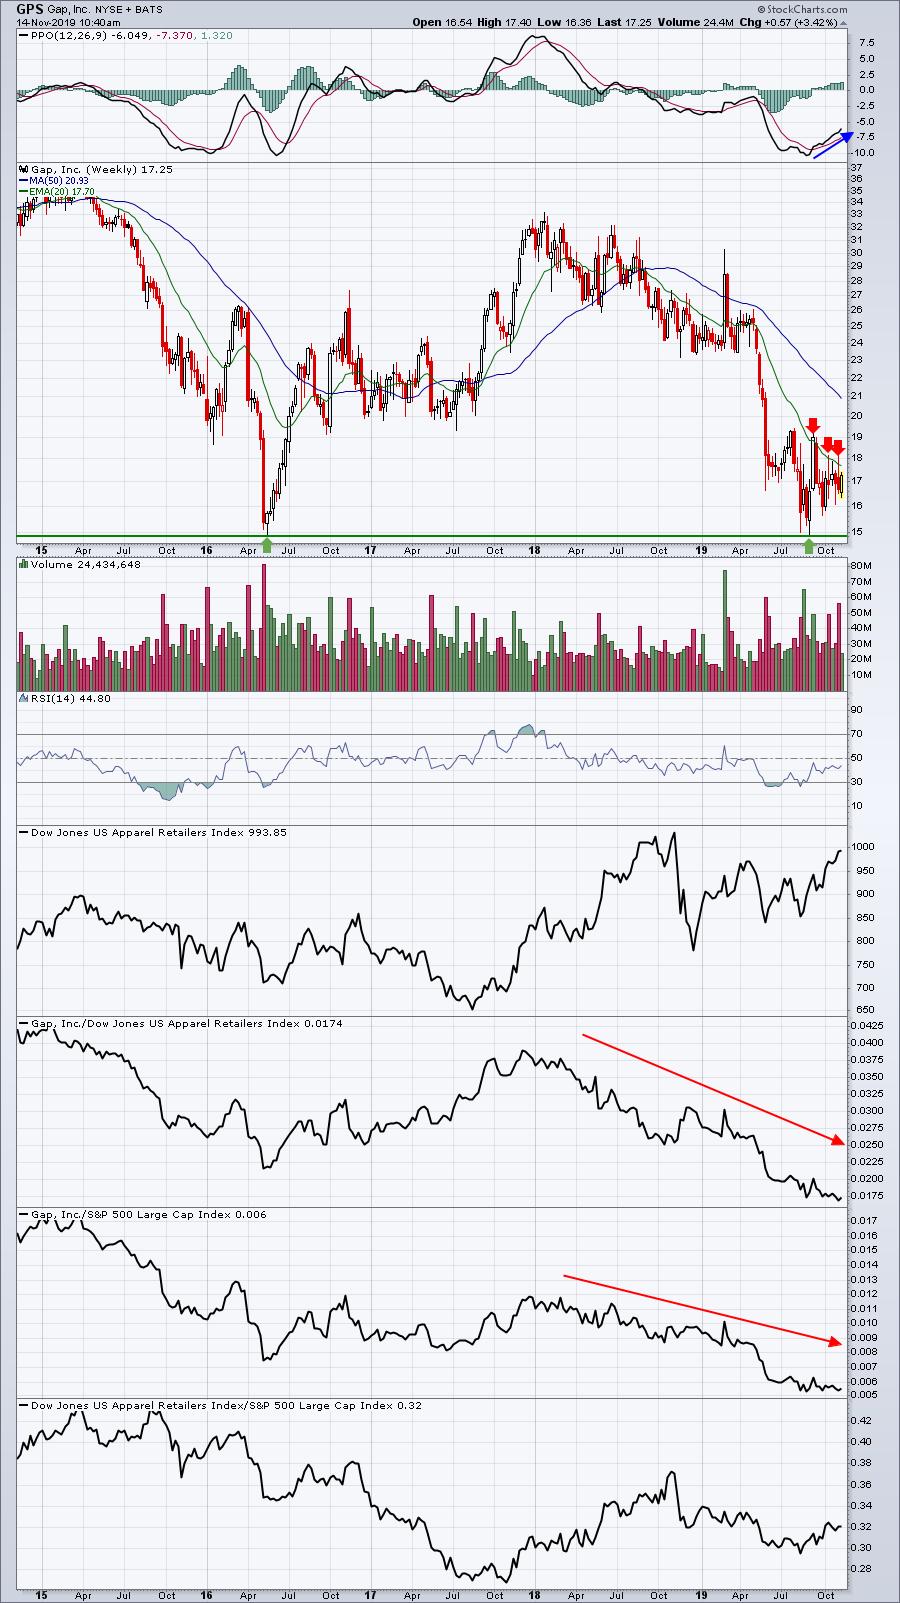
That relative strength line has been downtrending for a long time, which keeps me from even considering it. But for those seeking value and a bottom, the successful test (thus far) of the 2016 low could be a signal for an entry.
W:
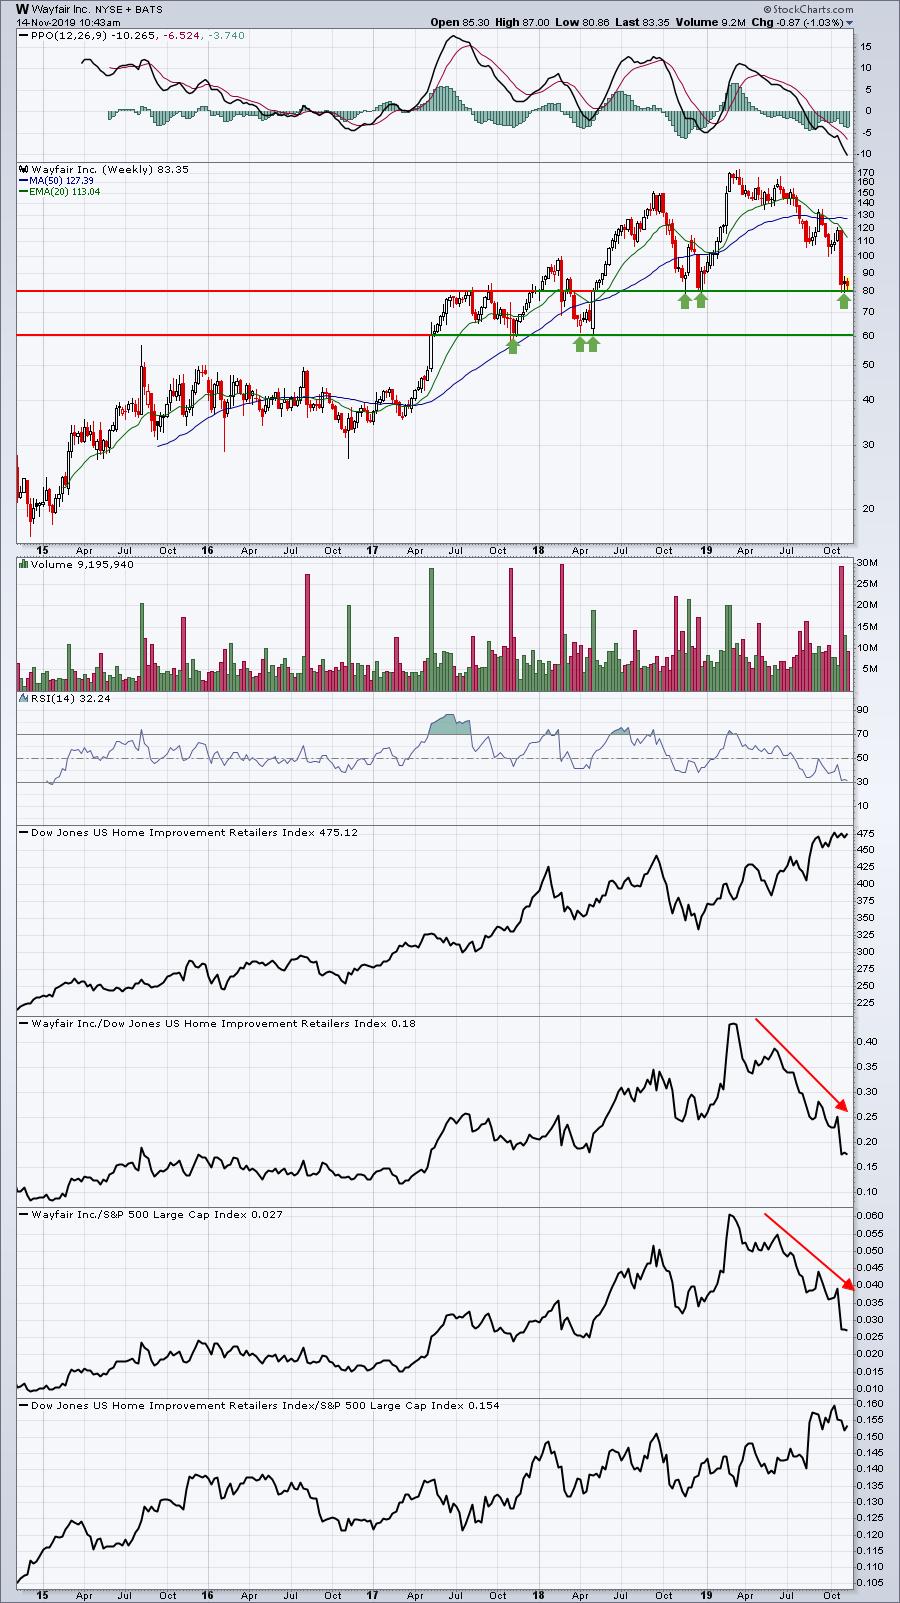
It's been a steep fall on both an absolute and relative basis since topping in Q1 2019, but W was a leader in the home improvement space ($DJUSHI). The definition of an uptrend is a series of higher highs and higher lows. W remains in an uptrend so long as the lows from late-2018 hold. The same scenario played out in 2017/2018 with the prior lows ultimately holding. If you go long W here, you're banking on that price support near 80 holding.
SFM:
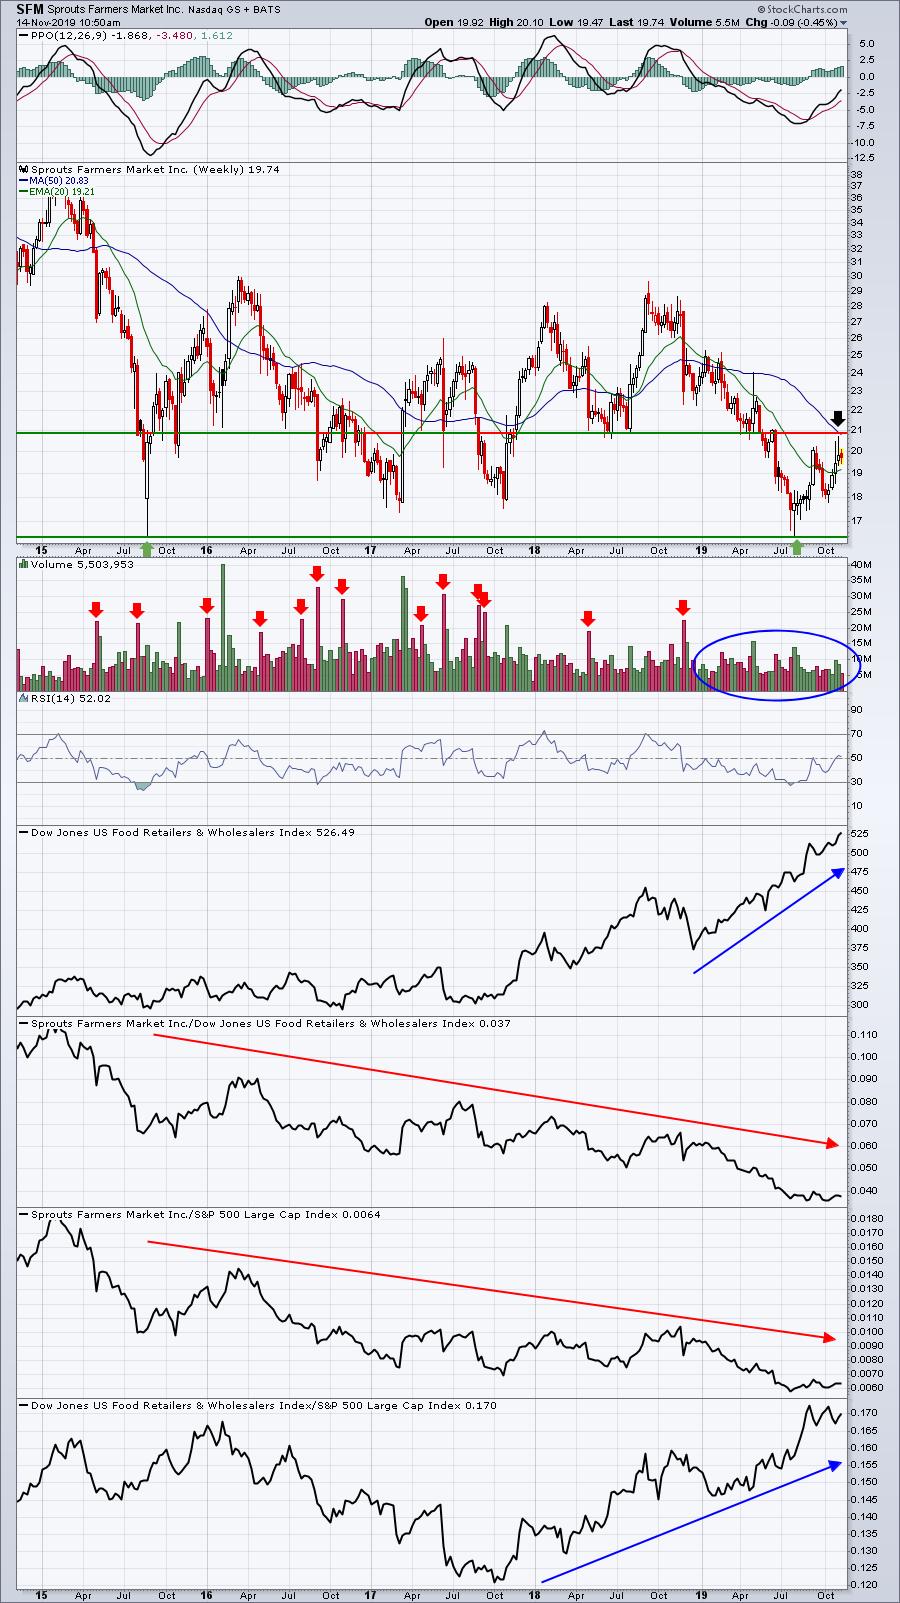
SFM has failed to move higher despite being part of a very strong industry group. It continues to trade near key price support in the 16-20 range. There does appear to be good news though. Check out all of those red arrows. They mark big volume accompanying price moves lower, a clear sign of distribution. We haven't seen any of that in 2019, so are the sellers finally gone? Is accumulation taking place? Possibly. A big volume break above 21 (black arrow) would begin to support the theory of a major bottom in place.
Earnings Reports
Here are the key earnings reports for this week, featuring stocks with market caps of more than $5 billion. I also include a few select companies with market caps below $5 billion. Finally, any portfolio stocks that are reporting are highlighted in BOLD. Please make sure you check for earnings dates for any companies you own or are considering owning:
Thursday, November 14:
WMT, NVDA, AMAT, WB, WPM, NICE, VIAB, CGC, DLB, WIX, BAK, GDS. Others less than $5 bil: HP, ACB, SINA, KLIC
Friday, November 15:
JD
Economic Reports
Initial jobless claims released at 8:30am EST: 225,000 (actual) vs. 215,000 (estimate)
October PPI released at 8:30am EST: +0.4% (actual) vs. +0.3% (estimate)
October Core PPI released at 8:30am EST: +0.3% (actual) vs. +0.2% (estimate)
Happy trading!
Tom