
EB Daily Market Report - Friday, November 15, 2019
Executive Market Summary
- Wall Street is setting more records today as the Dow Jones approaches 28,000 for the first time
- The S&P 500 has easily moved past 3100 as it attempts to close above that level for the first time
- Two key semiconductor companies reported quarterly earnings after the bell yesterday - AMAT and NVDA; the former blew past estimates and is the best performing stock in the S&P 500 today
- As you might expect, semiconductors ($DJUSSC) are one of the best industries today
- Healthcare (XLV) is the leading sector, followed by energy (XLE)
- Positive trade discussions aided U.S. equities from today's opening bell
- Our two Active Trade Alerts are mixed today after the October retail sales report was released
Market Outlook
Let's revisit that S&P 500 60 minute chart. We saw a period of sideways consolidation to relieve us of the negative divergence. Now we're breaking out again with the 60 minute PPO rising, which is bullish:
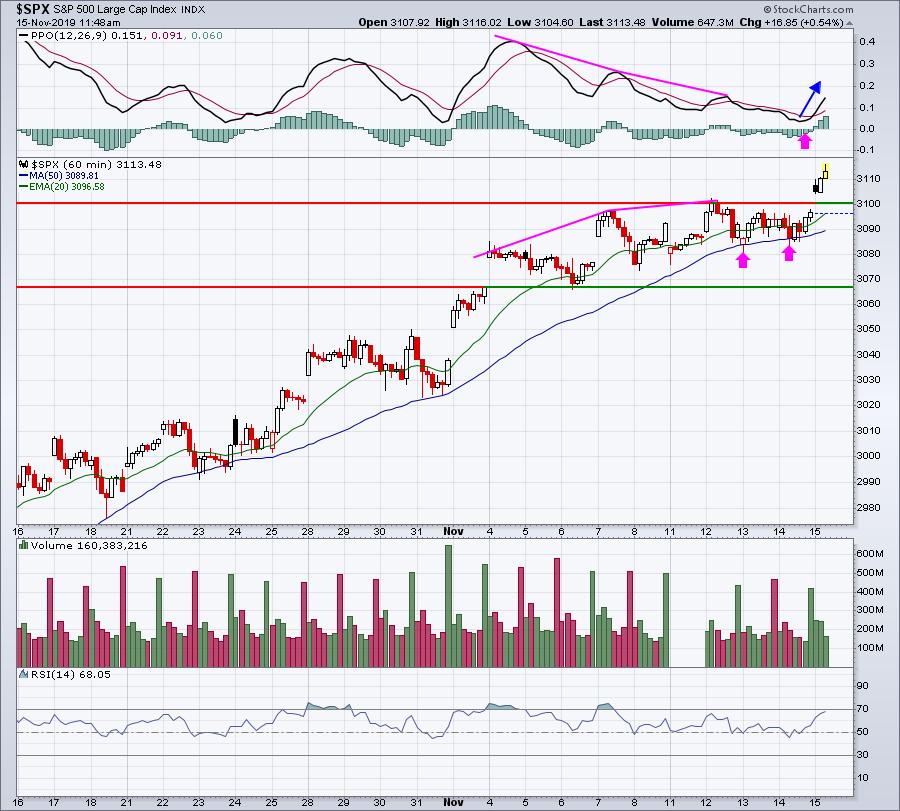
The pink arrows show that we did, in fact, come down to test the 50 day SMA, one of the tests I look for after a short-term 60 minute negative divergence prints. We never saw a PPO centerline test, but that momentum indicator has now taken off again and looks quite bullish.
I expected a very mild pullback, perhaps 1.00%-1.50%, and we saw just a little less than that. We will have deeper selling before year end, but for now the skies ahead are a bullish shade of blue.
Sector/Industry Focus
We have seen a huge run in semiconductors ($DJUSSC) so congrats if you've owned them in recent weeks and months. The group had more good news overnight when Applied Materials (AMAT) knocked its earnings report out of the park. NVIDIA Corp (NVDA), however, isn't seeing that same positive reaction this morning and the DJUSSC, as a whole, might just be beginning to lose a little momentum based on its daily PPO rolling over:
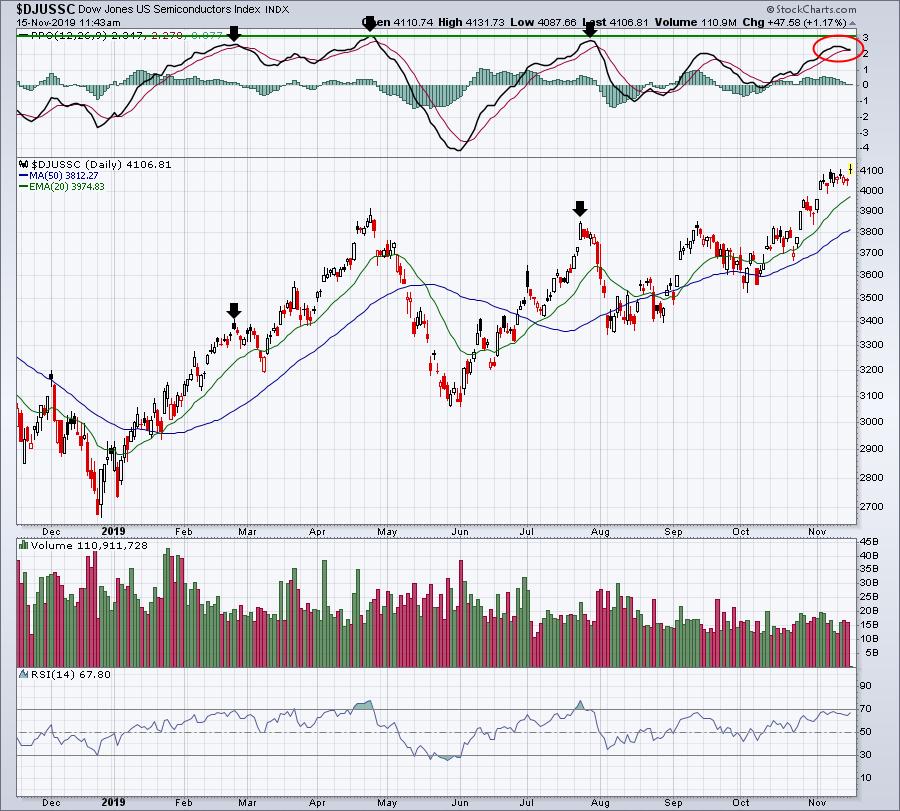
The group is up more than 1% today while the PPO appears to be rolling over. That certainly doesn't guarantee us that we're heading lower, but it does at least raise a potential short-term red flag. The PPO could turn back up one more time as it attempts to reach the 3 level, where major intermediate-term tops have formed.
Strong Earnings ChartList (SECL)
Today, I reviewed our Strong Earnings ChartList and viewed the list as "Correlation" vs. the S&P 500 over the past 50 days. I then reversed the order to show the stocks on our SECL that have been negatively (or inversely) correlated to the S&P 500. It's no big surprise, but many of the beaten-down software names show up on this list as they've struggled to participate in the recent S&P 500 climb into record territory. Here are the top 15 on the list:
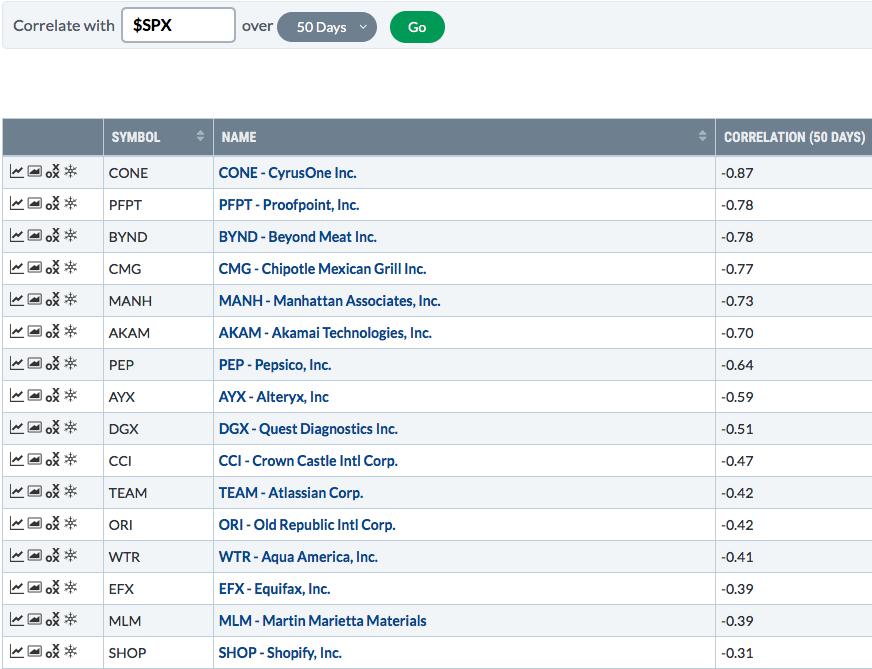
I just wanted to point out that there are different ways to sort ChartLists on StockCharts. Most times I sort by % change or SCTR, but there are other options and S&P 500 correlation can be a useful option for anyone trying to mix it up a little bit - in other words owning a varied group of stocks, some that are more positively correlated with the S&P 500 and others that aren't.
Active Trade Alerts
Here are comments on our two current active alerts:
ZUMZ (-0.61%) - earnings date is December 5th. ZUMZ continues to test key price support near 30.
ROST (+0.30%) - earnings date is November 22nd. ROST gapped higher this morning with a decent retail sales report, sold off for a bit and is now trying to rally back again.
Today's Movers
Just wanted to provide a quick update on Applied Materials (AMAT), the latest semiconductor stock to blow past Wall Street consensus estimates:
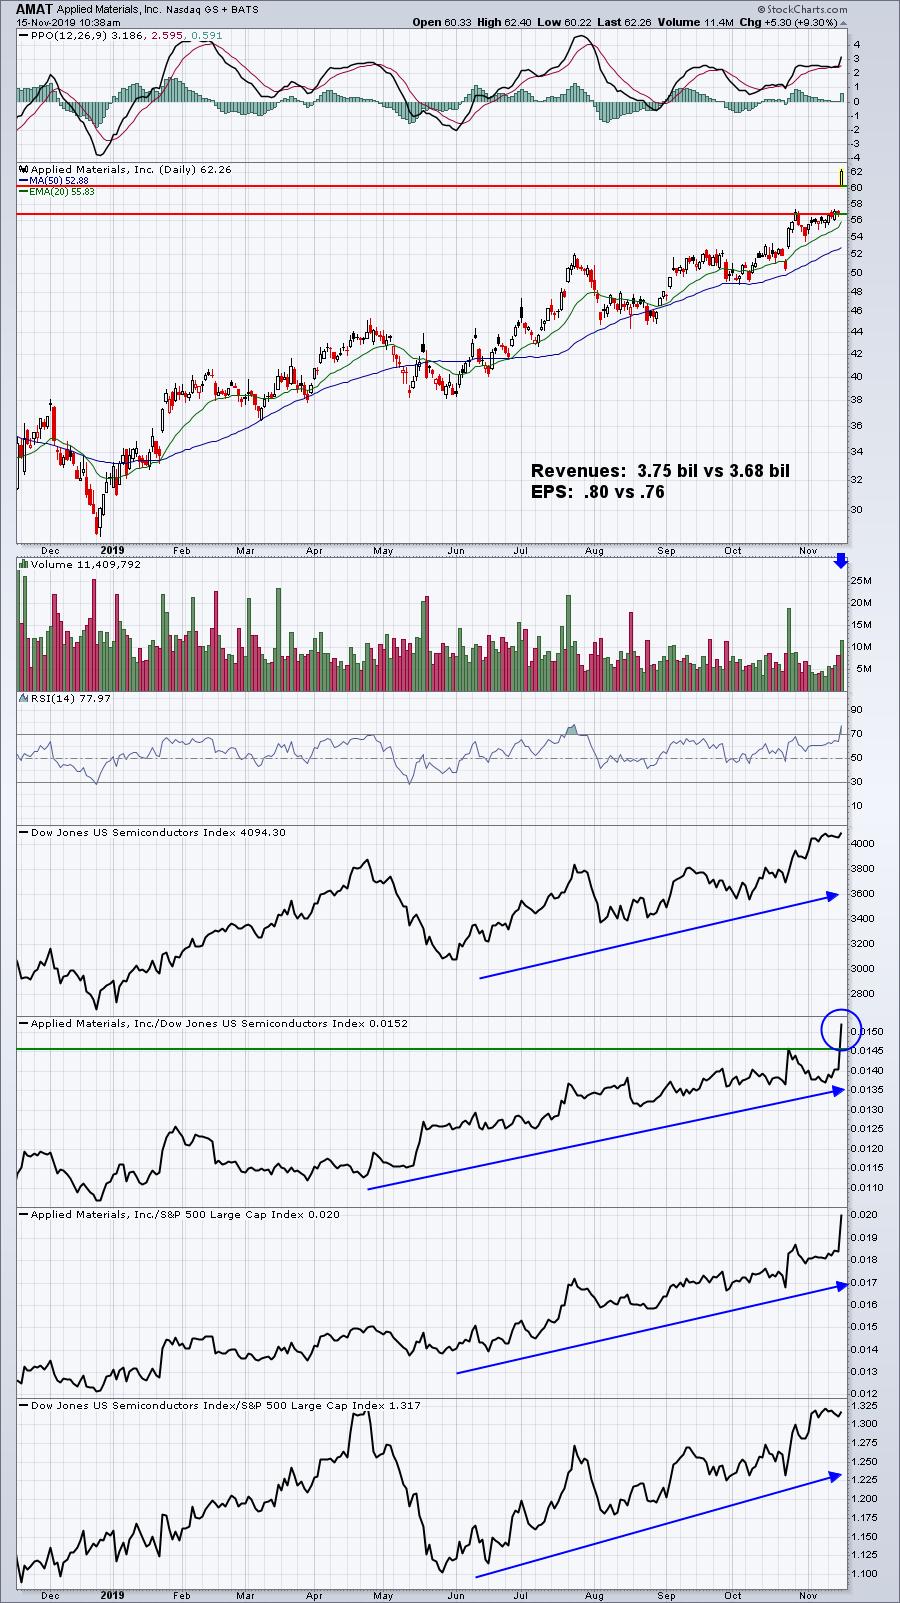
Not only did AMAT easily beat consensus estimates, but they also provided a bullish forecast, raising guidance for next quarter's revenues and EPS. AMAT was featured in our EB Digest on Wednesday morning, suggesting that we were likely to see a strong report. I pointed out that AMAT had all-time highs just above 60 and said "I won't be shocked if AMAT moves to fresh all-time highs after its report this week". AMAT is up 9% thus far today and trading at an all-time high.
I'm not psychic. I don't have insider information. Instead, I have the only thing I need - my charts.
Earnings Reports
Here are the key earnings reports for today and Monday, featuring stocks with market caps of more than $5 billion. I also include a few select companies with market caps below $5 billion. Finally, any portfolio stocks that are reporting are highlighted in BOLD. Please make sure you check for earnings dates for any companies you own or are considering owning:
Friday, November 15:
JD. Others less than $5 bil: None
Monday, November 18:
ZTO, WWD. Others less than $5 bil: None
Economic Reports
October retail sales: +0.3% (actual) vs. +0.2% (estimate)
October retail sales less autos: +0.2% (actual) vs. +0.4% (estimate)
November empire state manufacturing report: 2.9 (actual) vs. 5.0 (estimate)
October industrial production: -0.8% (actual) vs. -0.4% (estimate)
October capacity utilization: 76.7% (actual) vs. 77.2% (estimate)
September business inventories: -0.2% (actual) vs. +0.1% (estimate)
Happy trading!
Tom