
EB Daily Market Report - Thursday, November 21, 2019
Executive Market Summary
- We're seeing profit taking with all of our major indices fractionally lower
- Several semiconductor equipment stocks (LRCX, KLAC, AMAT) were downgraded to SELL by UBS
- Energy (XLE) leads the market for a second straight session; crude oil is up 2% and is above $58 per barrel
- Real estate (XLRE), a defensive sector, is today's laggard
- Investment services ($DJUSSB) is one of the strongest industries and featured below in Sector/Industry Focus
- ROST was stopped out yesterday at the close and it will report its earnings today after the closing bell
Market Outlook
Now that we're firmly into November, let's talk seasonality. I'm not a fan of the "go away in May" theory, because there are always opportunities throughout the year. Also, the worst time of the calendar year is from mid-July through late-September. If I was going to go away, that's when I'd do it. Having said that, there's no doubt that the stock market has a history of performing better from November through April than it does from May through October. Need proof?
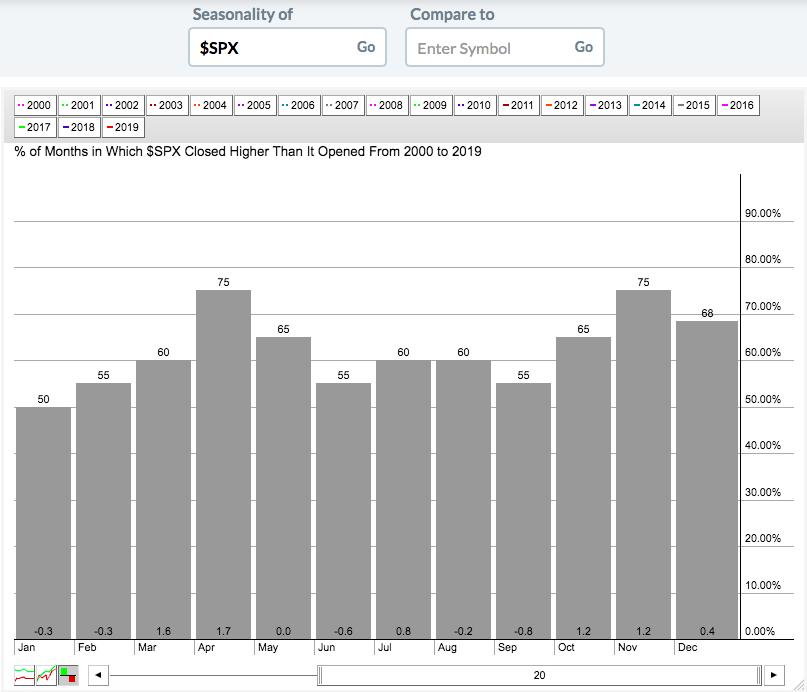
If you add up the average monthly returns, here's your semiannual breakdown of average returns over the past 20 years:
November through April: +4.3%
May through October: +0.4%
These returns are low because half of the 20 years were spent in a secular bear market where we went nowhere. So the gains from the last 10 years are heavily watered down. Still, you can see the disparity. I keep historical data on the S&P 500 and this disparity is even stronger over the past 70 years.
The good news? We're only 3 weeks into the strongest 6 month period. :-)
Sector/Industry Focus
Investment services ($DJUSSB) hasn't been an area to focus on the past couple years as it's badly underperformed the S&P 500, but that is definitely changing. The DJUSSB has broken out to a 52 week high and is quickly approaching 1300. It's had few closes above 1300 in its history and its all-time intraday high is 1341. The relative strength has improved tremendously - to the point where we should be considering investments/trades in this space. Take a look at this 3 year weekly chart:
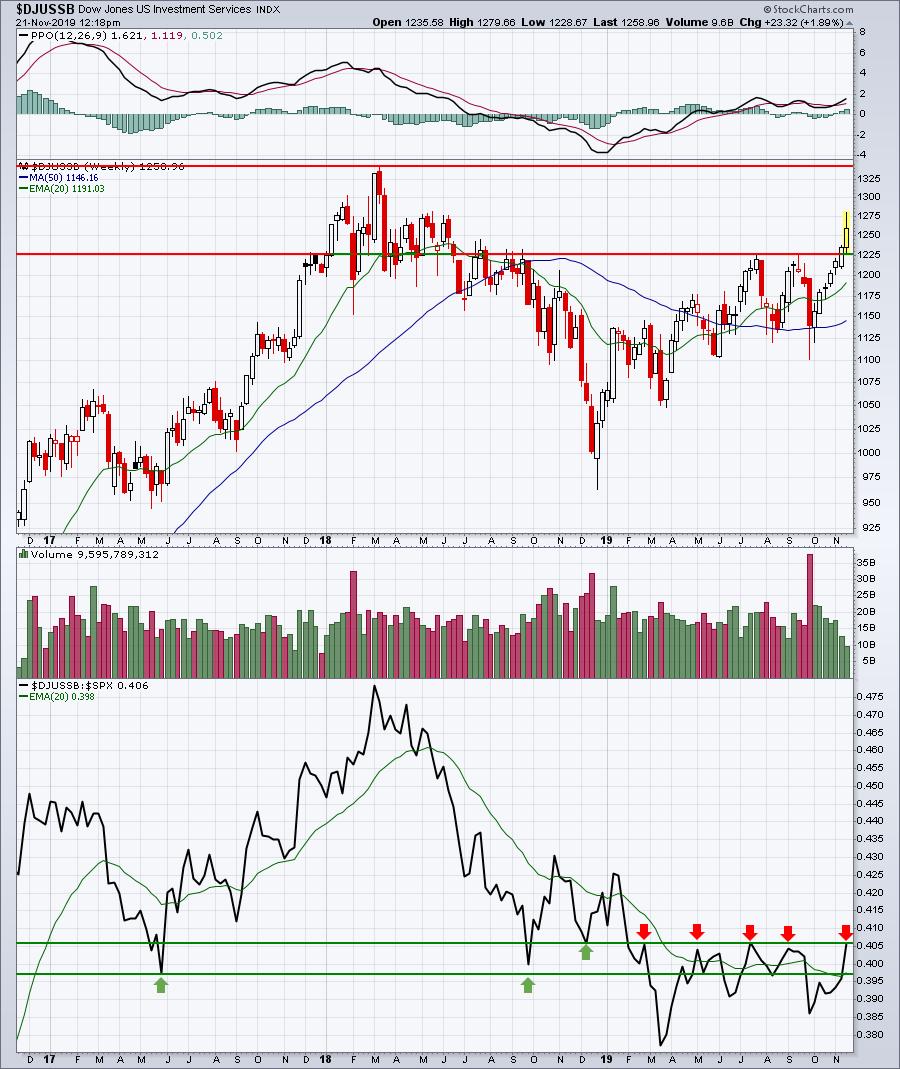
Its relative strength has once again moved well above its 20 week EMA and we're hitting the 0.406 relative price resistance where the DJUSSB has struggled throughout 2019. If we see a definitive breakout above this level, I'd consider the DJUSSB to be a desirable industry group to trade. NDAQ and AMP are two investment services stocks that are on our Strong Earnings ChartList (SECL) and both have recently broken out to 52 week highs. These two on pullbacks would be worth consideration.
Strong Earnings ChartList (SECL)
As of 11:30am EST, 19 of our 325 SECL stocks have traded more than 60% of their average daily volume. The stocks are as follows (in SCTR order, highest to lowest):
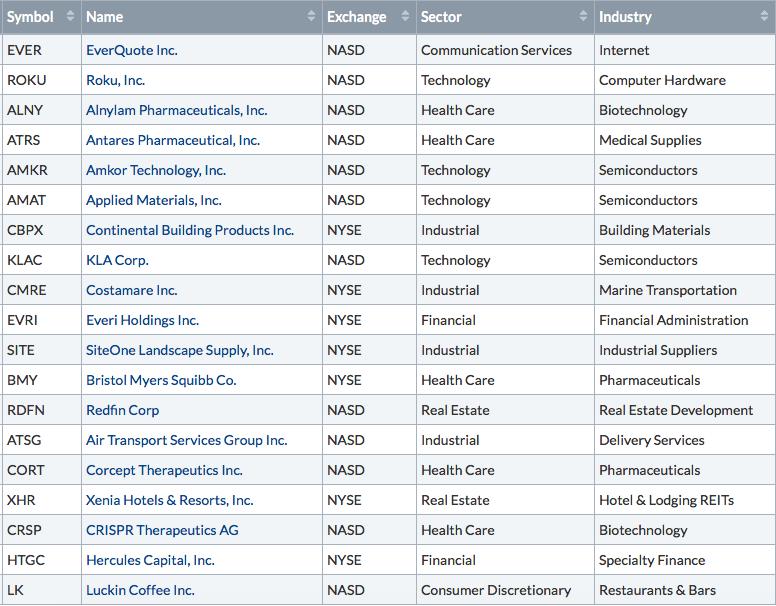
Here are two stocks on this list that are seeing heavy volume accompany recent breakouts (both in healthcare):
ALNY:
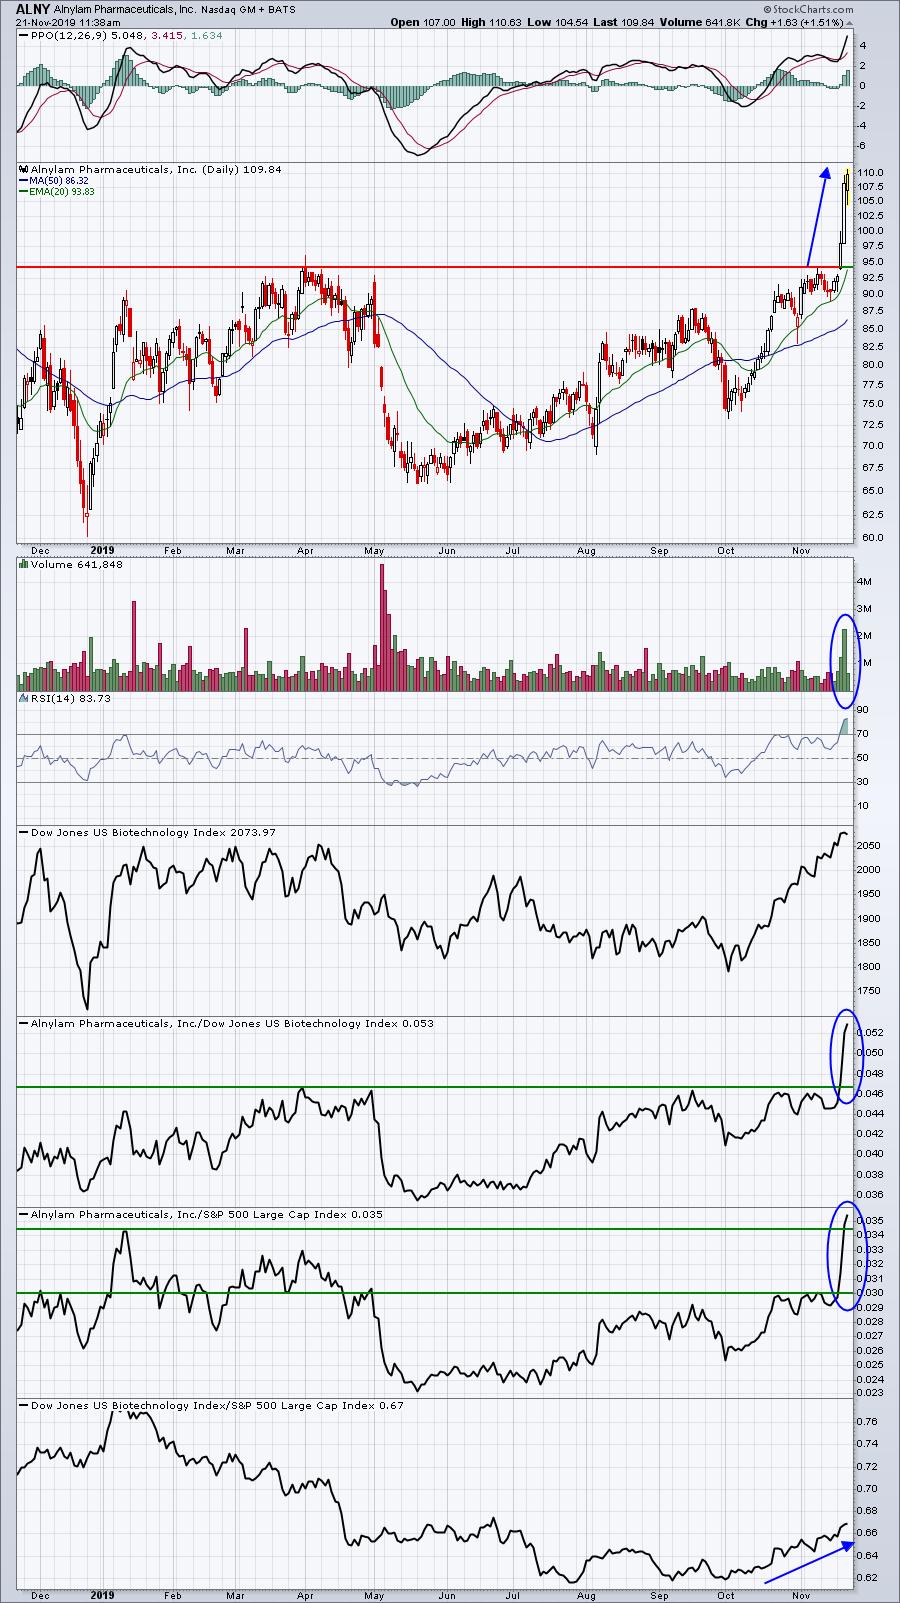
This biotech has surged through overhead price resistance and done so with excellent volume. More and more biotechs are seeing this type of behavior.
ATRS:
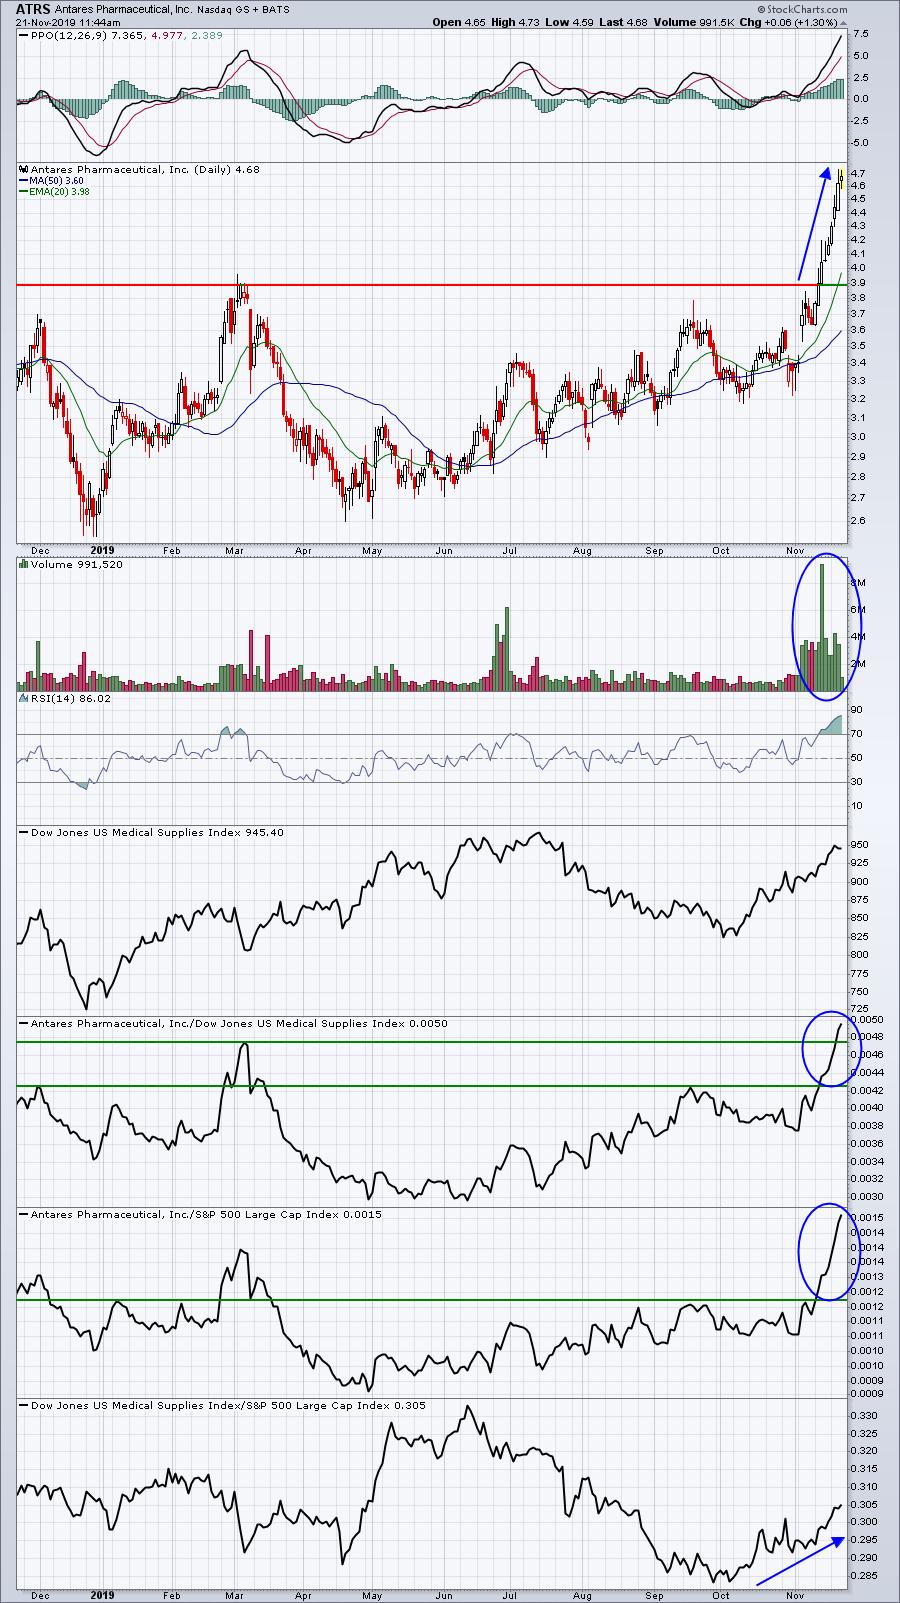
ATRS is in the medical supplies ($DJUSMS) area, but WOW what a move since breaking out above 3.90! And check out that crazy volume to confirm! It's difficult to chase performance here, but there will be a day soon when those buying at the top will panic on a day or two of selling. That'll likely provide us an opportunity at price support at 3.90 or at the rising 20 day EMA, currently at 3.98.
Active Trade Alerts
Here are comments on our lone active alert, which was stopped out at the close yesterday:
ROST (+0.66%) - earnings date is today after the bell. Yesterday, ROST closed below its 20 day EMA at 110.44, so it's been removed as an active trade alert. It also reports its latest earnings after the bell today. It's lost a bit of relative strength over the past couple months and apparel retailers have literally been all over the map when it comes to earnings surprises. ROST has a history of posting solid earnings growth, though, which has contributed to a stellar long-term track record, one of the best in its industry:
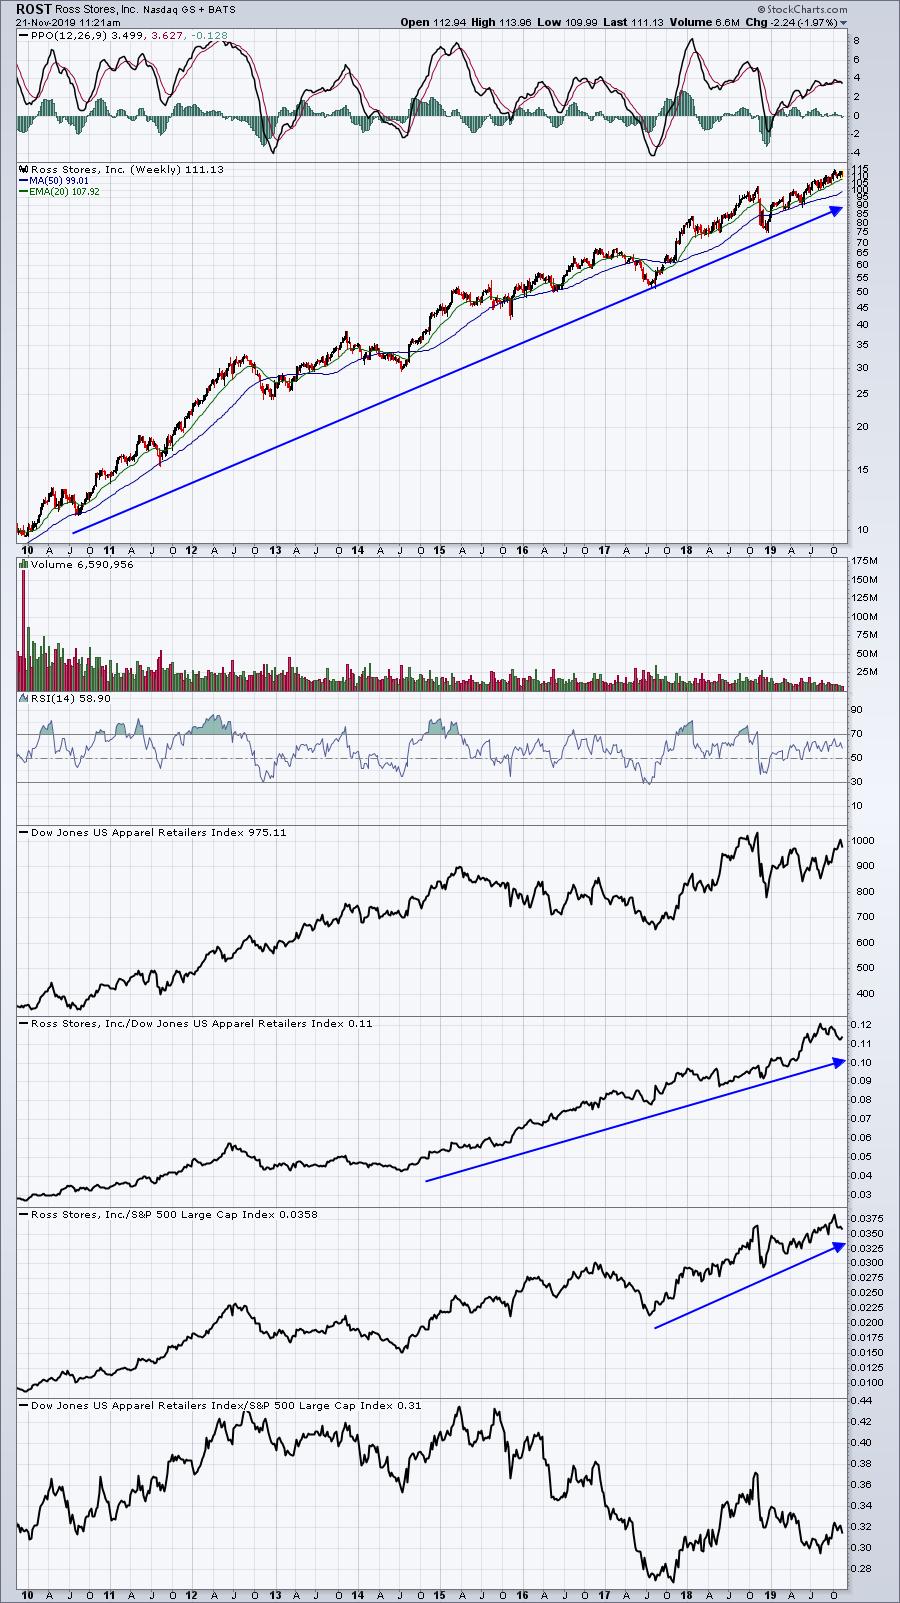
I'm not a fan of the "buy and hold" strategy, but ROST would certainly qualify as one of the few apparel retailers ($DJUSRA) to consider for such a strategy.
Movers and Shakers
We opened November with the S&P 600 Small Cap Index hitting 997, its 52 week high. Since then, however, we've seen some selling in this index, hitting a low today of 967.08. In order to find a few recent leaders in this small cap space, I ran the following scan:
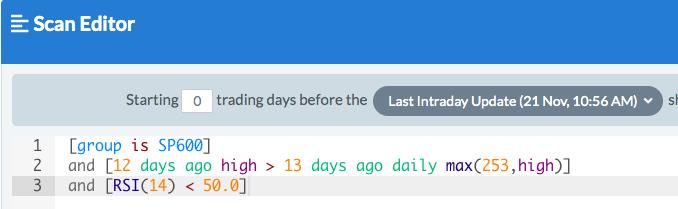
Here were the results:
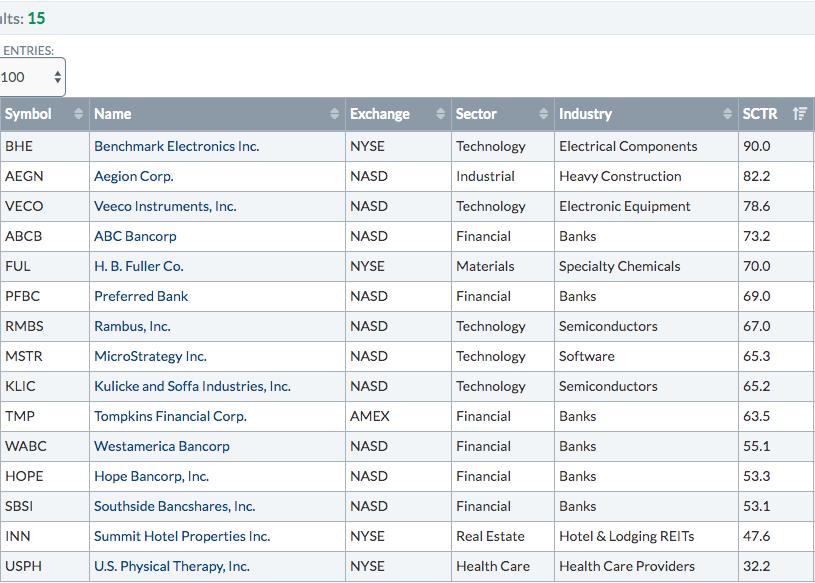
Many of the above stocks have less volume than I like to see, but I do like the following stocks that see improving reward to risk entry points as they fall:
BHE:
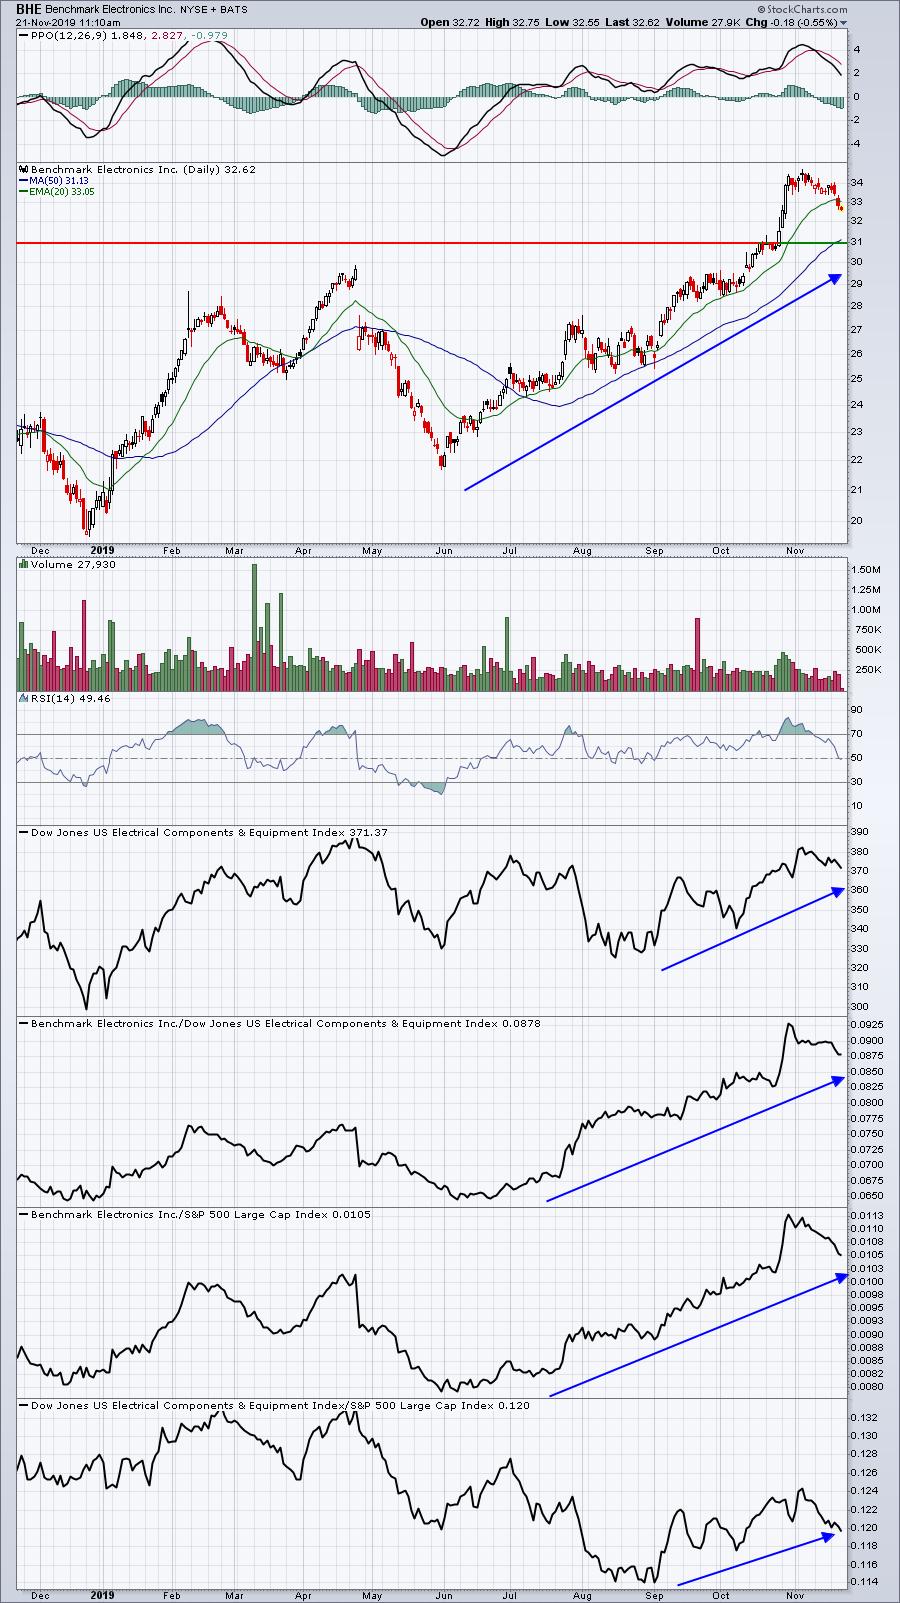
BHE should have solid price support close to 31, so the closer it gets to that level, the better the reward to risk scenario.
KLIC:
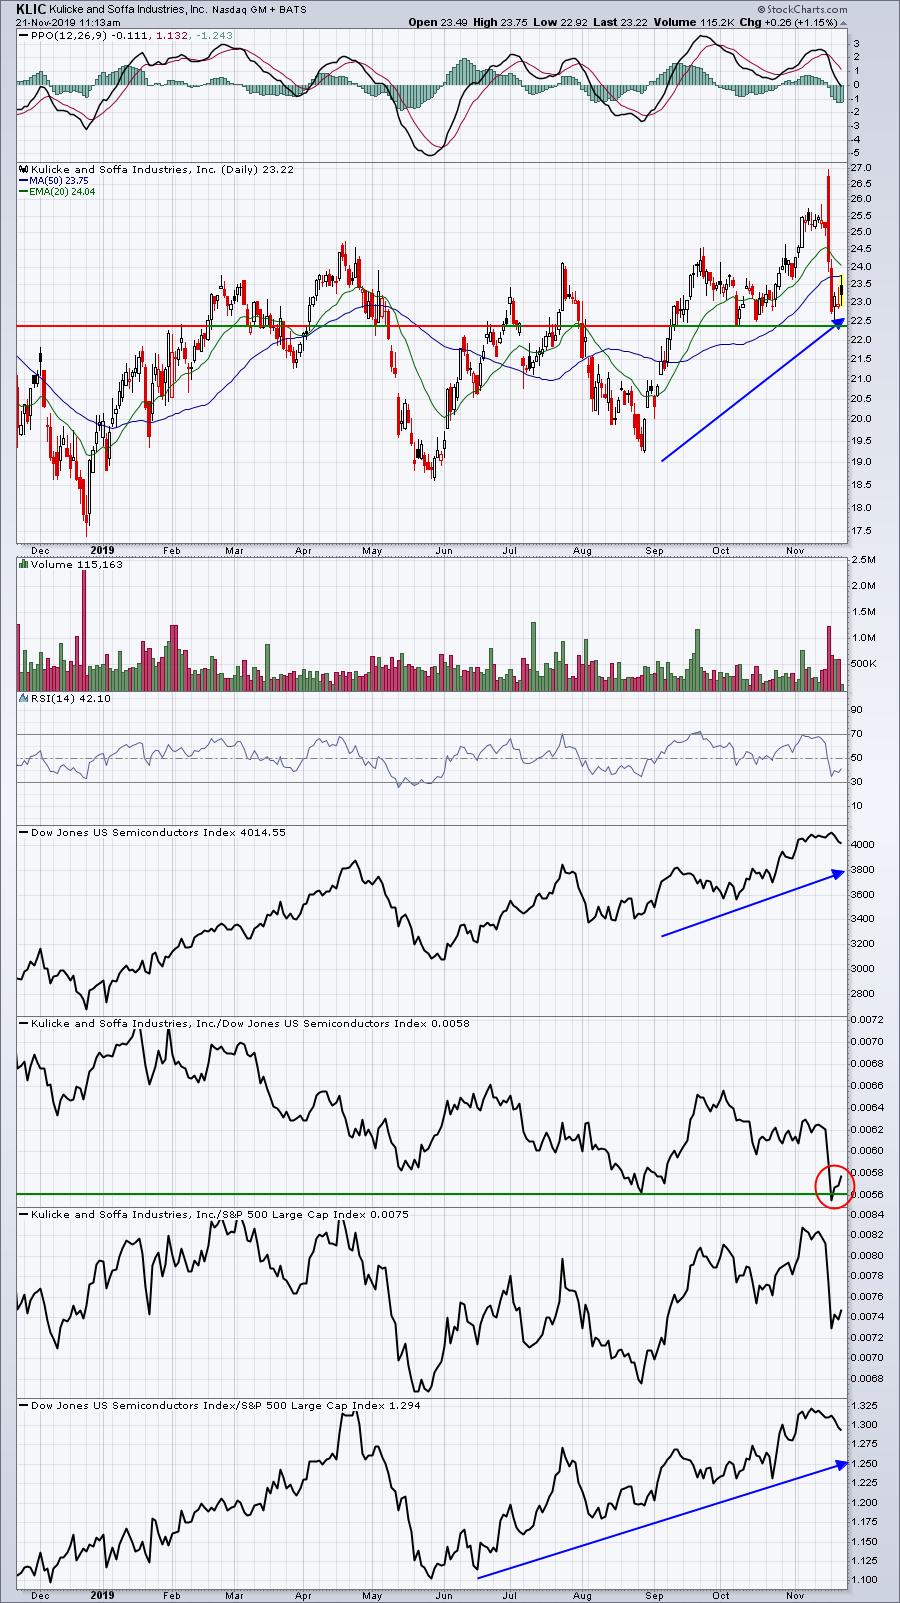
KLIC gapped significantly higher recently on very heavy volume, but then sold off down close to recent price support at 22.40. This morning, KLIC was upgraded and opened higher. But once again, it's trading down since that opening gap higher. I believe there's a solid chance for KLIC to rally back to that 27 level. However, you must realize that KLIC just hit a 52 week relative low vs. its semiconductor peers ($DJUSSC). If I trade a stock with poor relative strength, I make sure I keep a very tight stop in place. For KLIC, I'd no longer be interested if it were to move back beneath that 22.40 low.
Earnings Reports
Here are the key earnings reports for this week, featuring stocks with market caps of more than $5 billion. I also include a few select companies with market caps below $5 billion. Finally, any portfolio stocks (or active trade alerts) that will be reporting results are highlighted in BOLD. Please make sure you check for earnings dates for any companies you own or are considering owning:
Thursday, November 21:
INTU, ROST (active trade alert), SPLK, STNE, POST, GPS, PLAN, JWN, WSM, BERY, PSTG, M. Others less than $5 bil: BJ
Friday, November 22:
SJM. Others less than $5 bil: FL, BKE
Economic Reports
Initial jobless claims: 227,000 (actual) vs. 217,000 (estimate)
November Philadelphia Fed survey: 10.4 (actual) vs. 7.0 (estimate)
October existing home sales: 5,460,000 (actual) vs. 5,480,000 (estimate)
October leading indicators: -0.1% (actual) vs. -0.2% (estimate)
Happy trading!
Tom