
EB Daily Market Report - Monday, December 2, 2019
Executive Market Summary
- U.S. equities are under pressure today, though we're slightly above earlier lows
- One thing notable about today's action is that the Volatility Index ($VIX) is testing its 50 day SMA for the first time in 7 weeks.
- 10 year treasury yield ($TNX) is higher by 5 basis points to 1.83%
- Energy (XLE) is the only sector in positive territory today
- Technology (XLK) is under the most selling pressure, especially software ($DJUSSW) and semiconductors ($DJUSSC)
- There's no technical damage to our major indices, in my opinion
- We've added two alerts today - TPX at 82.20 and BRKS at 42.22
Market Outlook
It's so difficult to predict when our major indices will take a break. In my Weekly Portfolio Report, I discussed one negative divergence on the $SPX daily chart and another that would likely form on the hourly $SPX chart if we saw strength to open the week. These don't guarantee us anything, but definitely put us "on notice" that a bout of selling could surface. Well, it surfaced this morning and we nearly hit the first key support level that I identified. Here's the daily chart:
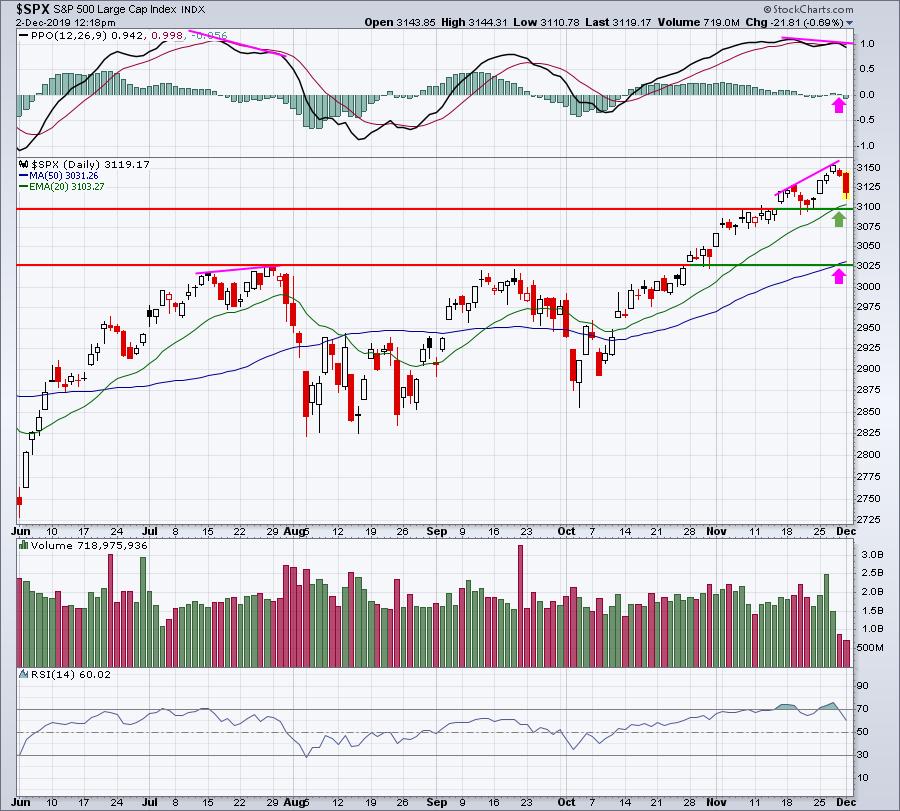
The 20 day EMA is currently at 3103 and gap support resides near 3100. If those two levels are lost, I believe the odds grow that we could meander lower to test the rising 50 day SMA and reset the PPO back near centerline support. A rally off of today's earlier low, however, would be quite bullish. I believe that's a very real possibility, which is why we added two trade alerts today. If the S&P 500 moves lower, we'll likely get stopped out with a small loss. But if we rally from here, those are two stocks that definitely could benefit.
Sector/Industry Focus
Semiconductors ($DJUSSC) have been absolute and relative leaders in the second half of 2019. I believe we've just tested a key short-term support level this morning in this volatile industry group:
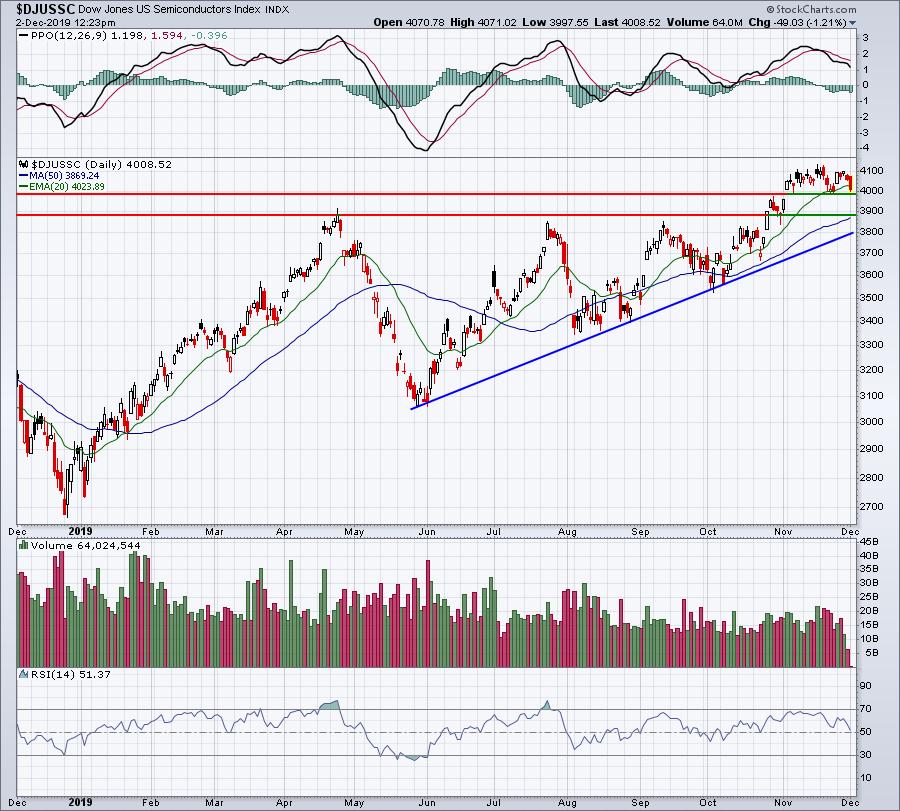
Recently, 3988-4000 has proven to be excellent support. We could see a big move higher from here, but I'd grow more cautious if 3988 support is lost. Having the DJUSSC test key short-term price support, however, was a big reason for sending BRKS out as an alert today. BRKS stands to benefit in a big way if the DJUSSC rallies off this short-term support.
Strong Earnings ChartList (SECL)
Many times, uptrending stocks will find short-term bottoms with RSI readings between 40 and 45. So I ran a scan of SECL stocks looking for stocks that have current RSI readings in that range. The scan returned 16 of 325 SECL stocks as follows sorted by SCTR (highest to lowest):
KLAC, ROKU, ELF, QCOM, LSCC, HEES, TPX, COST, BRKS, FAST, EQR, ONDK, HOG, TEAM, CCI, ECA.
I found the following two charts interesting, both semiconductors ($DJUSSC):
LSCC:
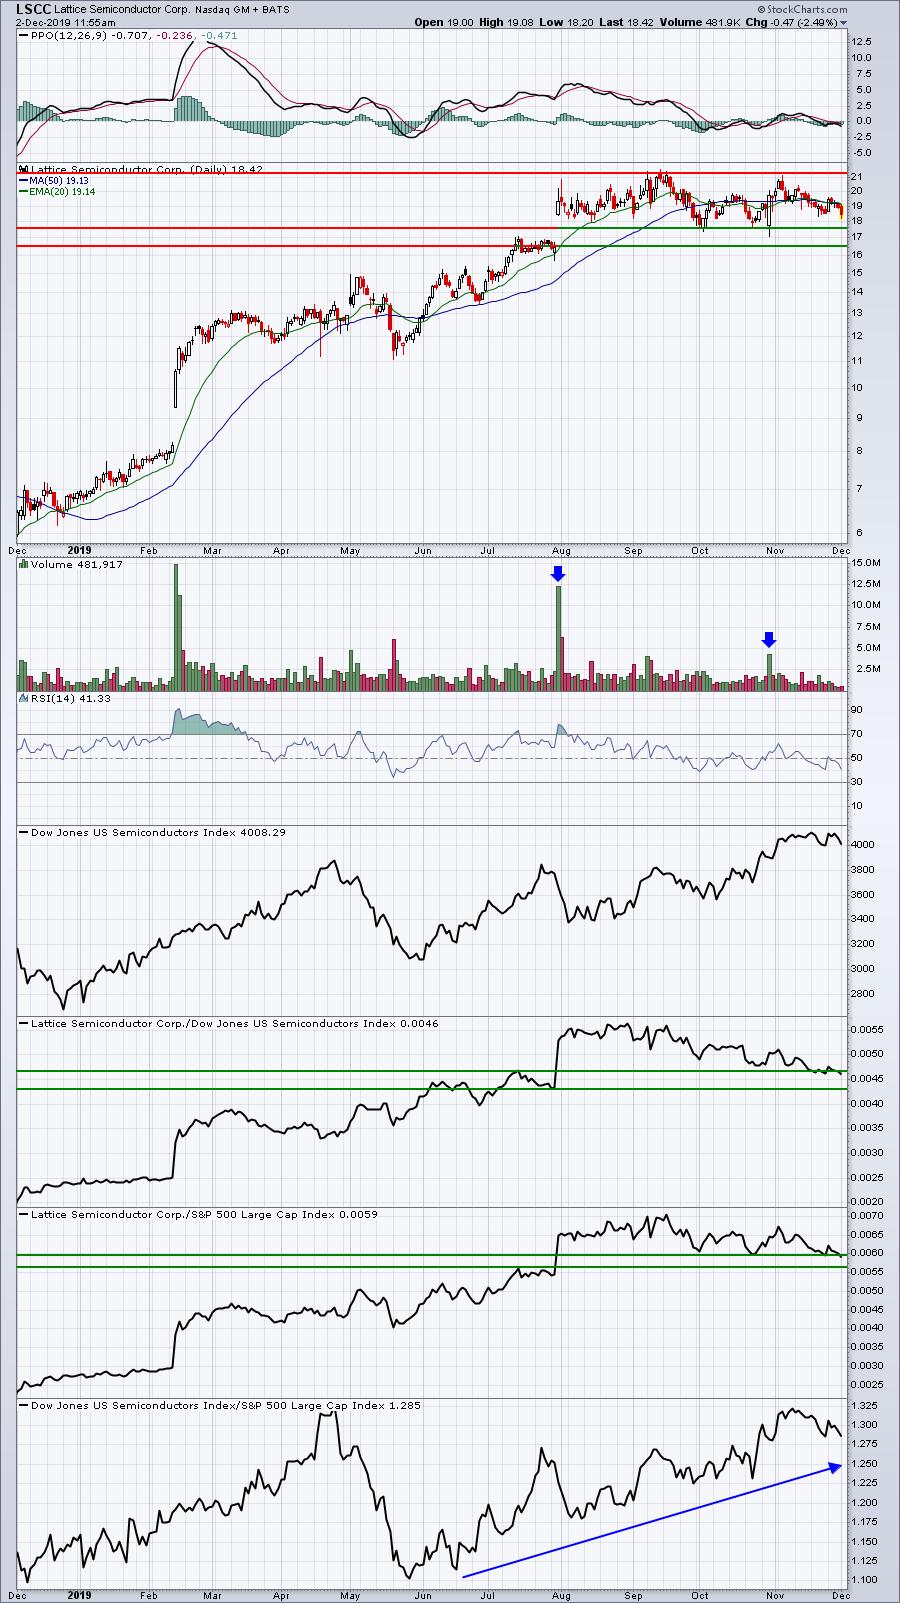
LSCC has been consolidating for a long time, and many of you will recall it was part of our Aggressive portfolio last quarter. Should small caps begin leading, this small semiconductor could very well resume its prior uptrend.
BRKS:
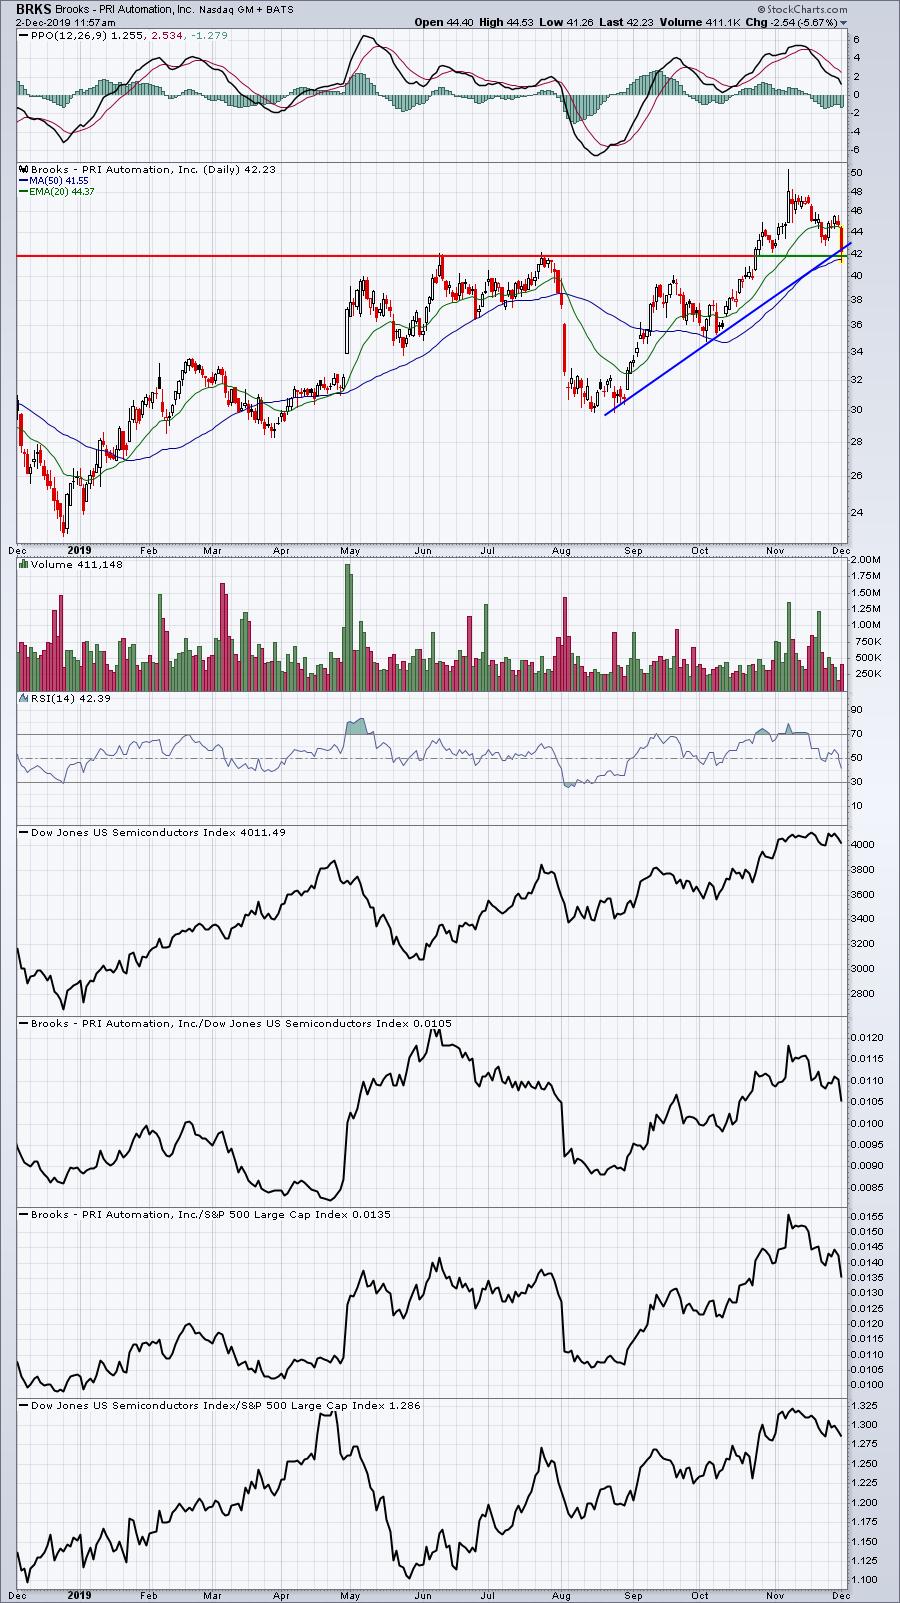
BRKS has fallen back to test its breakout level and volume trends here have been very strong. I've decided to add BRKS as an Active Trade Alert based on its solid reward to risk scenario.
Active Trade Alerts
We've added two alerts today given the selling from Friday and today. TPX was featured in last Tuesday's DMR and it's fallen further, adding to a solid reward to risk entry. BRKS was discussed up above as part of a scan run against our SECL and a chart was included there. Here's a current chart on TPX:
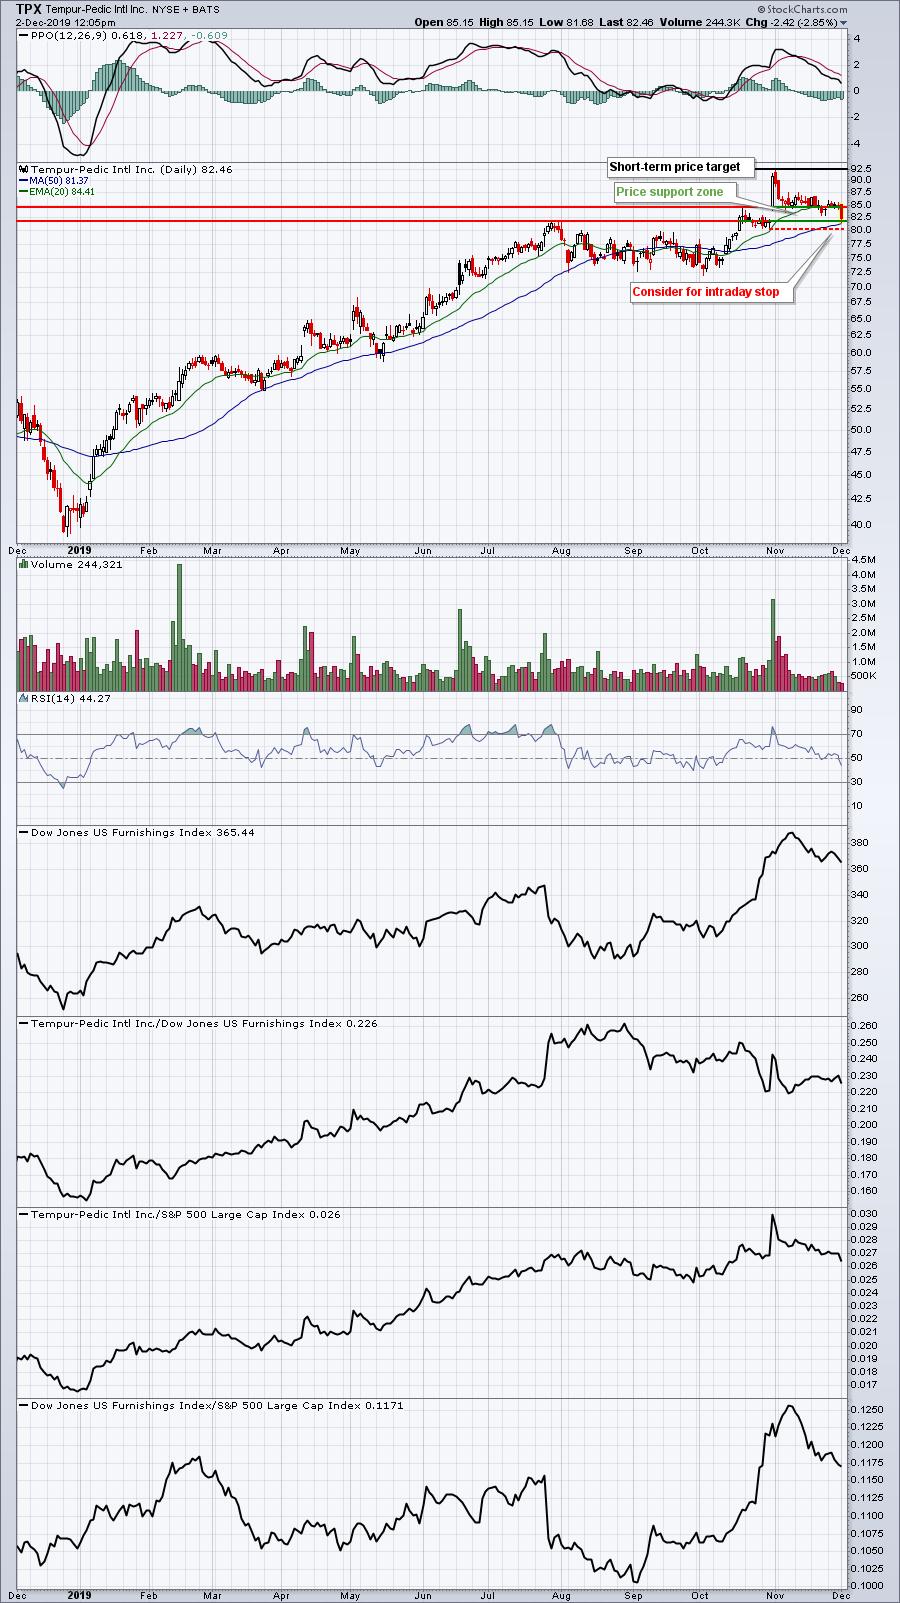
If the current downtrend continues, we can exit fairly quickly with not much at risk. If, however, a short-term bottom is found, there's a solid return opportunity here.
I posted the following last week and it bears repeating, especially for those who are new to our service.
I received a couple emails from members recently asking for more alerts. If I happen to spot a stock in real time that looks like a solid reward to risk trade candidate, I'll send it out. One problem is that I spend much of my time throughout the day either writing blog articles, hosting Trading Places LIVE shows, writing the DMR, and then taking the time necessary to research and prepare for all of those activities. That makes it difficult to actively seek out trade alerts throughout the trading day. To be honest, it impacts my own short-term trading routine, which is fine. I love providing the education that we do at EarningsBeats.com.
When I run scans here in the DMR, identify the results of those scans, and then annotate charts, I'm providing viable trade candidates. That's the purpose of the SECL and Movers & Shakers sections of this report. I'm searching the entire market for prospects as I see market rotation. For instance, today's DMR focuses on mid cap and small cap stocks, some that are part of the SECL and others that are not, because that's a trendy area of the market today and recently.
When we add active trade alerts, the primary difference between these and the other trade setups is that we follow up daily on these trade alerts. This is done primarily for education. I try to provide everyone my perspective on what I'm thinking throughout the life of a trade - whether it's a winner or a loser. We've had discussions on trade alerts here at EarningsBeats.com and whether they're worthwhile. I believe they are because it's an extension of the education that we provide. But you should not view them simply as a way to manage an entire portfolio. For instance, if there are no alerts out, it should not be construed that I'm bearish or cautious. I am wildly bullish about the stock market's prospects over the next 12 months.
Movers and Shakers
I ran a scan against the S&P 500, searching for stocks with SCTRs above 80 and RSIs that have dipped below 50. First, here is the simple scan code that I used:
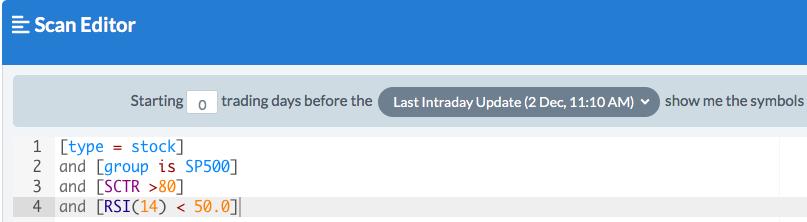
As of 11:15am EST, there were 7 results (in SCTR order, highest to lowest): KLAC, LRCX, VLO, MU, KEYS, SHW, JBHT. Here are charts I'd follow:
LRCX:
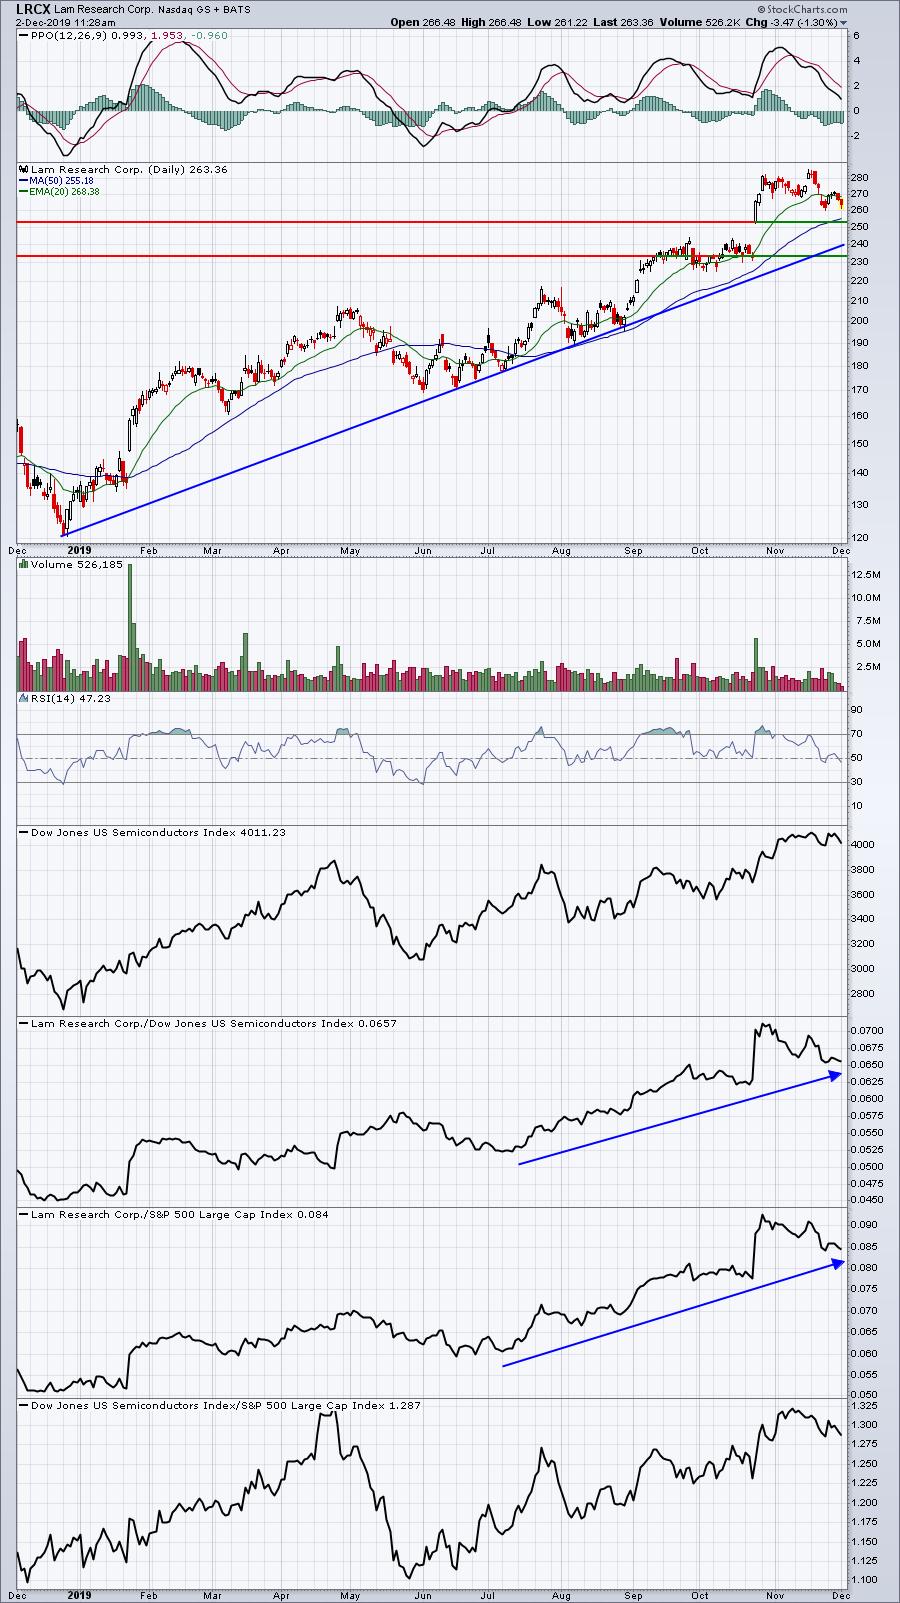
The top of gap support could very well be the key low on the LRCX chart and we're not far from that level. If we do head back to the mid-250s, it would represent a 10% pullback from its post-earnings high.
KEYS:
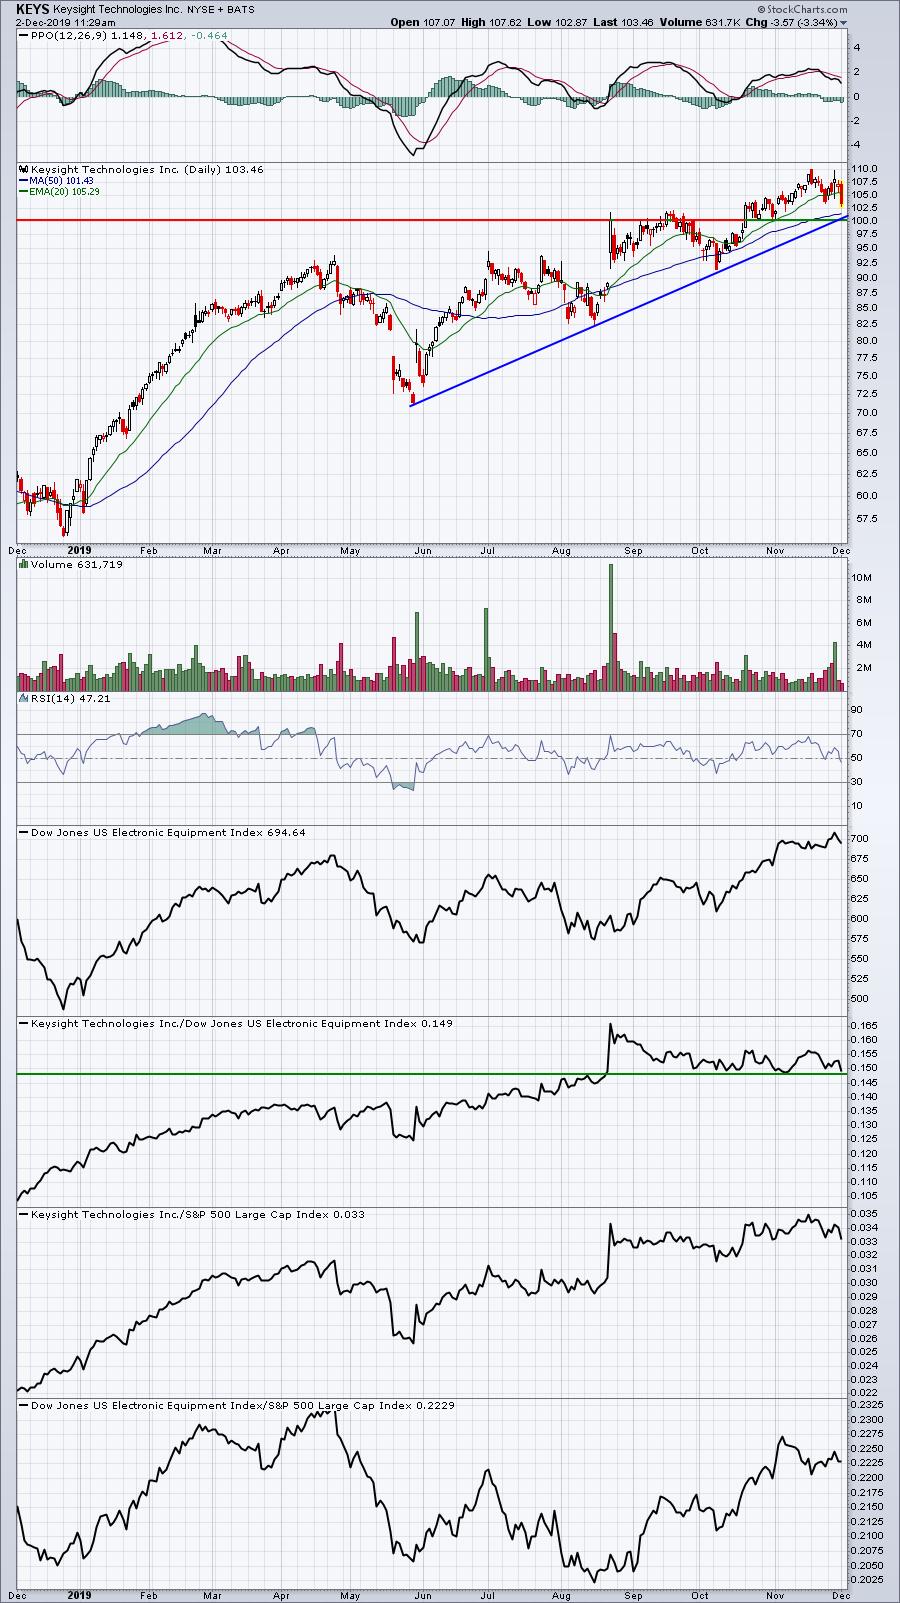
KEYS has been an excellent performer in 2019 and has trendline and price support that intersect very close to 100, which would also represent approximately 10% decline from its recent high.
JBHT:
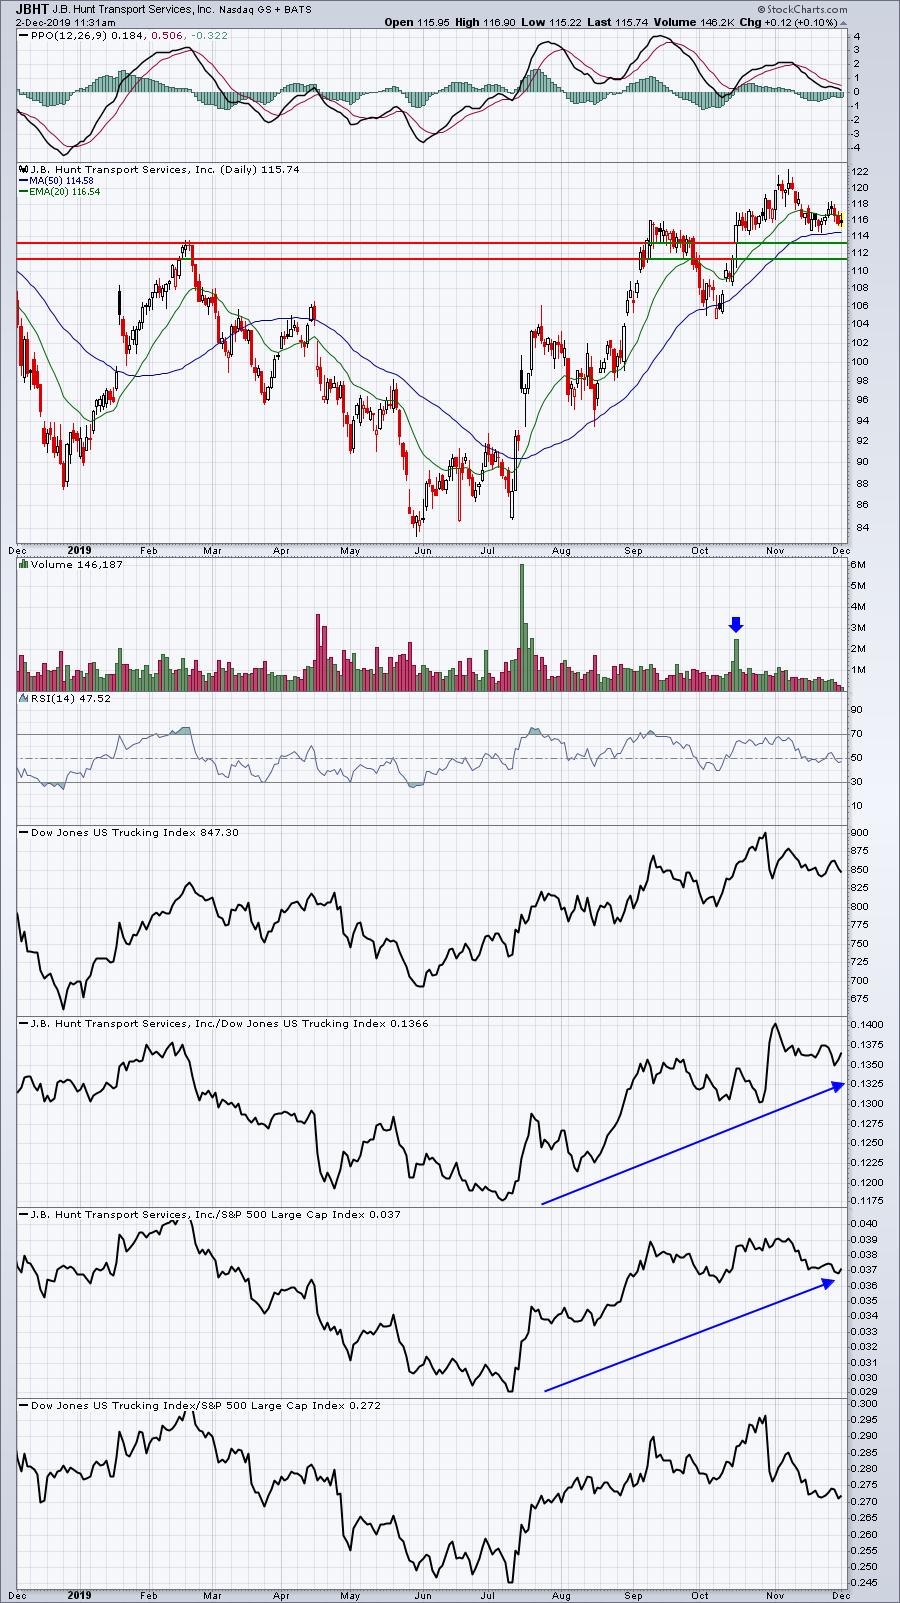
JBHT is a leading transport and has fallen from 122 to 115 over the past few weeks, setting up a much better reward to risk trade. Gap support from its recent earnings resides just above 113.
Earnings Reports
Here are the key earnings reports for this week, featuring stocks with market caps of more than $5 billion. I also include a few select companies with market caps below $5 billion. Finally, any portfolio stocks (or active trade alerts) that will be reporting results are highlighted in BOLD. Please make sure you check for earnings dates for any companies you own or are considering owning:
Monday, December 2:
COUP. Others less than $5 bil: None
Tuesday, December 3:
CRM, BMO, WDAY, MRVL, DCI, ZS. Others less than $5 bil: HQY, AVAV
Wednesday, December 4:
RY, SNPS, CPB, WORK, FIVE, ESTC, SMAR. Others less than $5 bil: HRB, RH, VRNT, GIII
Thursday, December 5:
TD, DG, CM, BF.B, KR, ZM, TIF, COO, OKTA, ULTA, CRWD, DOCU, GWRE. Others less than $5 bil: SAIC, CLDR, ZUO, ZUMZ
Friday, December 6:
None
Economic Reports
November PMI manufacturing: 52.6 (actual) vs. 52.2 (estimate)
November ISM manufacturing: 48.1 (actual) vs. 49.4 (estimate)
October construction spending: -0.8% (actual) vs. +0.4% (estimate)
Happy trading!
Tom