
EB Daily Market Report - Tuesday, December 3, 2019
Executive Market Summary
- Our major indices are all down considerably today with the Dow Jones down more than 400 points, or 1.5%
- Negative divergences seem to be the primary culprit as the two worst sector performers (XLF and XLK) both recent fresh highs with lower PPOs
- Several 20 day EMAs have been lost, likely leading to upcoming 50 day SMA tests
- Semiconductors ($DJUSSC) and banks ($DJUSBK), two industry groups with negative divergences, are among the weakest industries on the session
- Intel (INTC) and Apple (AAPL) are among the weakest Dow components; both of these stocks show negative divergences as well - the theme seems rather clear
- Our two alerts are mixed with BRKS struggling along with the semiconductor stocks; TPX is performing better on a relative basis
Market Outlook
Once the Volatility Index ($VIX) surges, it's an indication that the stock market is trading much more off of emotion, particularly fear. A reversing candle on the VIX can many times signal the end of a short-term pullback so that will be one thing I watch closely over the next couple days. I don't believe the selling will last long, but the bears remain in control so long as higher highs and higher lows continue to print on the VIX:
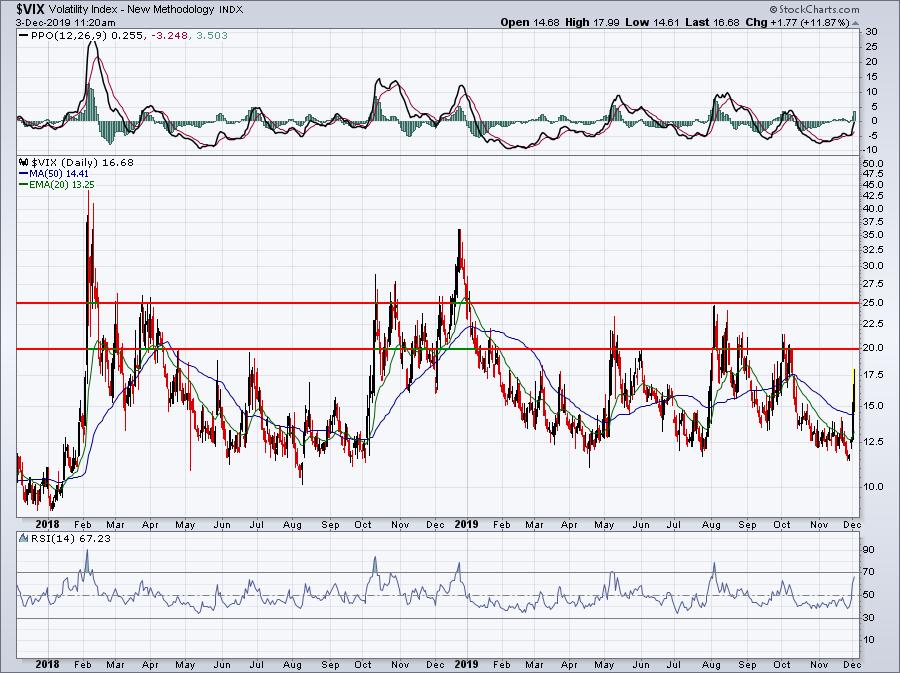
Don't expect the VIX to hit highs experienced during secular bear markets like the one we had from 2007-2009. I wouldn't even expect to see the VIX hit the 25 level that we saw at several bottoms during the 2018-2019 bull market consolidation phase. Today's high near 18 might be it, but I'd really be surprised if the VIX closes above 20. Therefore, if I was sitting in cash, awaiting a market decline, I'd put my cash to work. I think you're getting that short-term decline right now.
Sector/Industry Focus
I pointed out this seasonality chart during my Trading Places LIVE show today on StockCharts TV:
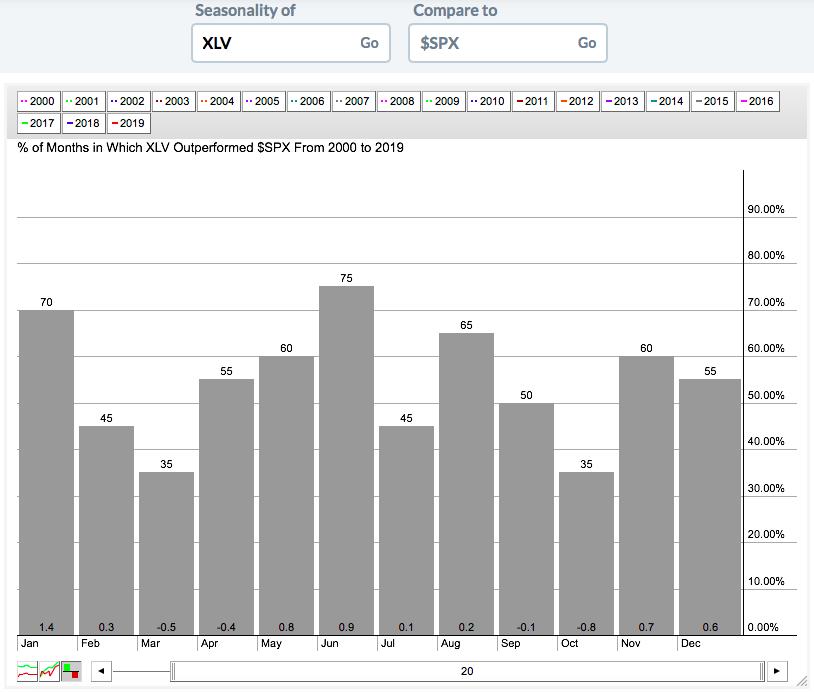
If you look at the bottom of this chart for the relative outperformance of healthcare (XLV) vs. the S&P 500 by calendar month, you'll see that November through January is exceptionally strong historically for this sector. While we're overbought on the XLV in the short-term, momentum is strong and I expect to see further leadership from this sector as we close out 2019 and head into 2020.
Strong Earnings ChartList (SECL)
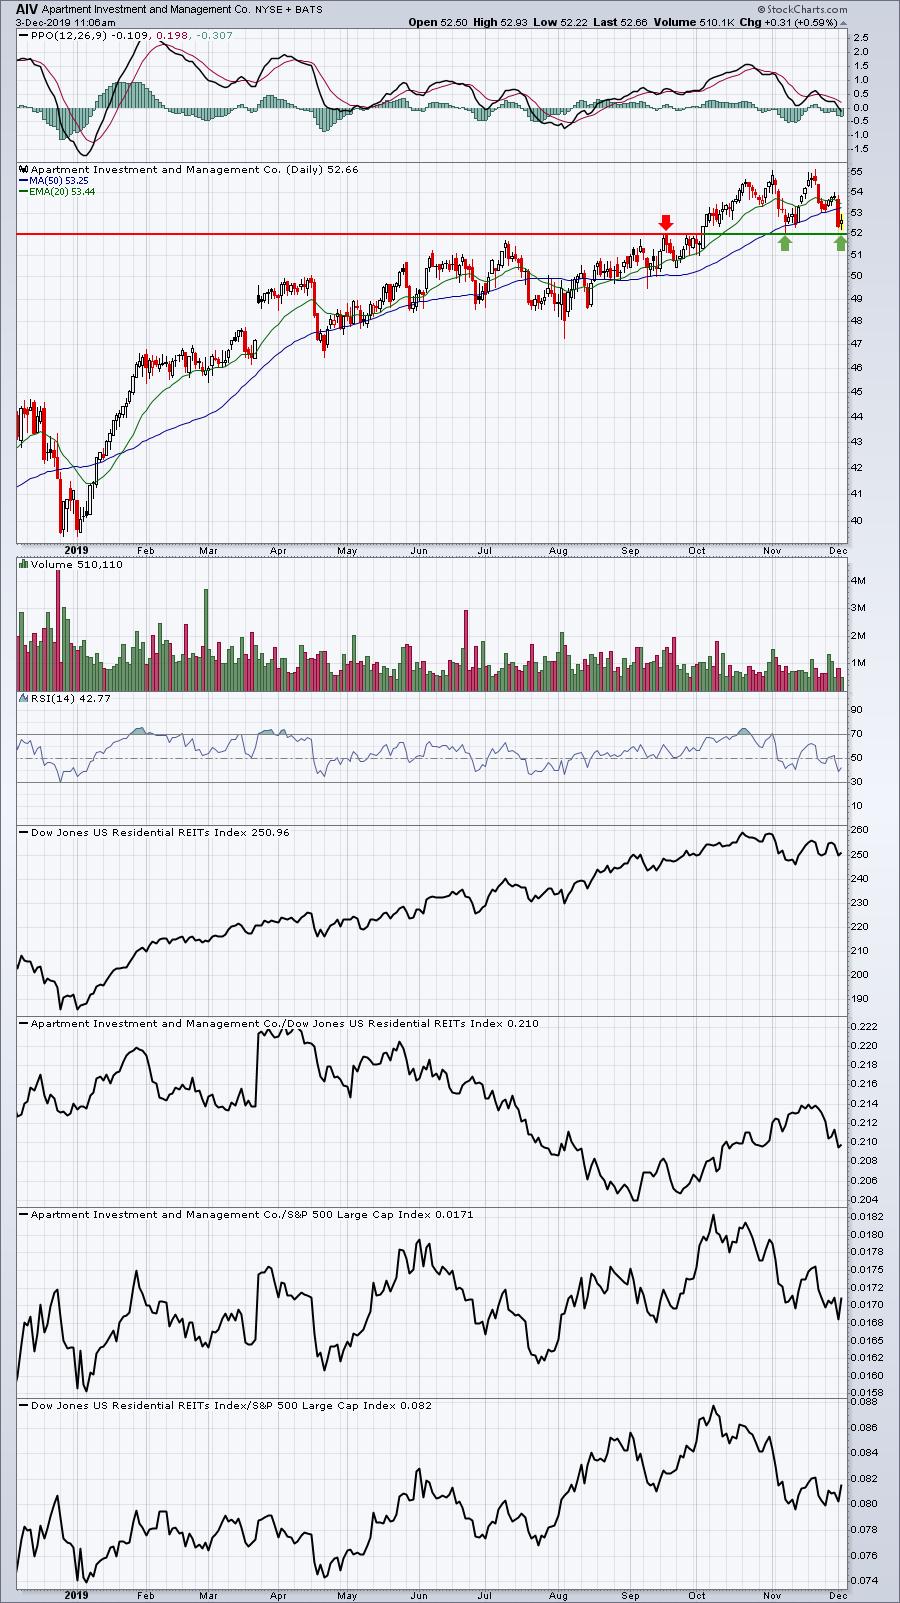
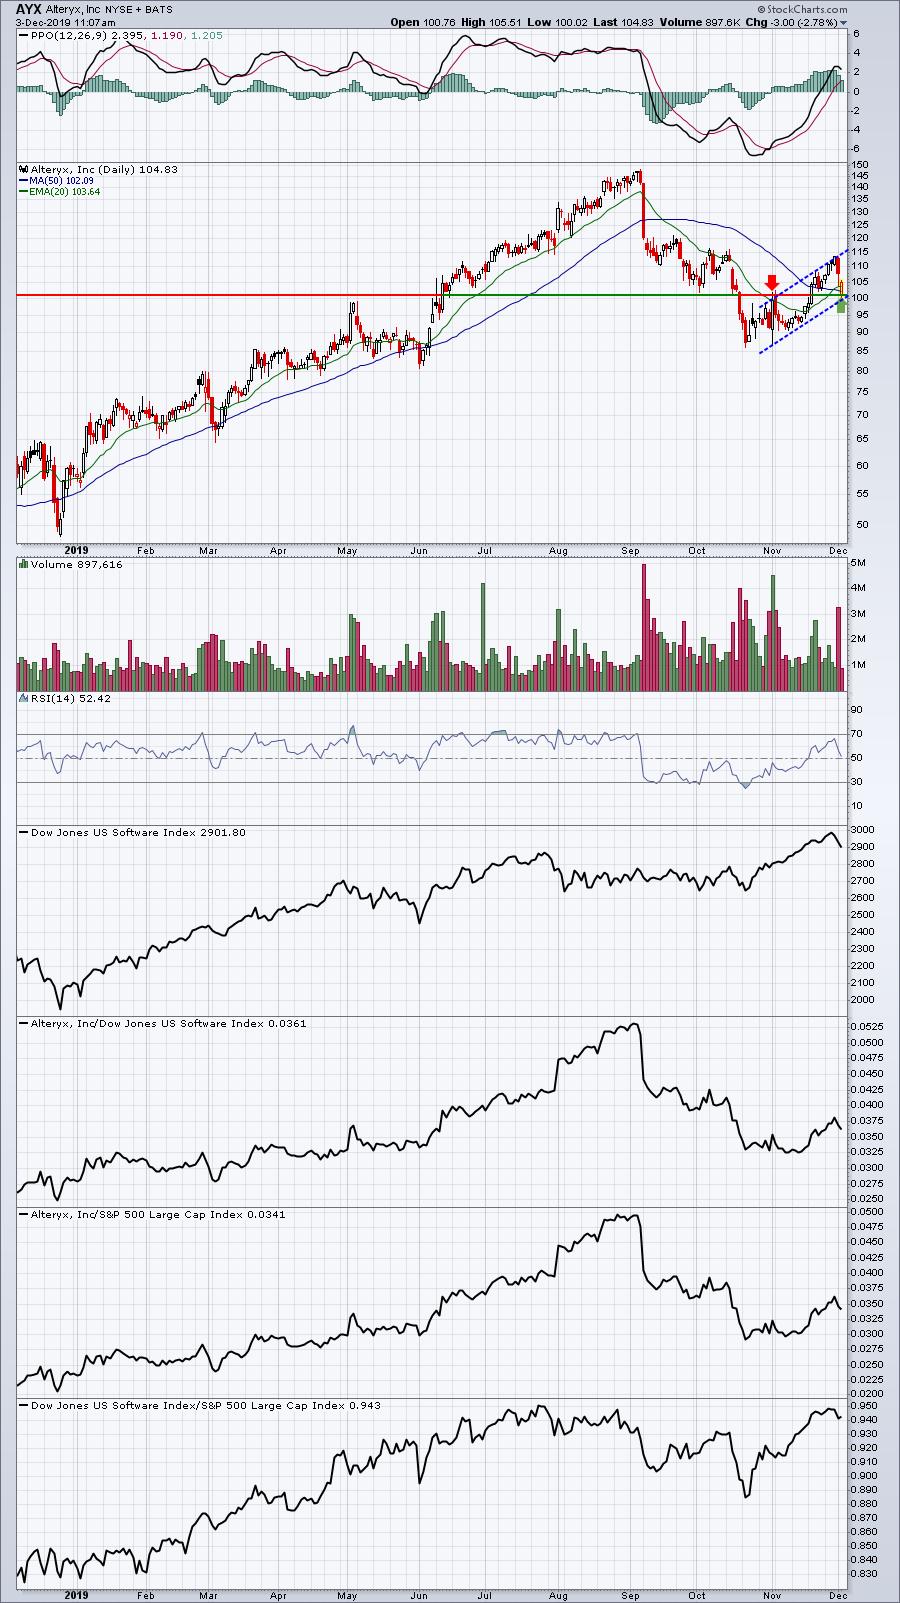
I ran a scan of SECL stocks with unusually heavy volume today. 12 of the 325 stocks have traded more than 50% of their normal daily volume as of 11:00am EST. They are:
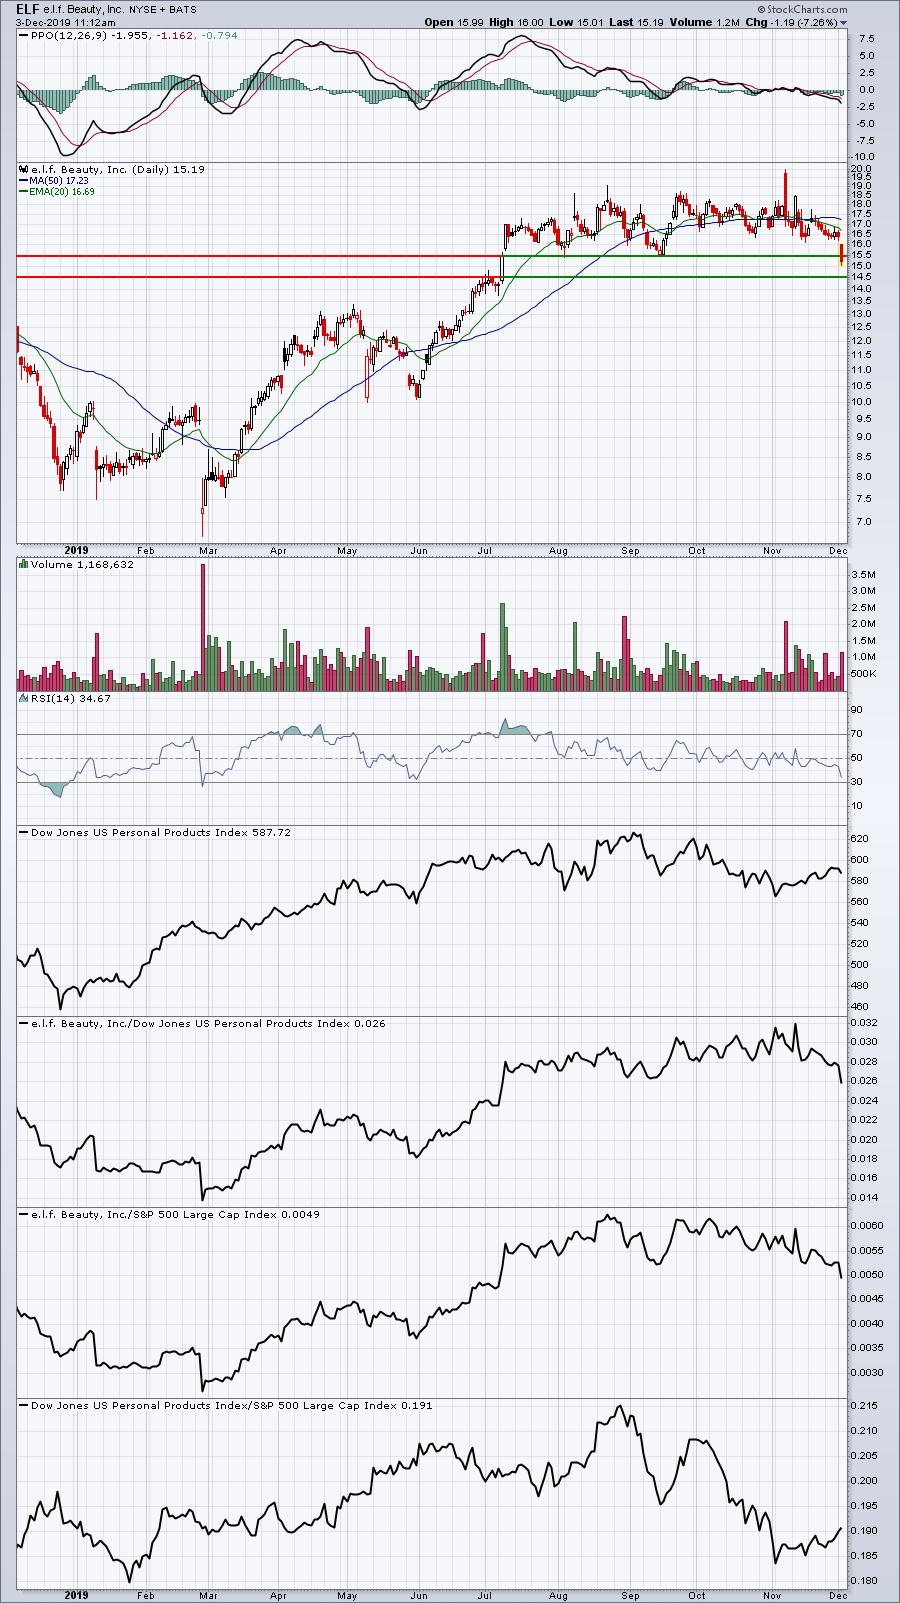
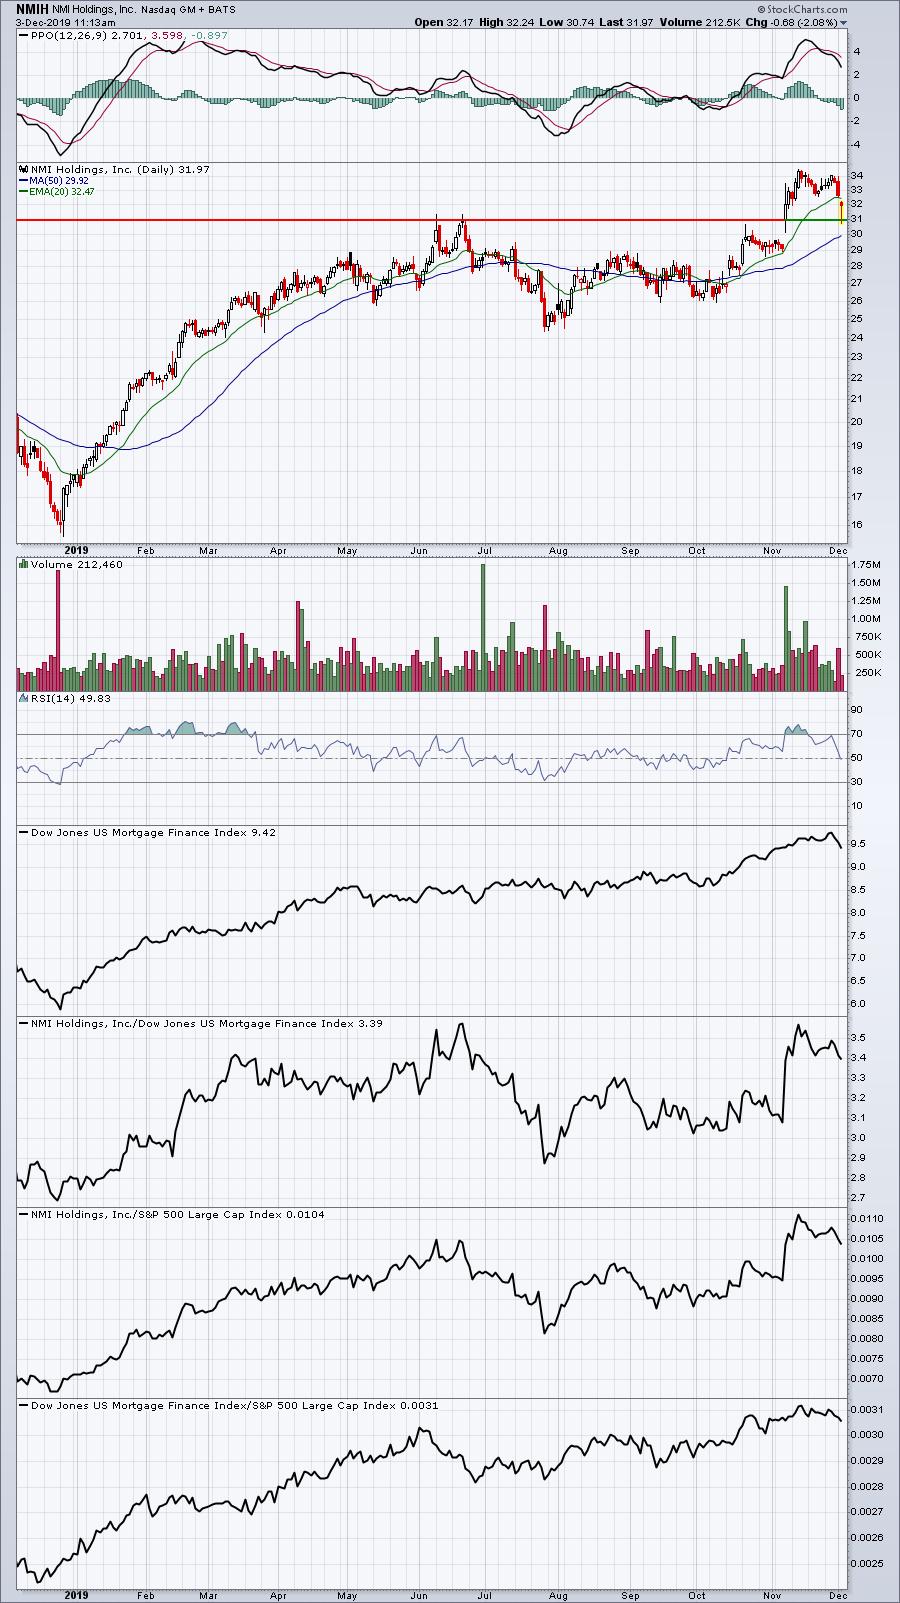
AIV, APPS, ATRS, AYX, CLVS, CRSP, ELF, GSK, NMIH, ROKU, UTX, WPRT.
Here's a quick look at several of these....
AIV:
AYX:
ELF:
NMIH:
WPRT:
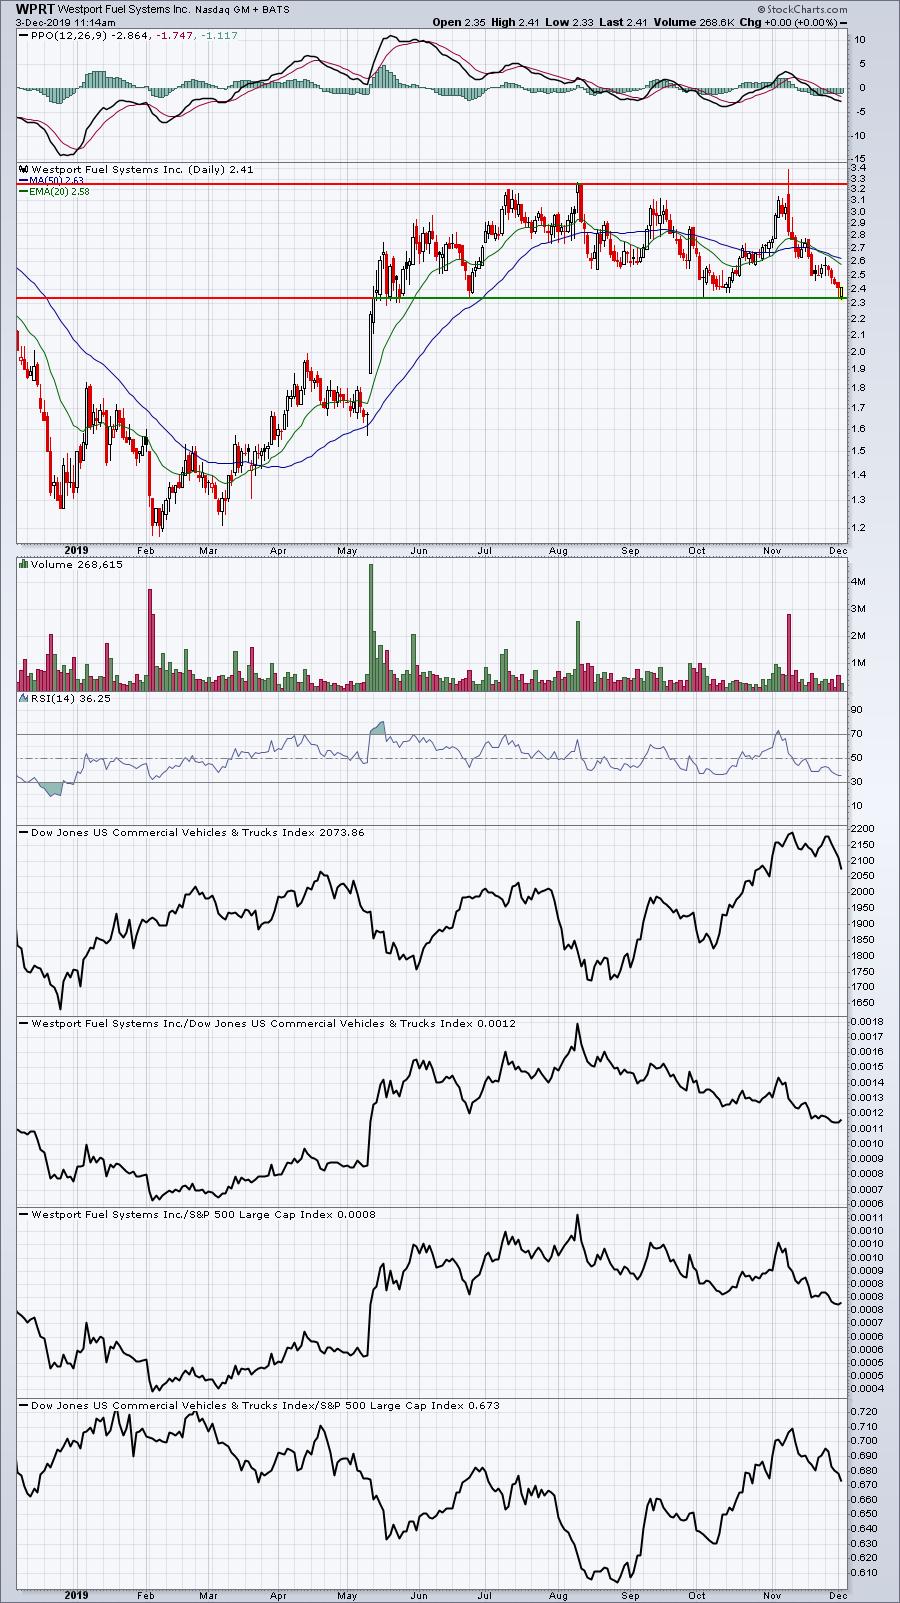
The scan was run based on higher-than-normal volume. Each of the above 5 charts highlights key price support. Keep in mind that reversals off key support levels on heavy volume is bullish, but breakdowns are bearish.
Active Trade Alerts
We have two active trade alerts after adding both TPX and BRKS yesterday. The overall market certainly isn't helping today as we see more selling, but that's one reason why keeping fairly tight stops in play makes sense. Here's a quick summary of today's action in each:
TPX (+0.31%) - reports earnings on February 12. TPX continues to consolidate in a trading range. Yesterday's low of 81.68 came within two pennies of testing key gap support at 81.66, which is why it was alerted. The reward to risk is excellent, but we'll honor our stop if selling in the overall market accelerates.
BRKS (-2.11%) - reports earnings on February 3. Semiconductors ($DJUSSC) are under particular pressure today. While BRKS is outperforming its peer index, it's currently beneath our closing stop of 41.50. Unless it recovers by the close, we'll exit. If BRKS doesn't recover, there'll be plenty of opportunities ahead in semiconductors.
Movers and Shakers
I reviewed the worst performing stocks today on our major indices, looking for stocks that could be poised for reversals. Here were a couple worth considering:
LNC:
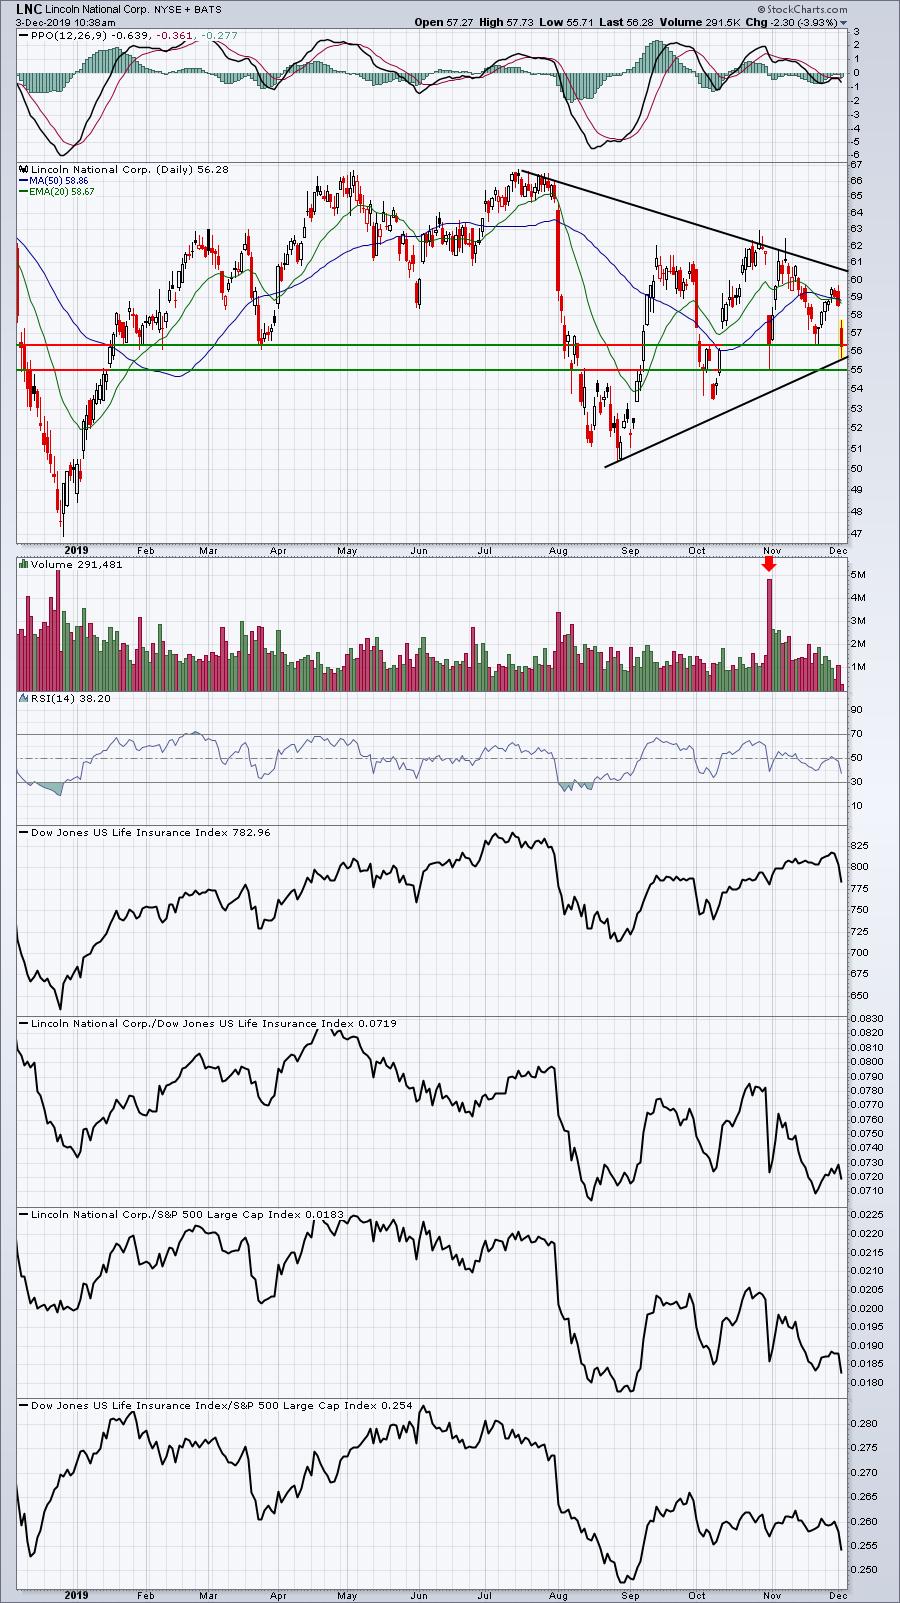
LNC saw a huge volume gap lower at the end of November and may have printed an important low that day. Today's selling has been intraday beneath the two most recent closing lows. A reversal and close back above 56.50 could be a bullish short-term signal.
DLTH:
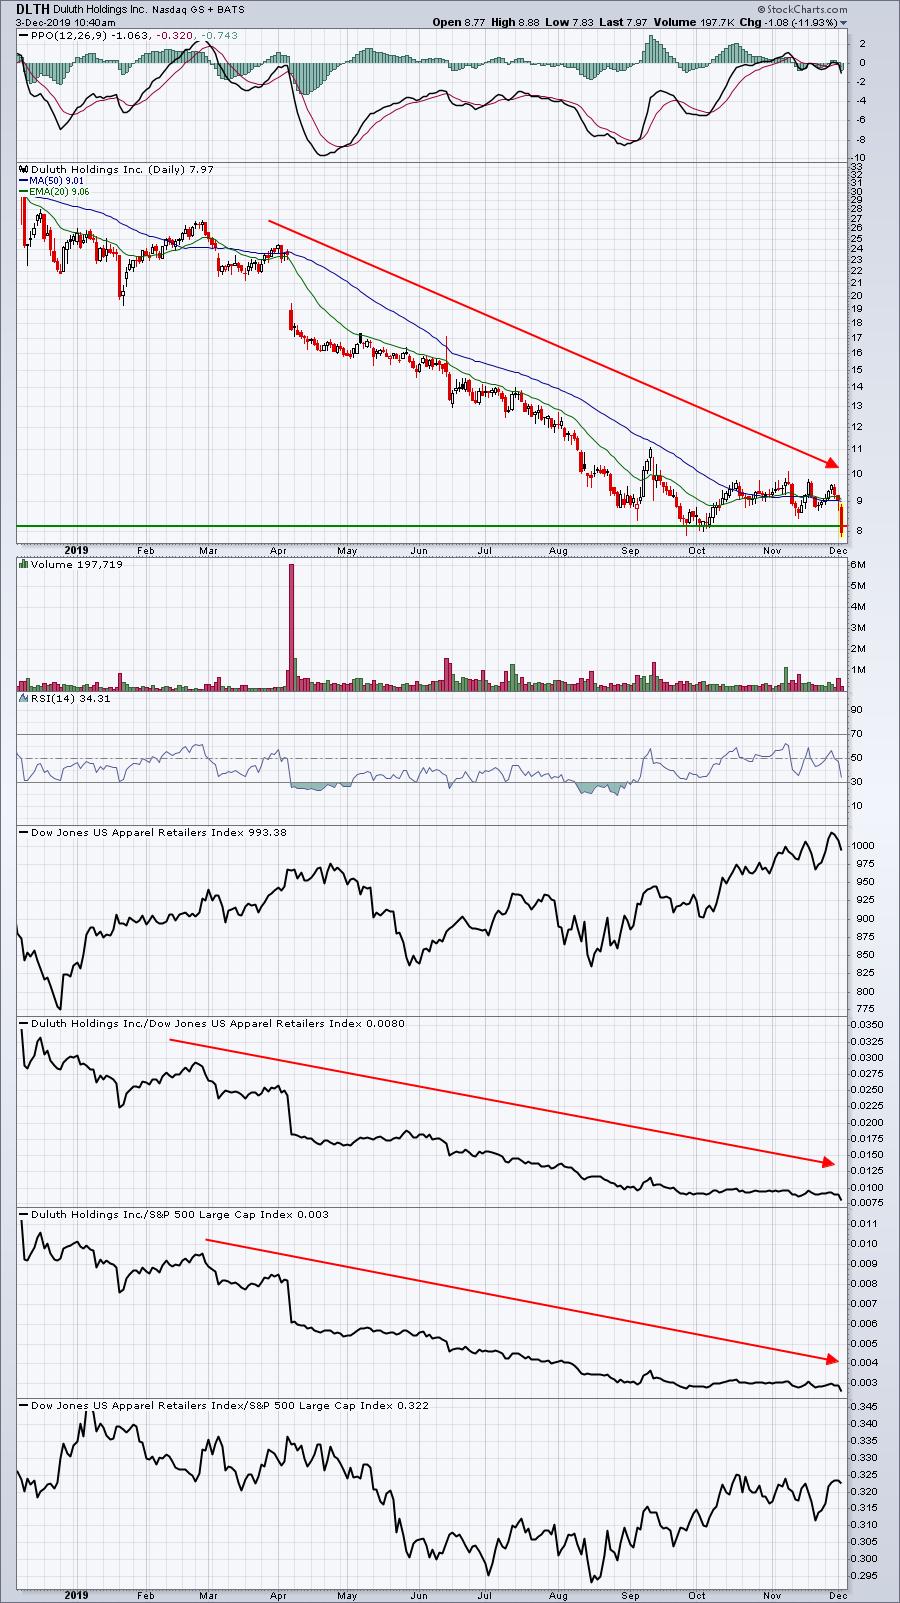
DLTH could be printing a double bottom today, but I'd prefer to see DLTH close above 8.20 today as that's the lowest candle body on the chart.
Make no mistake here, I'm not bullish the long-term charts at all. I'd simply look for very quick bounces to take advantage of from a trading perspective. And I'd keep very tight stops in place. These are not leaders quite obviously.
Earnings Reports
Here are the key earnings reports for this week, featuring stocks with market caps of more than $5 billion. I also include a few select companies with market caps below $5 billion. Finally, any portfolio stocks (or active trade alerts) that will be reporting results are highlighted in BOLD. Please make sure you check for earnings dates for any companies you own or are considering owning:
Tuesday, December 3:
CRM, BMO, WDAY, MRVL, DCI, ZS. Others less than $5 bil: HQY, AVAV
Wednesday, December 4:
RY, SNPS, CPB, WORK, FIVE, ESTC, SMAR. Others less than $5 bil: HRB, RH, VRNT, GIII
Thursday, December 5:
TD, DG, CM, BF.B, KR, ZM, TIF, COO, OKTA, ULTA, CRWD, DOCU, GWRE. Others less than $5 bil: SAIC, CLDR, ZUO, ZUMZ
Friday, December 6:
None
Economic Reports
None
Happy trading!
Tom