
EB Daily Market Report - Wednesday, December 4, 2019
Executive Market Summary
- Futures were much stronger today, despite a lower-than-expected ADP employment number
- The Dow Jones has recovered much of what it lost at Tuesday's intraday low
- The S&P 500 is testing gap resistance - see the Market Outlook below for a visual
- Energy (XLE) is strong today, behind rising crude oil prices; crude is up 4% to $58.34 per barrel
- U.S. crude oil inventories were much lower than expected
- Financials (XLF) and industrials (XLI) also strong today as the 10 year treasury yield ($TNX) rebounds
- Our lone alert is TPX, which is bouncing today
Market Outlook
On a very short-term basis, it appears that our major indices have topped - at least until we can push to fresh all-time highs. The negative divergences discussed the past few days remain in play. Therefore, let's look at an hourly S&P 500 chart to find potential reversal areas:
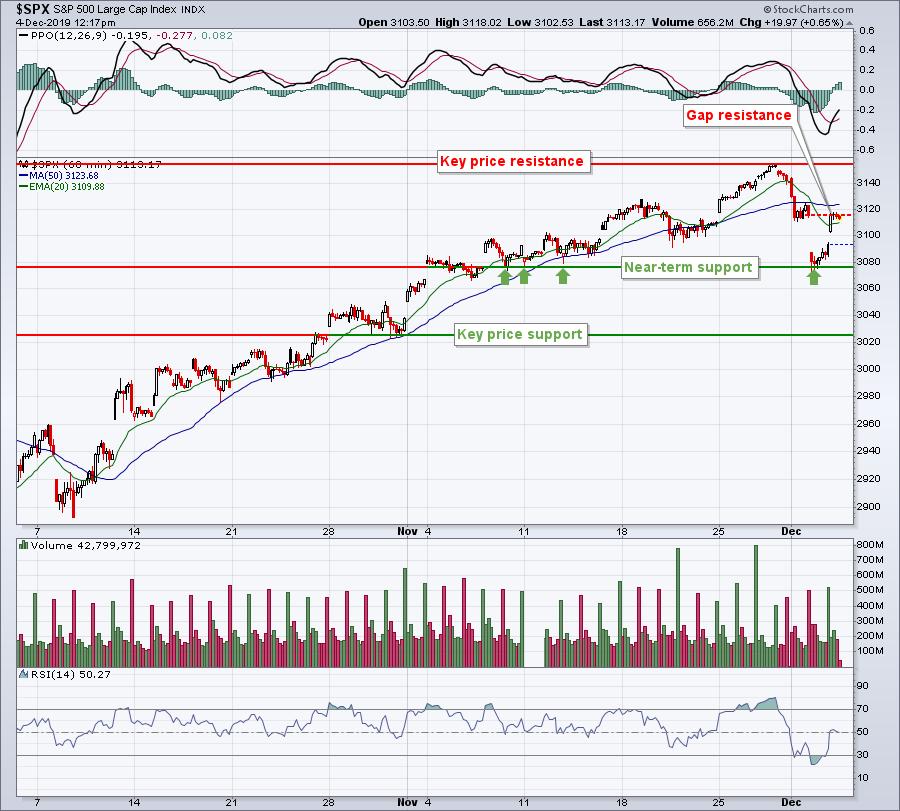
We've now had several reversals from just beneath 3080 so that's clearly a level we want to watch. It's also the low we just saw yesterday. Failure to hold that low would more than likely lead to another key test near 3025. That would be much more technically-significant as the 50 day SMA is now at 3036. Remember, daily negative divergences many times lead to 50 day SMA tests, so we can't rule out that possibility. I believe a lot of buyers would step in at that point, if we get there.
In the meantime, an intraday move higher above 3125 would likely lead to more bullish short-term action.
Sector/Industry Focus
Apple, Inc. (AAPL) has become very stretched on its daily chart, so it's worth pointing out that computer hardware stocks ($DJUSCR) in general tend to struggle during the month of December. Check out the seasonality for the DJUSCR:
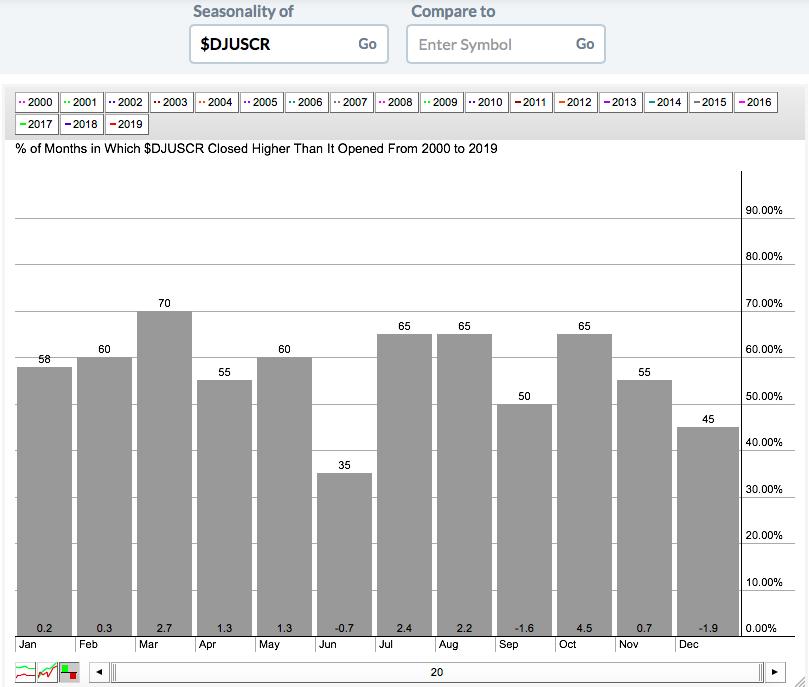
December is one of the worst months for this industry, producing average returns of -1.9% over the past two decades. Taking profits in this space and looking to re-enter at a lower level wouldn't be a horrible strategy.
Strong Earnings ChartList (SECL)
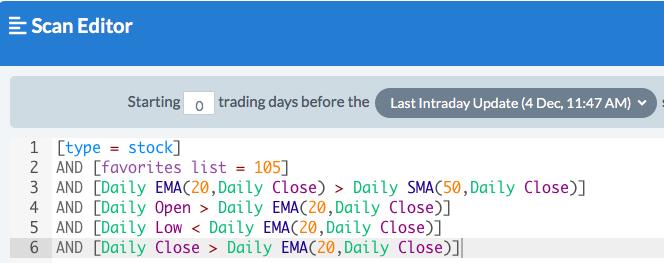
I ran a scan of SECL stocks that opened above the 20 day EMA, are currently above the 20 day EMA, but have an intraday low beneath the 20 day EMA. Here is the scan code that I used:
19 of the 325 SECL stocks were returned and here they are:
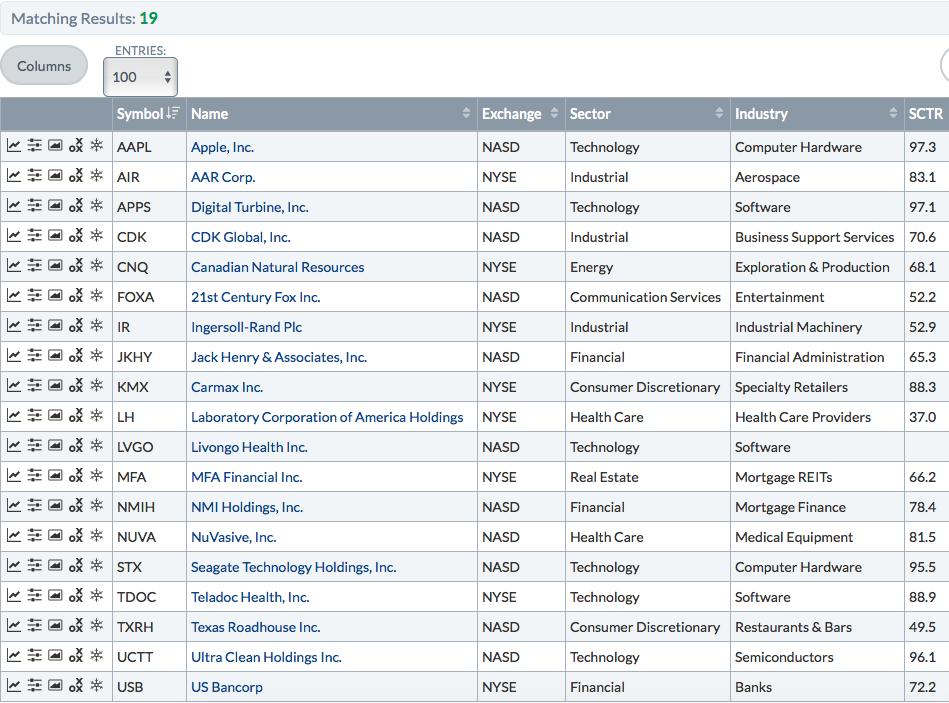
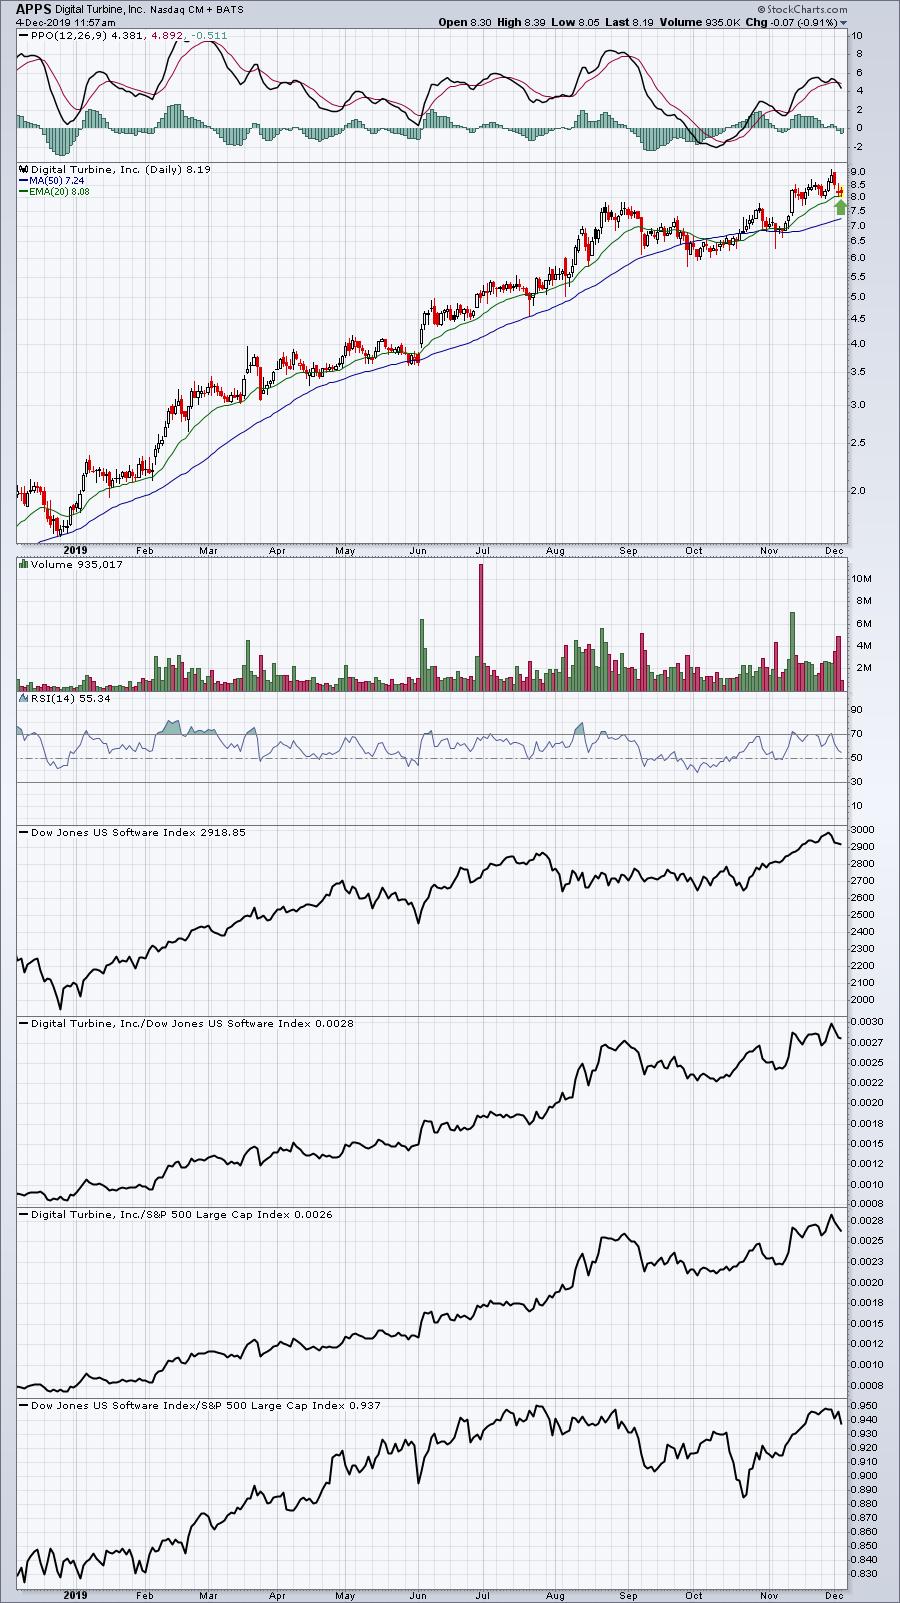
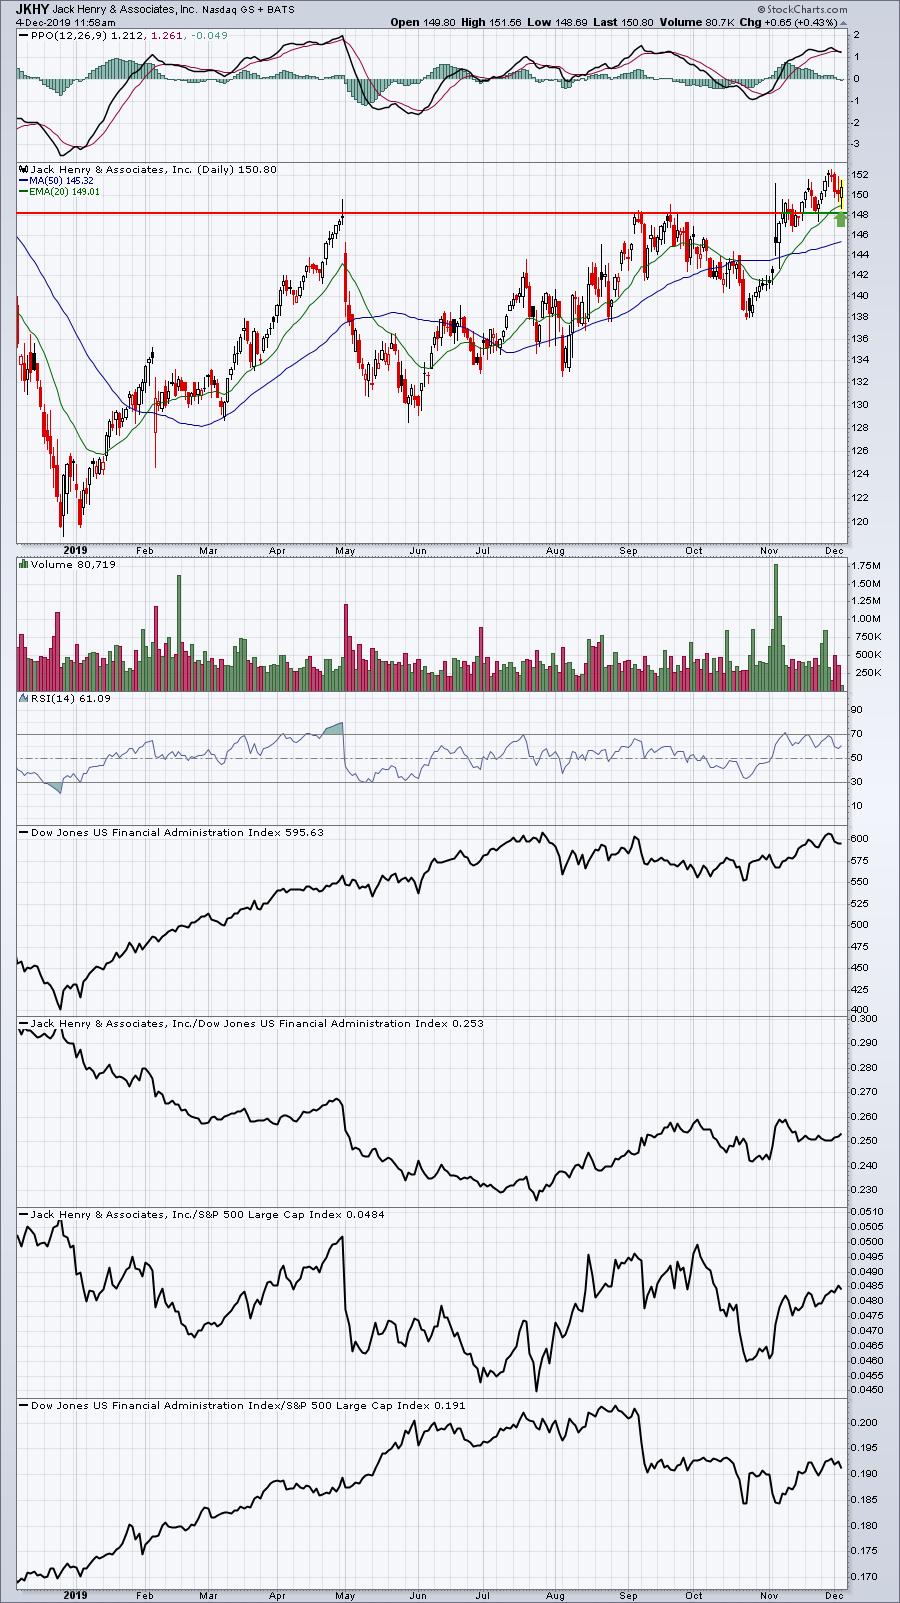
The idea behind this scan is that many uptrending stocks will pullback and print a low beneath their rising 20 day EMAs, and then bounce. Here are three from the list above that would be attractive trade candidates based on the recent selling :
APPS:
JKHY:
TXRH:
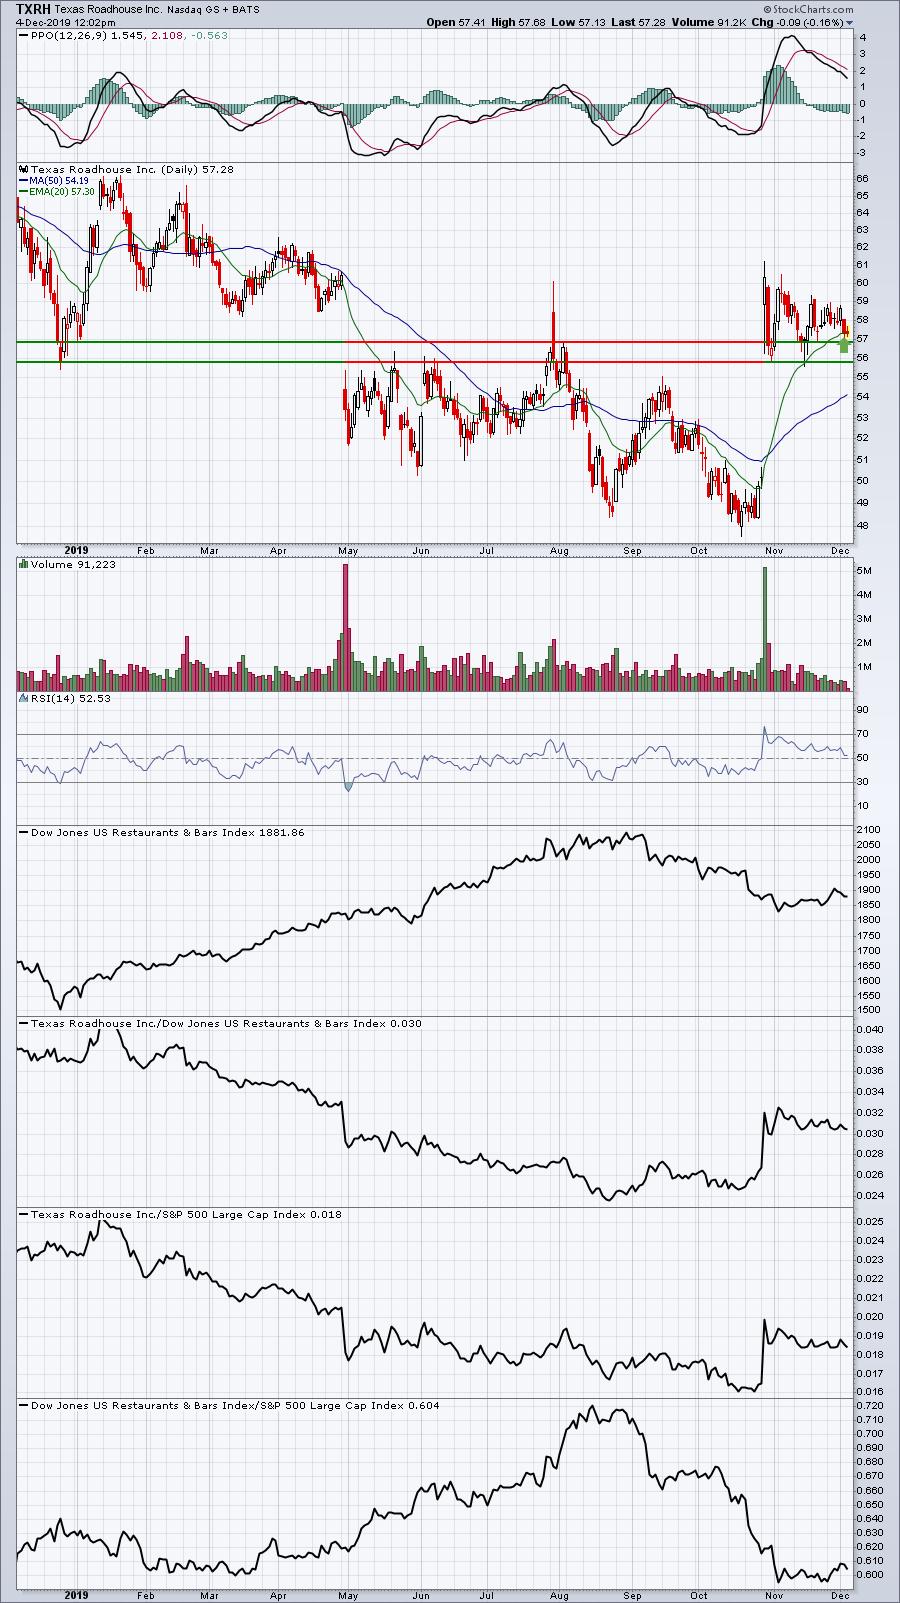
To strictly follow this trading strategy, you're looking for stocks to bounce off their 20 day EMA, not close beneath it. Therefore, a close below the 20 day EMA, unless justified by another technical indicator (most likely price support), would trigger a sell. A return to recent highs could be a sell point for a short-term trade.
Active Trade Alerts
We have one active trade alert after adding both TPX and BRKS earlier this week, then seeing BRKS stop out at Tuesday's close. The overall market performance didn't help these trades, but negative divergences is one reason why keeping fairly tight stops in play makes sense for now. Here's a quick summary of today's action in each:
TPX (+1.19%) - reports earnings on February 12. TPX bounced a bit yesterday afternoon, though it was a down day. It's trying to rally this morning. A close back above 84.25, currently the 20 day EMA, could ignite the rally I'm looking for.
BRKS (-2.11%) - reports earnings on February 3. BRKS stopped out on us yesterday. We wanted to keep a very tight stop on any alerts because stocks are currently subject to more potential downside with negative divergences on daily charts across many indices, sectors, industry groups and individual stocks. We can always handle and recover from small losses, but we don't want to get caught up in larger losses. BRKS was caught up in the semiconductor ($DJUSSC) selling. While we were stopped out on Tuesday's close, here's a chart with another support line to watch if you're still holding:
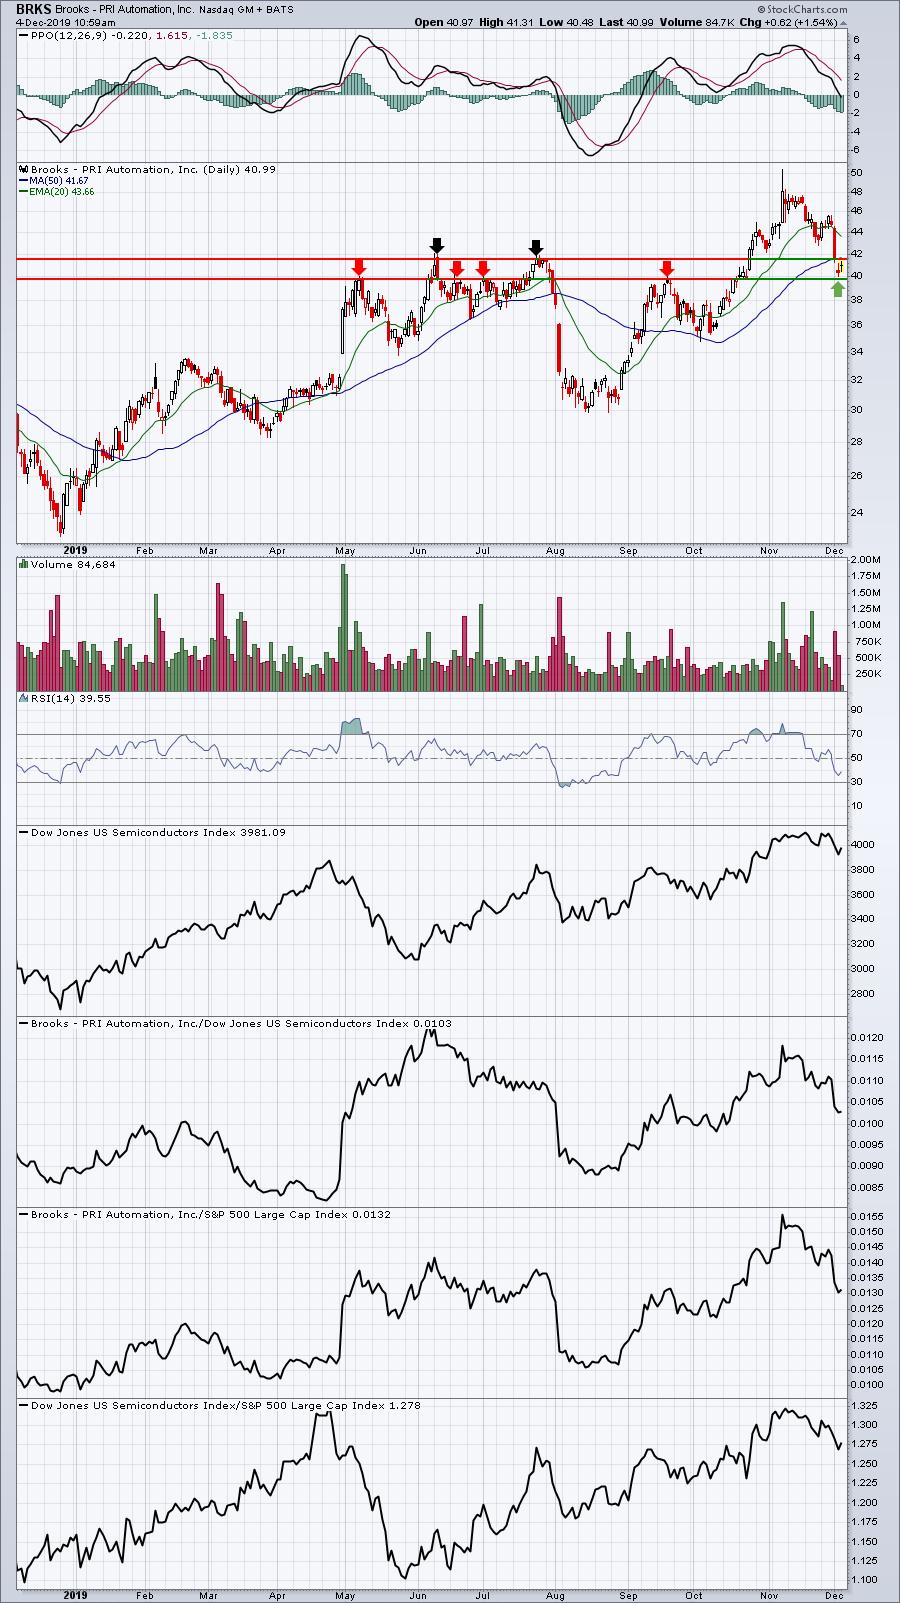
The black arrows mark double top price resistance that we cleared in October. That, along with the rising 50 day SMA, was what I expected to hold as support. The red arrows marked plenty of highs in the 39.50-40.00 area, which seemed to hold at yesterday's intraday low (green arrow). If I was still in BRKS and wanted to give it a bit more room, the 39.50-40.00 area would be the logical support level to watch.
Movers and Shakers
I checked out the SCTR movers at StockCharts.com and found the following chart to be quite interesting:
ETM:
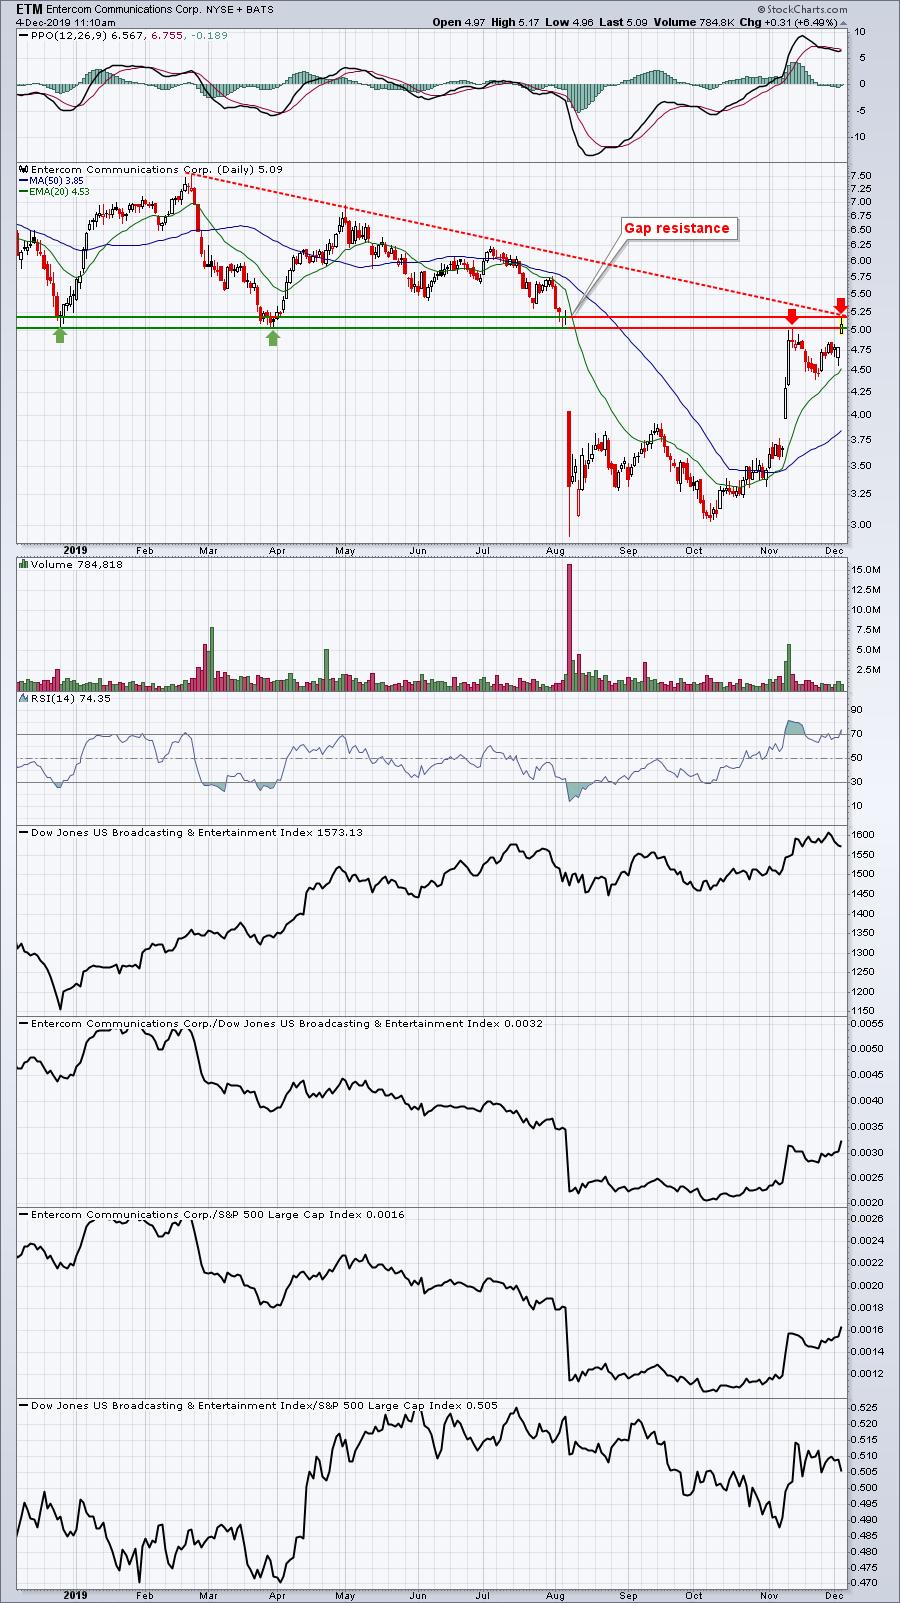
There's plenty of congestion on this chart between 5.00-5.25. Volume is accelerating, so a breakout above 5.25 would be more meaningful because of it.
Earnings Reports
Here are the key earnings reports for this week, featuring stocks with market caps of more than $5 billion. I also include a few select companies with market caps below $5 billion. Finally, any portfolio stocks (or active trade alerts) that will be reporting results are highlighted in BOLD. Please make sure you check for earnings dates for any companies you own or are considering owning:
Wednesday, December 4:
RY, SNPS, CPB, WORK, FIVE, ESTC, SMAR. Others less than $5 bil: HRB, RH, VRNT, GIII
Thursday, December 5:
TD, DG, CM, BF.B, KR, ZM, TIF, COO, OKTA, ULTA, CRWD, DOCU, GWRE. Others less than $5 bil: SAIC, CLDR, ZUO, ZUMZ
Friday, December 6:
None
Economic Reports
November ADP employment report: 67,000 (actual) vs. 150,000 (estimate)
November PMI services index: 52.0 (actual) vs. 51.9 (estimate)
November ISM non-manufacturing index: 53.9 (actual) vs. 54.5 (estimate)
Happy trading!
Tom