
EB Daily Market Report - Thursday, December 5, 2019
Executive Market Summary
- Futures were strong for a second straight day, but selling has become a bit more prevalent today after that early strength
- Initial jobless claims were reported at 203,000, the lowest level in 7 months
- The 10 year treasury yield ($TNX) is up 2 basis points to 1.80%
- Financials (XLF) and materials (XLB) are the leading sectors, while consumer stocks lag
- Nike (NKE) and Apple (AAPL) were both higher on analyst actions
- Our lone alert is TPX, which is higher today
Market Outlook
I remain a big fan of small caps ($SML). I may change my tune, but I fully expect that 2020 will be the year of the small cap. Short-term, I'd have to reconsider if key support is lost on both an absolute and relative basis, so watch these levels:
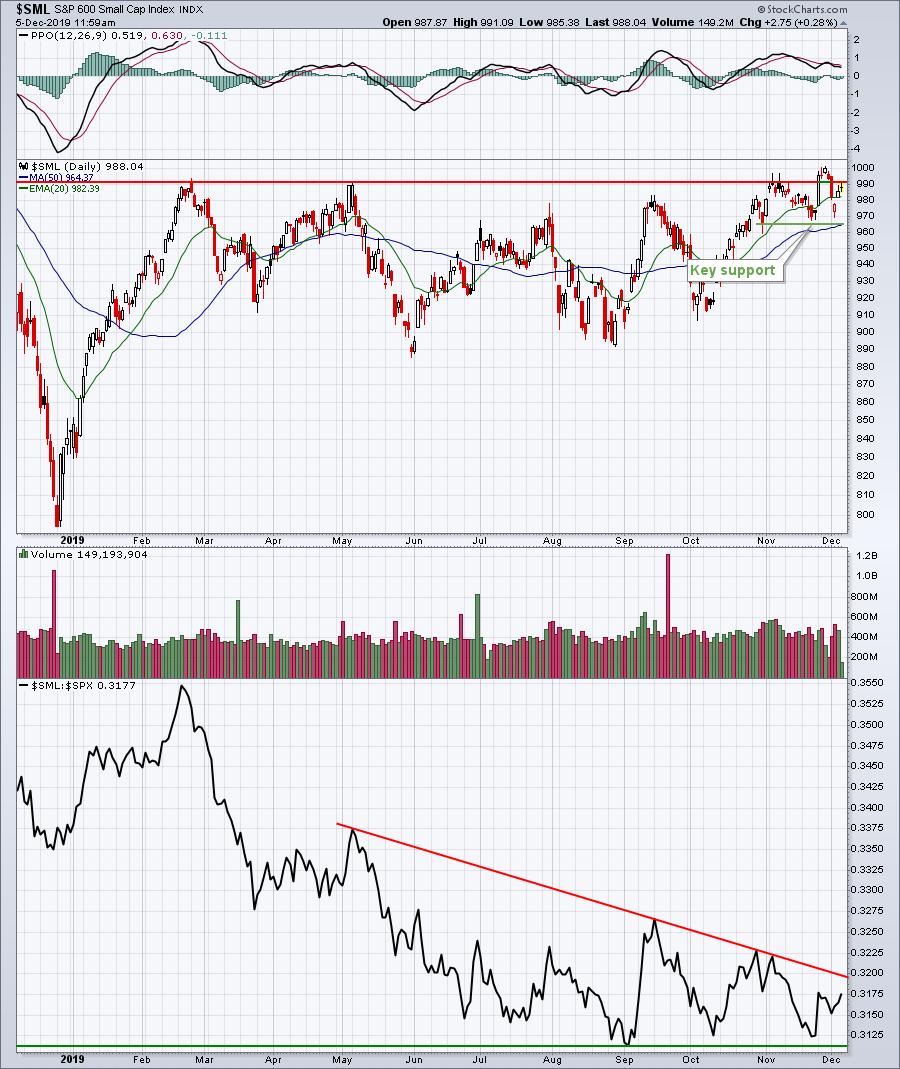
The bottom panel is critical. Relative support really needs to hold here, while a breakout above that relative downtrend line would be the initial bullish confirmation I'm looking for.
Sector/Industry Focus
Financials (XLF) are leading today's action and the group has been very strong since the October low. We've seen one key industry group after another break out. Consumer finance ($DJUSSF) is next in line:
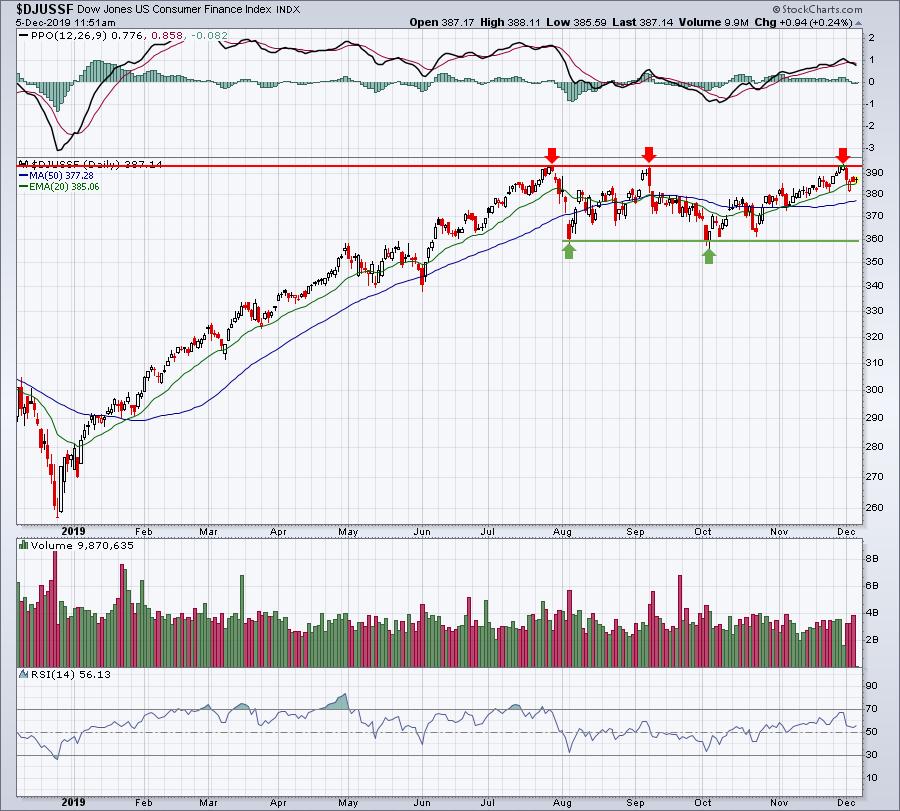
If you own stocks in this space, a breakout would be of huge benefit. I like the way the DJUSSF continues bouncing each time it hits its rising 20 day EMA support. That's how uptrending charts behave, but we're still in need of the breakout.
Strong Earnings ChartList (SECL)
I write a Weekly Portfolio Report every Sunday, but that doesn't mean we should ignore them as potential trading candidates. Honestly, most of my trades come from these portfolios. They represent 40 of my favorite stocks on the SECL. At the time of release on November 19th, many of these stocks were overbought, although figuring out which one will pull back at any given time is difficult, to say the least. But when they do pull back, we need to be ready for a trade. Price support and rising 20 day EMAs are probably the two easiest types of trades to visualize.
Here are a few charts to illustrate both strategies:
HEES:
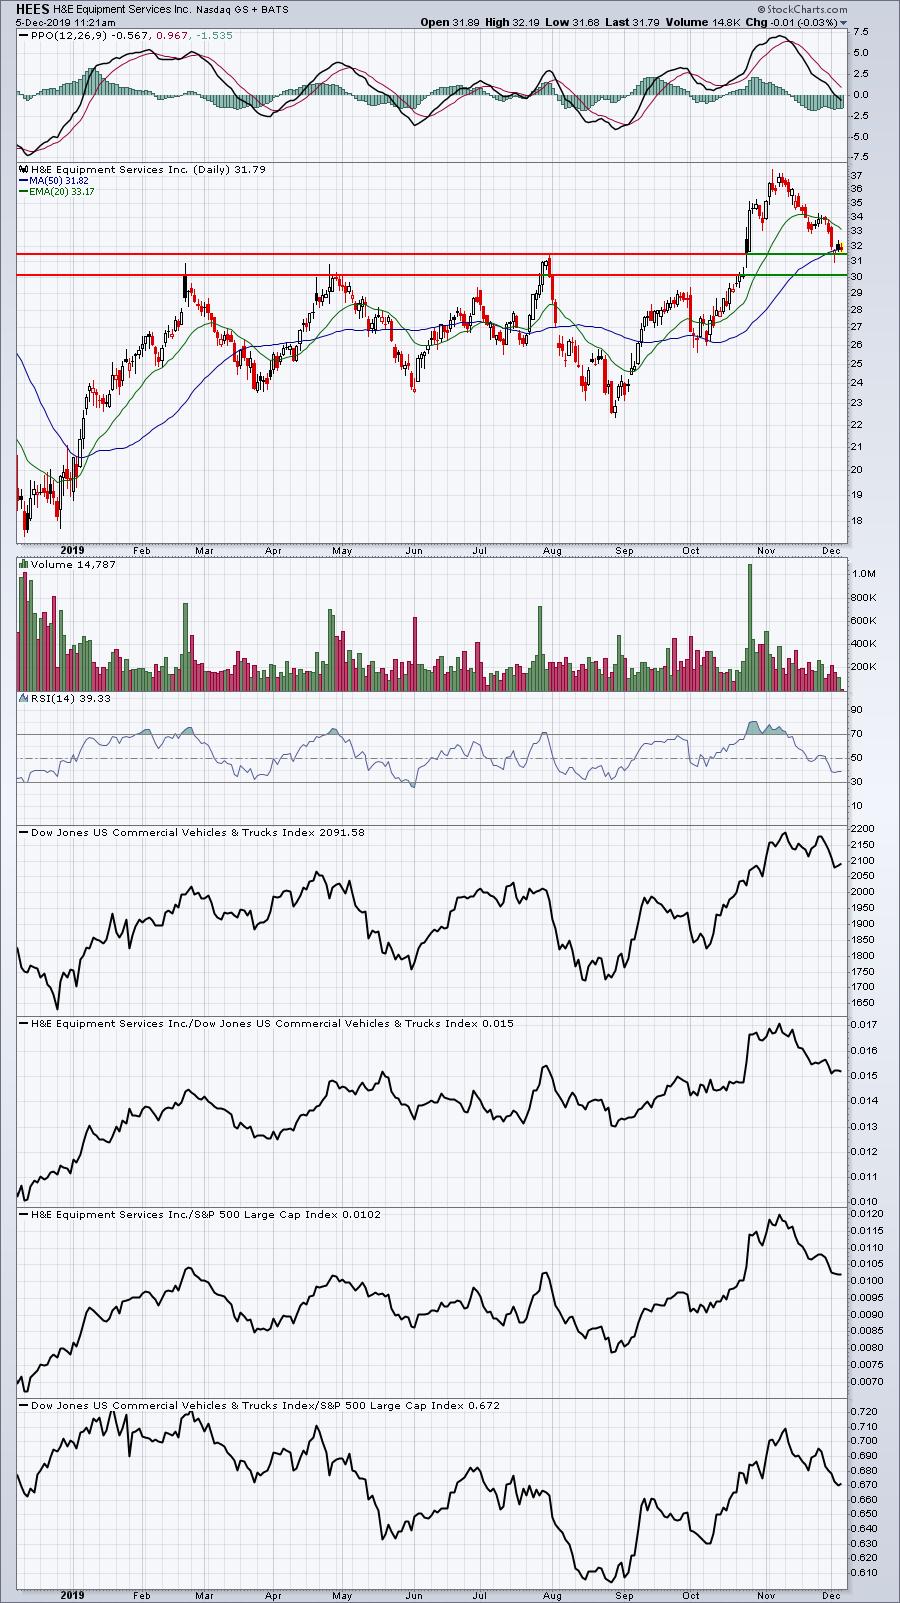
Listen, there are no guarantees. That's not what this exercise is all about...or even what EarningsBeats.com is all about. It's about having patience to enter trades with more upside potential than downside risk. HEES is at a much better area on the chart to build a position now. RSI is down near 40, which can be an excellent time to enter an uptrending stock. And with trading commissions now at zero at many online brokers, why not build a position in the "accumulation zone". You can enter a few different price levels with no commissions.
CROX:
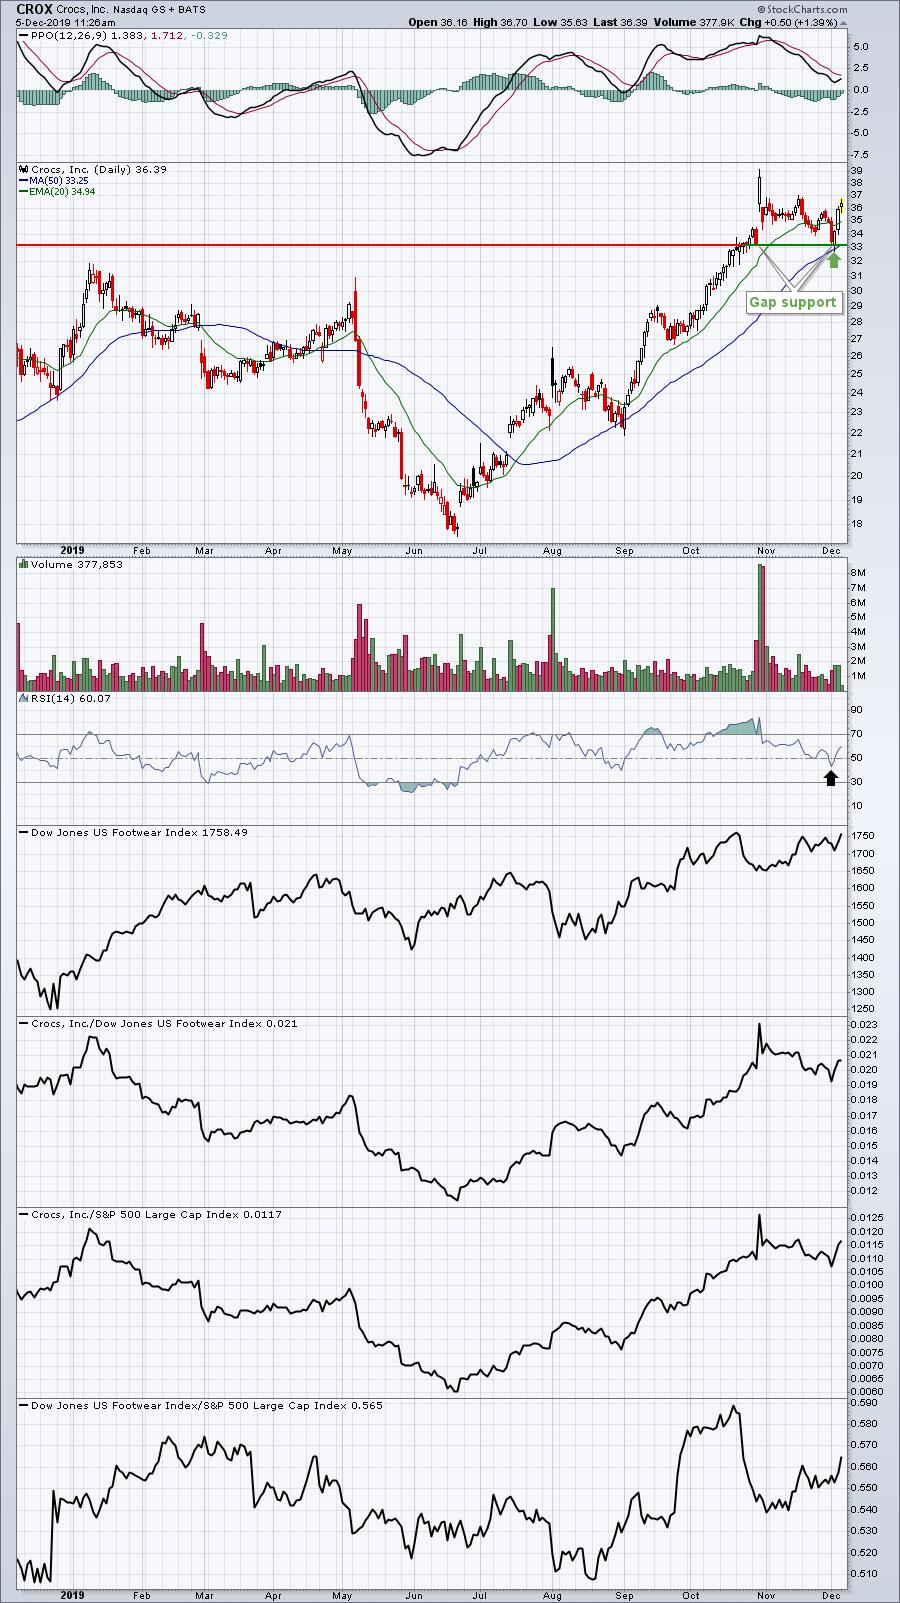
In this example, CROX fell below its 20 day EMA, but held beautifully at gap support from earnings. Note that the RSI had also fallen back well into the 40s.
RAMP:
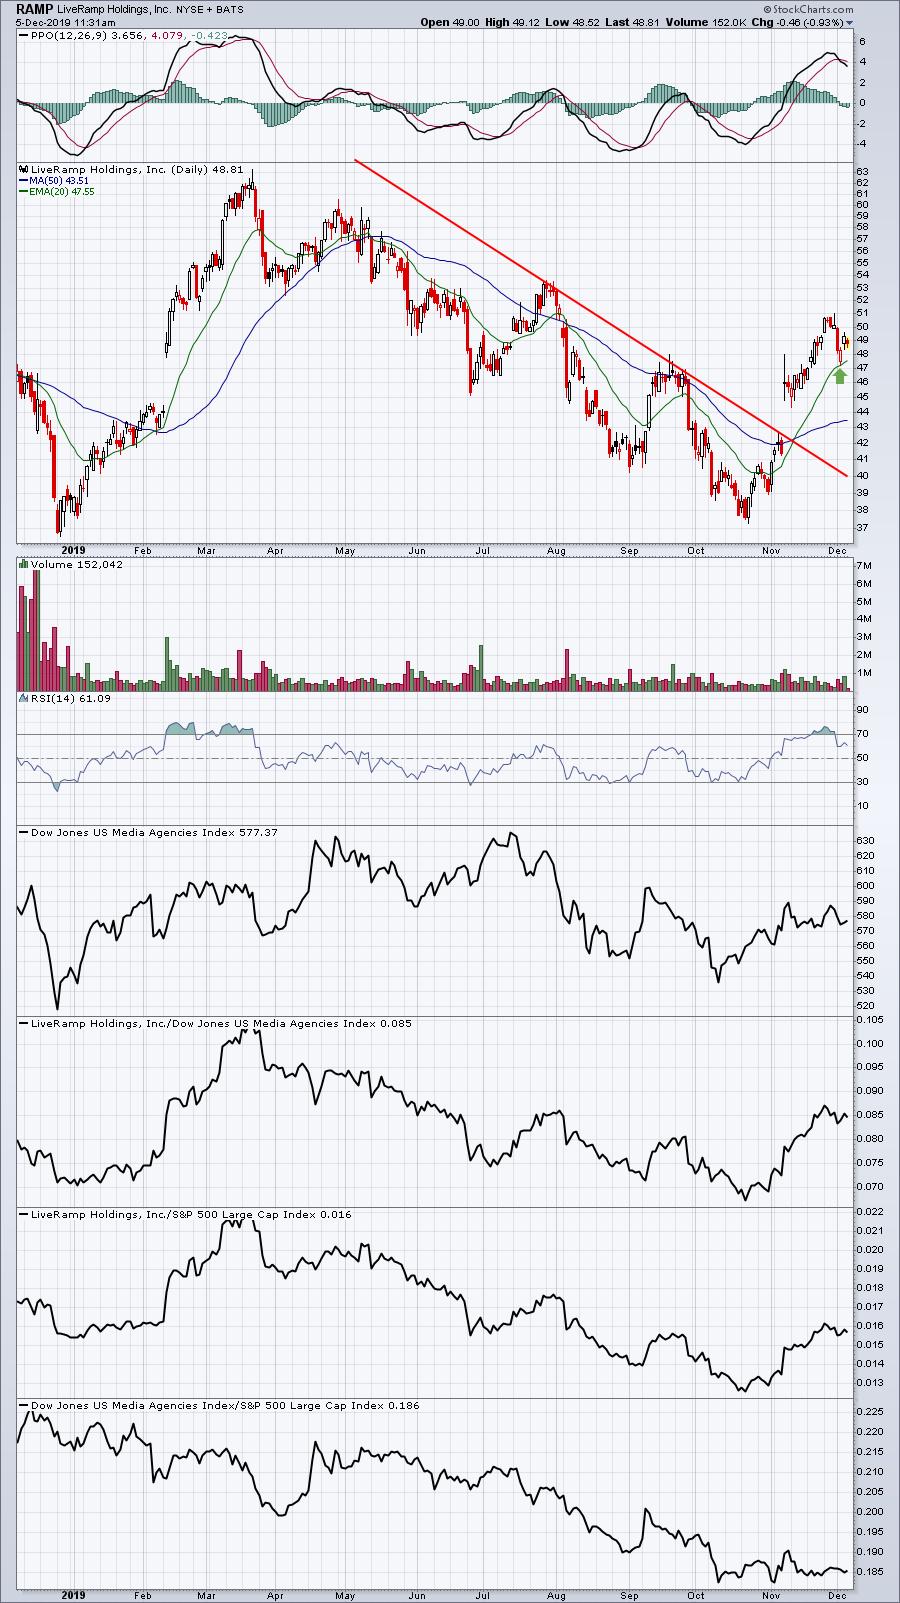
RAMP was added to the Value Portfolio as a turnaround, "change of character" candidate. Well, if it's truly beginning to uptrend, it should hold that rising 20 day EMA on its first attempt. It did that, but as a trader, you need to be ready to buy at the 20 day EMA, not after it bounces.
GTN:
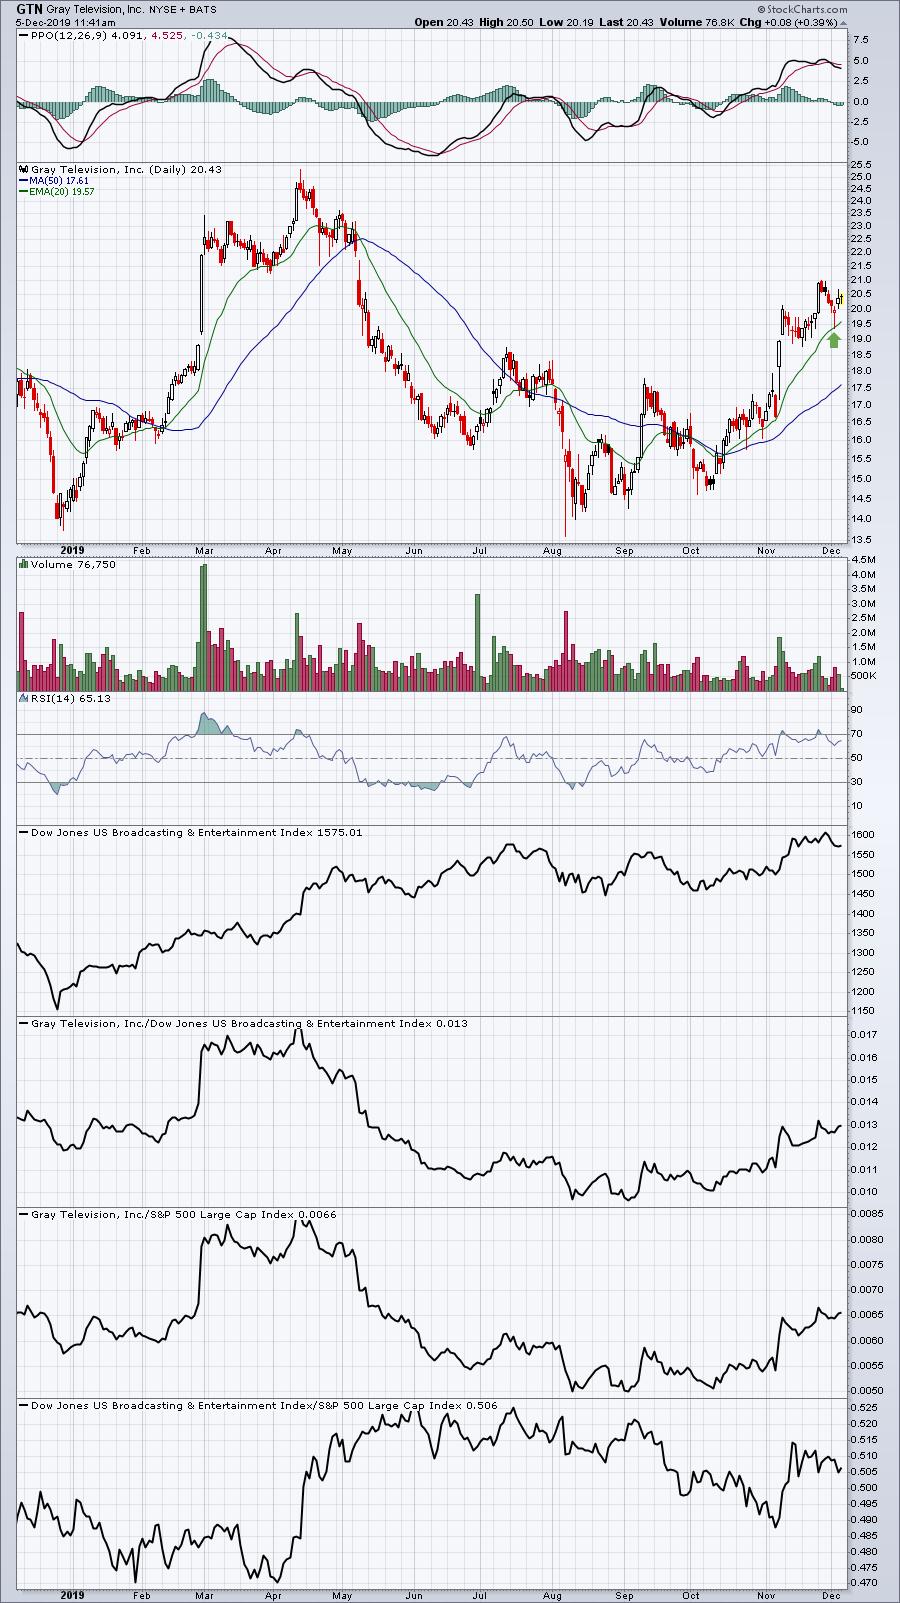
GTN is just another example of how buyers will emerge many times on that very first 20 day EMA test.
Active Trade Alerts
We have one active trade alert currently:
TPX (+0.50%) - reports earnings on February 12. TPX is edging higher this morning and distancing itself from major gap support at 81.86. The 20 day EMA is currently 84.29. A close above that level would be a great start toward meeting our objective here.
Movers and Shakers
I looked at the most active stocks on the S&P 500 and wanted to provide updates on two in particular that are also Dow Jones components:
CSCO:
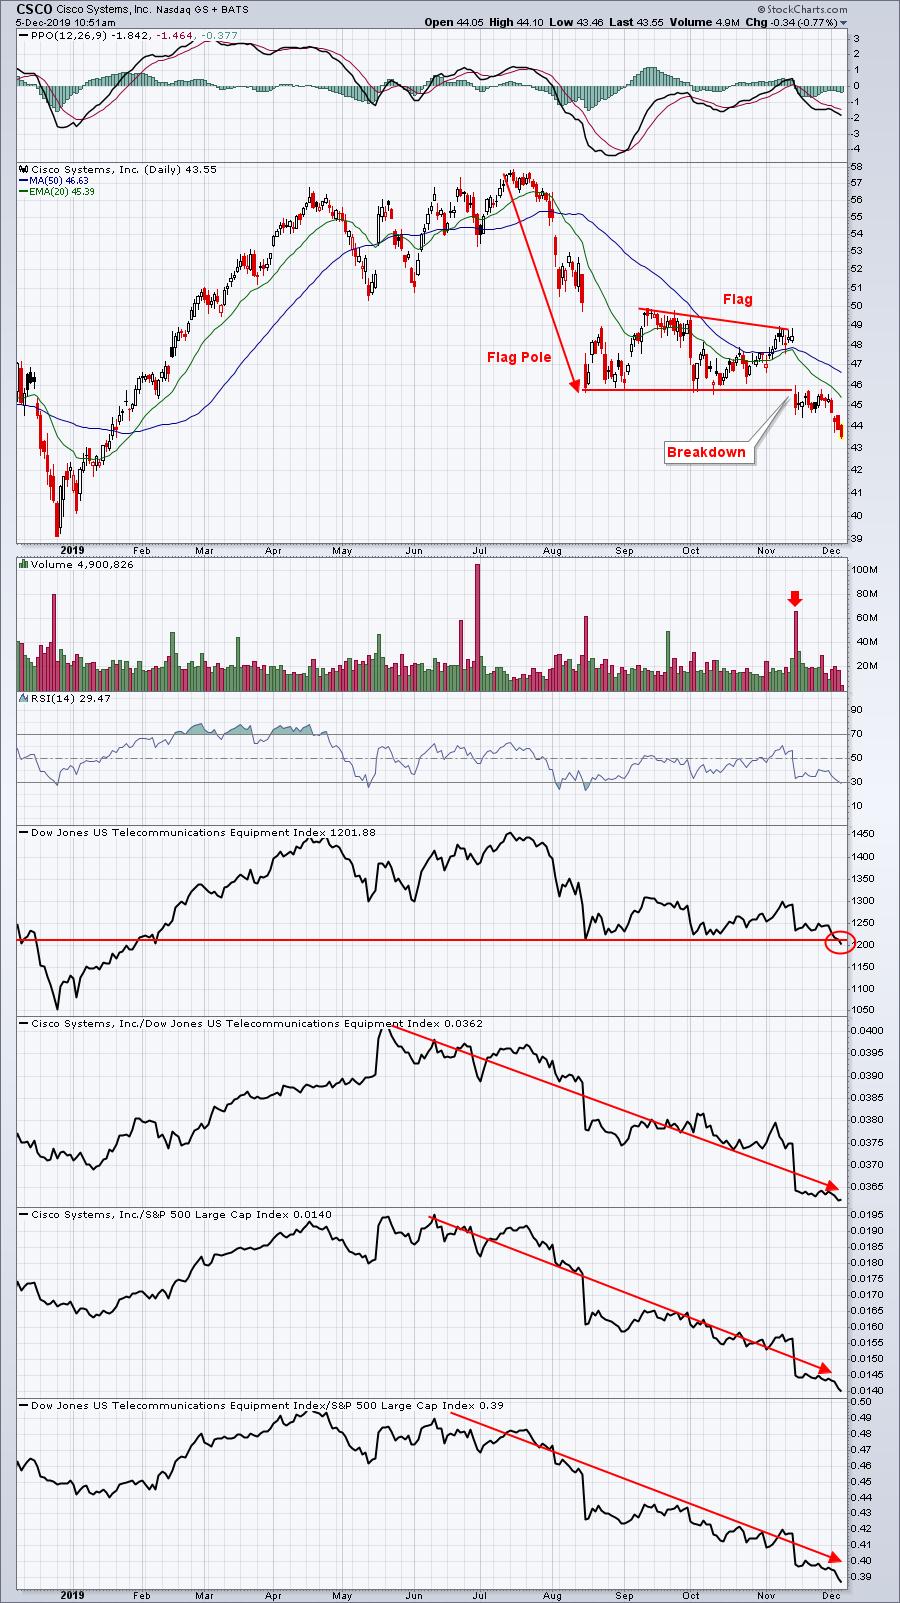
Try to explain one thing that looks good on CSCO. I dare you! Bearish flag pattern (or bearish descending triangle) broke down on very heavy volume. It's part of one of the worst industry groups - telecom equipment ($DJUSCT) - and its one of the worst telecom equipment stocks, now at a 52 week relative low. Volume trends are awful. Stay the heck away.
KO:
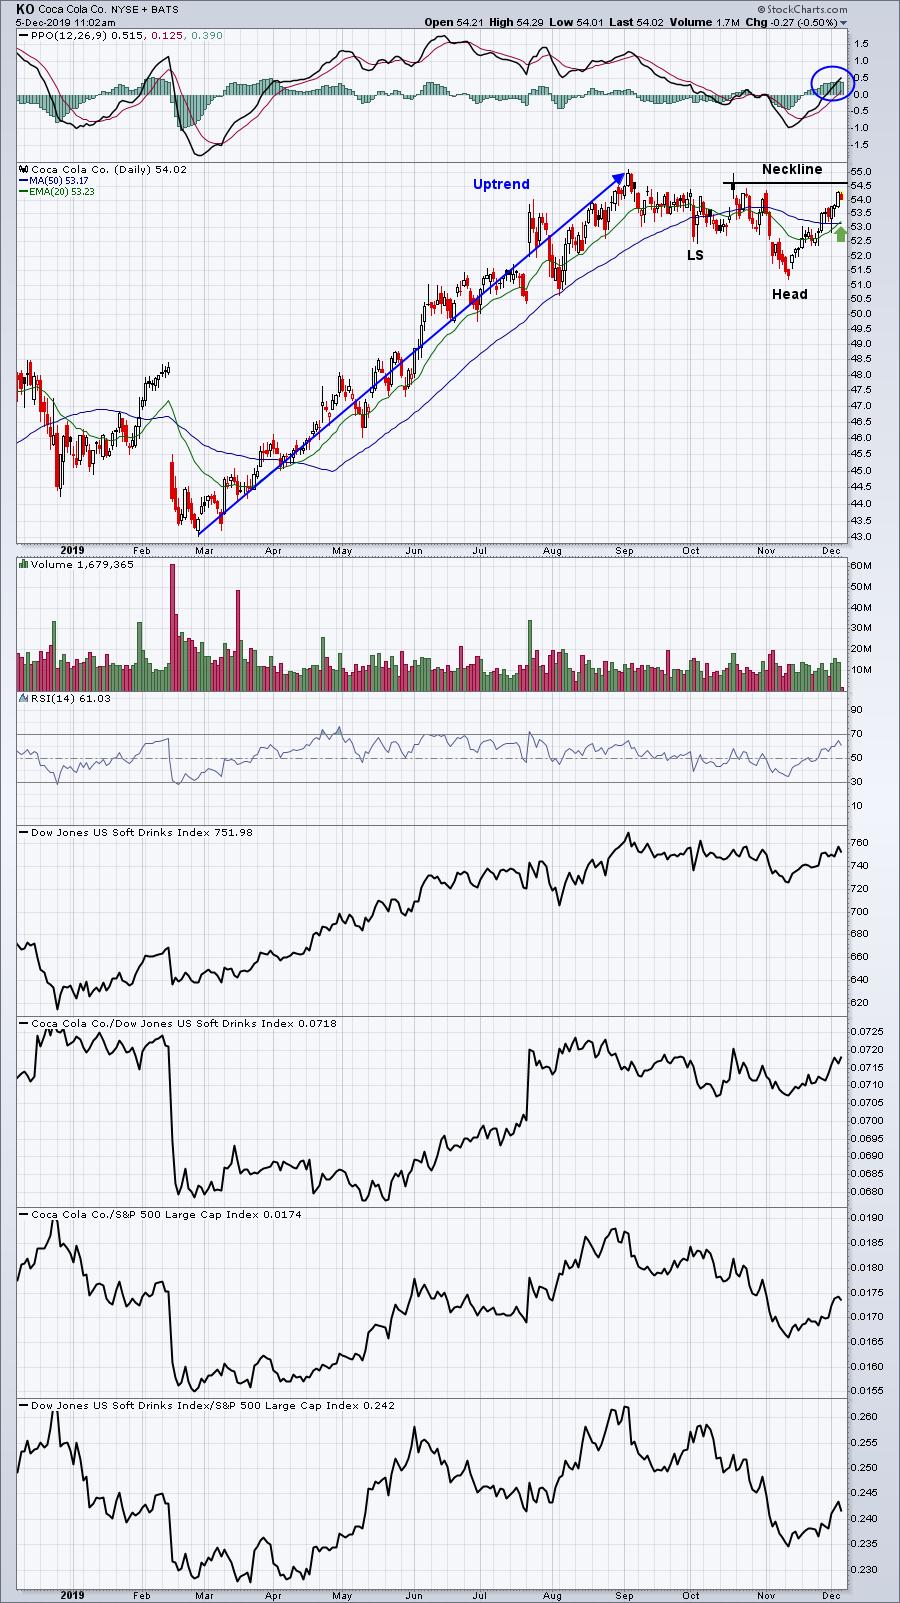
KO is a much better looking chart. We could be approaching neckline resistance, however, so be on the lookout for a reversing candlestick in the 54.50-55.00 range. I've inserted a green arrow near the rising 20 day EMA. A pullback to test that moving average would provide solid entry into a stock that's showing relative strength since its relative double bottom in May.
Earnings Reports
Here are the key earnings reports for this week, featuring stocks with market caps of more than $5 billion. I also include a few select companies with market caps below $5 billion. Finally, any portfolio stocks (or active trade alerts) that will be reporting results are highlighted in BOLD. Please make sure you check for earnings dates for any companies you own or are considering owning:
Thursday, December 5:
TD, DG, CM, BF.B, KR, ZM, TIF, COO, OKTA, ULTA, CRWD, DOCU, GWRE. Others less than $5 bil: SAIC, CLDR, ZUO, ZUMZ
Friday, December 6:
None
Economic Reports
Initial jobless claims: 203,000 (actual) vs. 218,000 (estimate)
October factory orders: +0.3% (actual) vs. +0.3% (estimate)
Happy trading!
Tom