
EB Daily Market Report - Wednesday, December 11, 2019
Executive Market Summary
- U.S.-China trade has been in the news, but the stock market doesn't seem to be nearly as concerned now as it was throughout 2018 and earlier in 2019
- We have bifurcated action today with the S&P 500 and NASDAQ higher, while the Dow Jones and Russell 2000 are slightly lower
- The Federal Reserve will announce its latest policy statement at 2pm EST today; look for no change in rates
- Inflation at the consumer level was released this morning and was mostly in-line with expectations
- Materials (XLB) showing leadership today among sectors, while real estate (XLRE) lags
- Dow Jones is weak today primarily due to selling in both Home Depot (HD) and Boeing (BA)
- Our alert TPX continues to hover near its key 20 day EMA support
Market Outlook
Yesterday, I showed a 5 day, 10 minute chart of the S&P 500 and highlighted a possible short-term down channel. Price action today moved slightly above that level, but that really doesn't change my opinion that we could simply base and consolidate in a fairly narrow range until we move into the second half of the month. The hourly chart is showing movement above and below the 20 hour EMA. Failing to hold 20 period EMA support is a definite sign of a trendless market:
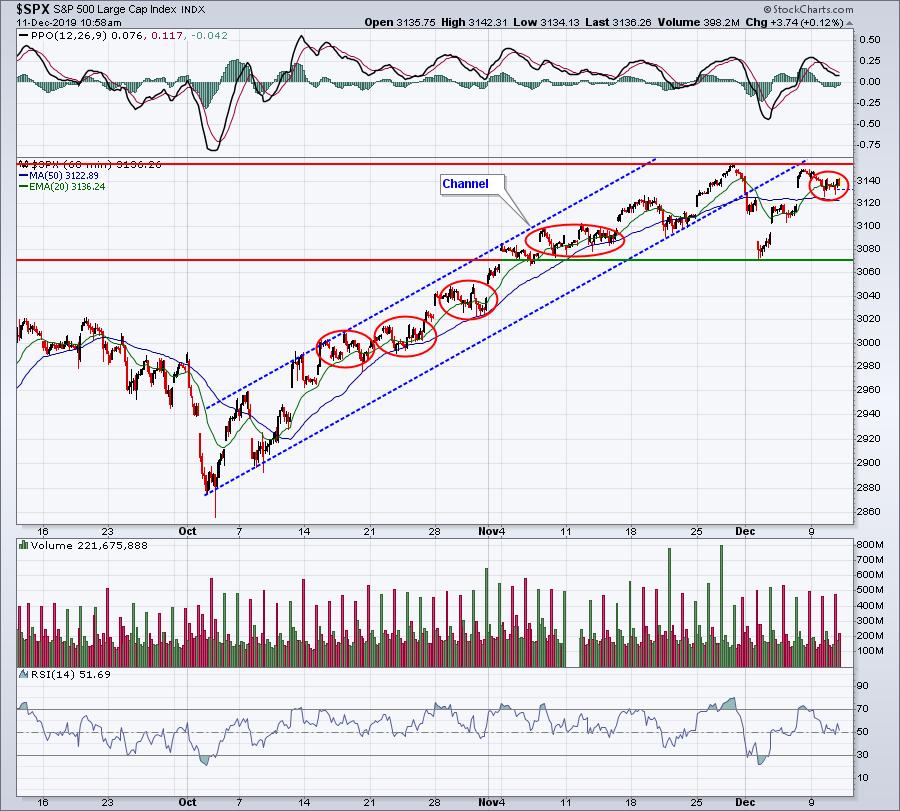
The biggest difference between the current consolidation period and other consolidation periods (red circles) over the past 10 weeks is that all of those prior periods were contained within an overall uptrend. Now we're seeing very short-term consolidation within a period of sideways action that began to open December. We're fine watching the action on this hourly chart until we see either (1) a break above price resistance at 3154.26 or (2) a break beneath price support at 3070.33. So our current range is 3154.26-3070.33. That's only a 2-3% range, not really a big deal in the longer-term scheme of things.
Sector/Industry Focus
On the surface, basic materials (XLB) appears to be a great sector to look for trading opportunities. It's broken to new highs recently and is absolutely in an uptrend. But once again, it doesn't meet the relative strength test. The XLB:SPX relative strength line is testing major multi-month support:
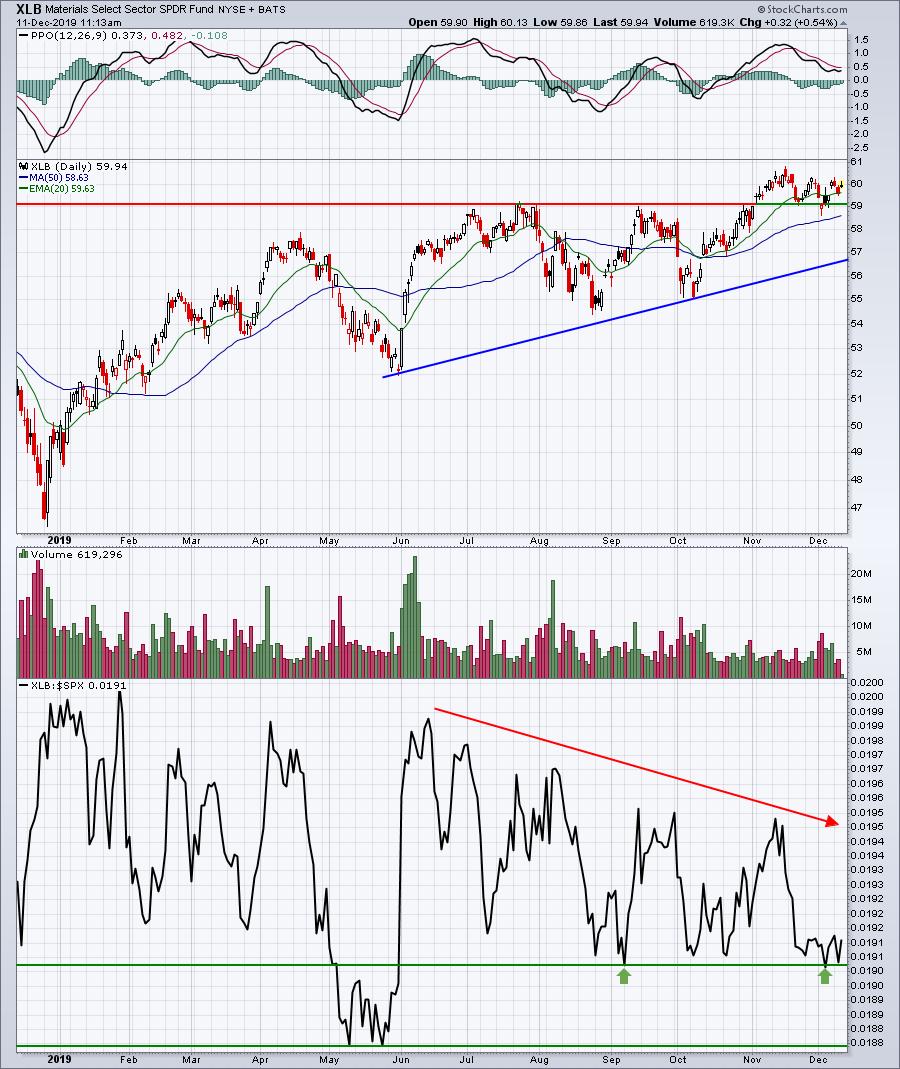
This chart doesn't suggest that we can't trade materials stocks, but it's going to be harder to find relative winners in a sector that isn't yet showing relative strength. The big problem with the XLB is U.S. dollar strength. From the long-term chart below, you can see that when the USD is rising, there are headwinds that the XLB must negotiate....and it generally fails:
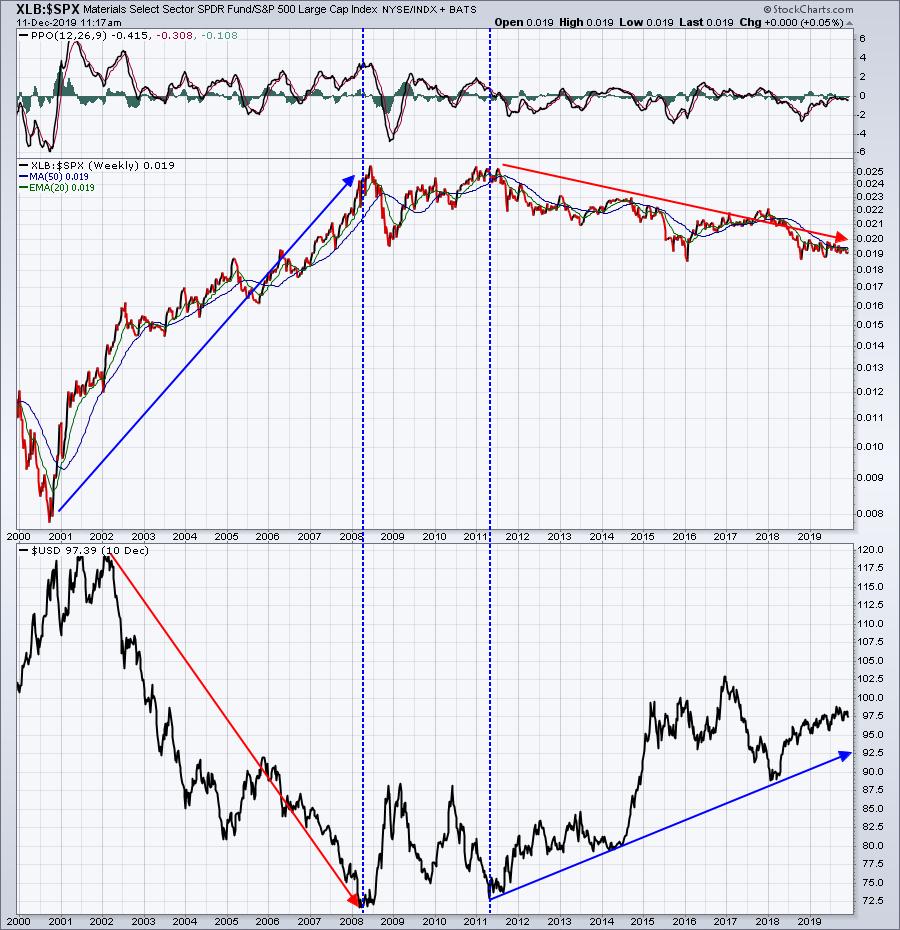
I think the above chart illustrates exactly what I'm talking about. Having said this, though, I do believe that the USD could struggle a bit during 2020 and, if so, that would open the door for the XLB to outperform for a period of time. Therefore, trading opportunities could lie ahead in 2020.
Active Trade Alerts
We have one active trade alert currently:
TPX (-0.54%) - reports earnings on February 12. TPX fell below its 20 day EMA yesterday, but managed to close back above it. Today, it's beneath it again (barely), but a close back above it would definitely be more bullish.
Strong Earnings ChartList (SECL)
First, an astute member wrote to us and asked why our SECL had fallen from 325 stocks to 324. Honestly, I hadn't even noticed it, but thank you for the inquiry. Chart #4556 was Celgene, Inc. (CELG), which has been acquired by Bristol-Myers (BMY). You'll notice that CELG is now missing from our SECL. Just an FYI.
I ran a scan of our SECL, searching for stocks that have already traded 50% of their normal daily volume by 11:30am EST, which would clearly put it on a pace that's unusually heavy. I run volume scans like this against the SECL every day. I'm a big believer in volume and how it impacts the long-term performance of stocks. After all, how can Wall Street accumulate shares of a company without unusually high volume?
Here is the scan code, followed by the results to this scan:

The "favorites list = 105" is the code assigned by StockCharts.com when I add my SECL to the scan. That is not something that I type in. I wanted to make that clear because we've had questions about that in the past.
Here are today's results:
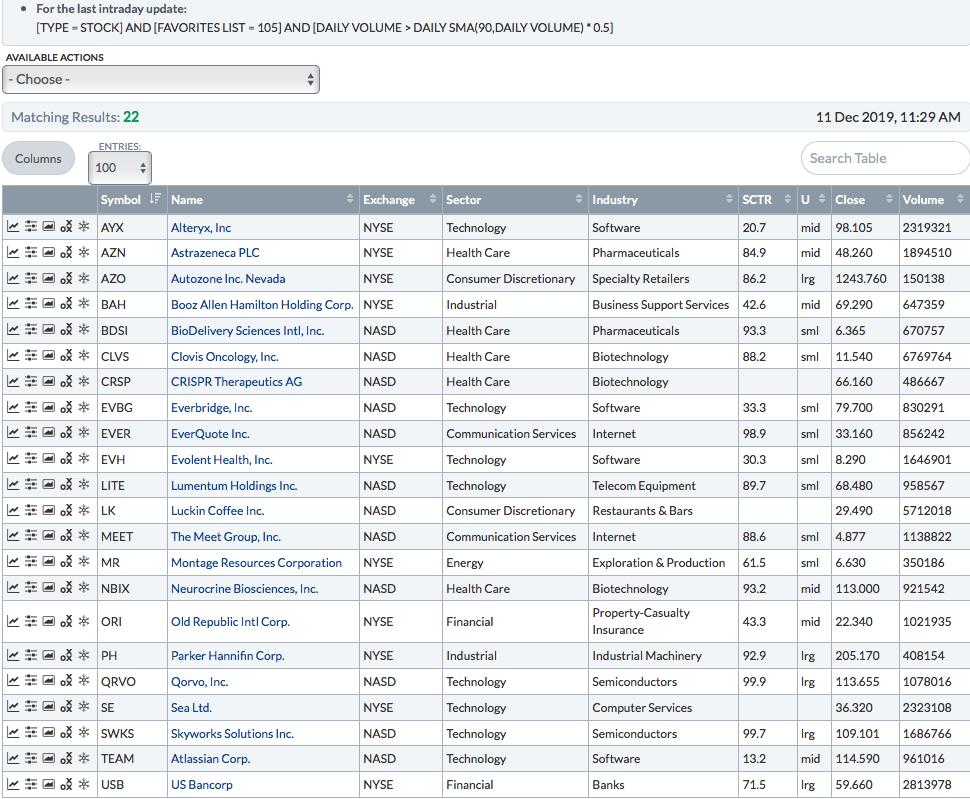
From a short-term trading perspective, here are the standouts to me from these results:
CRSP:
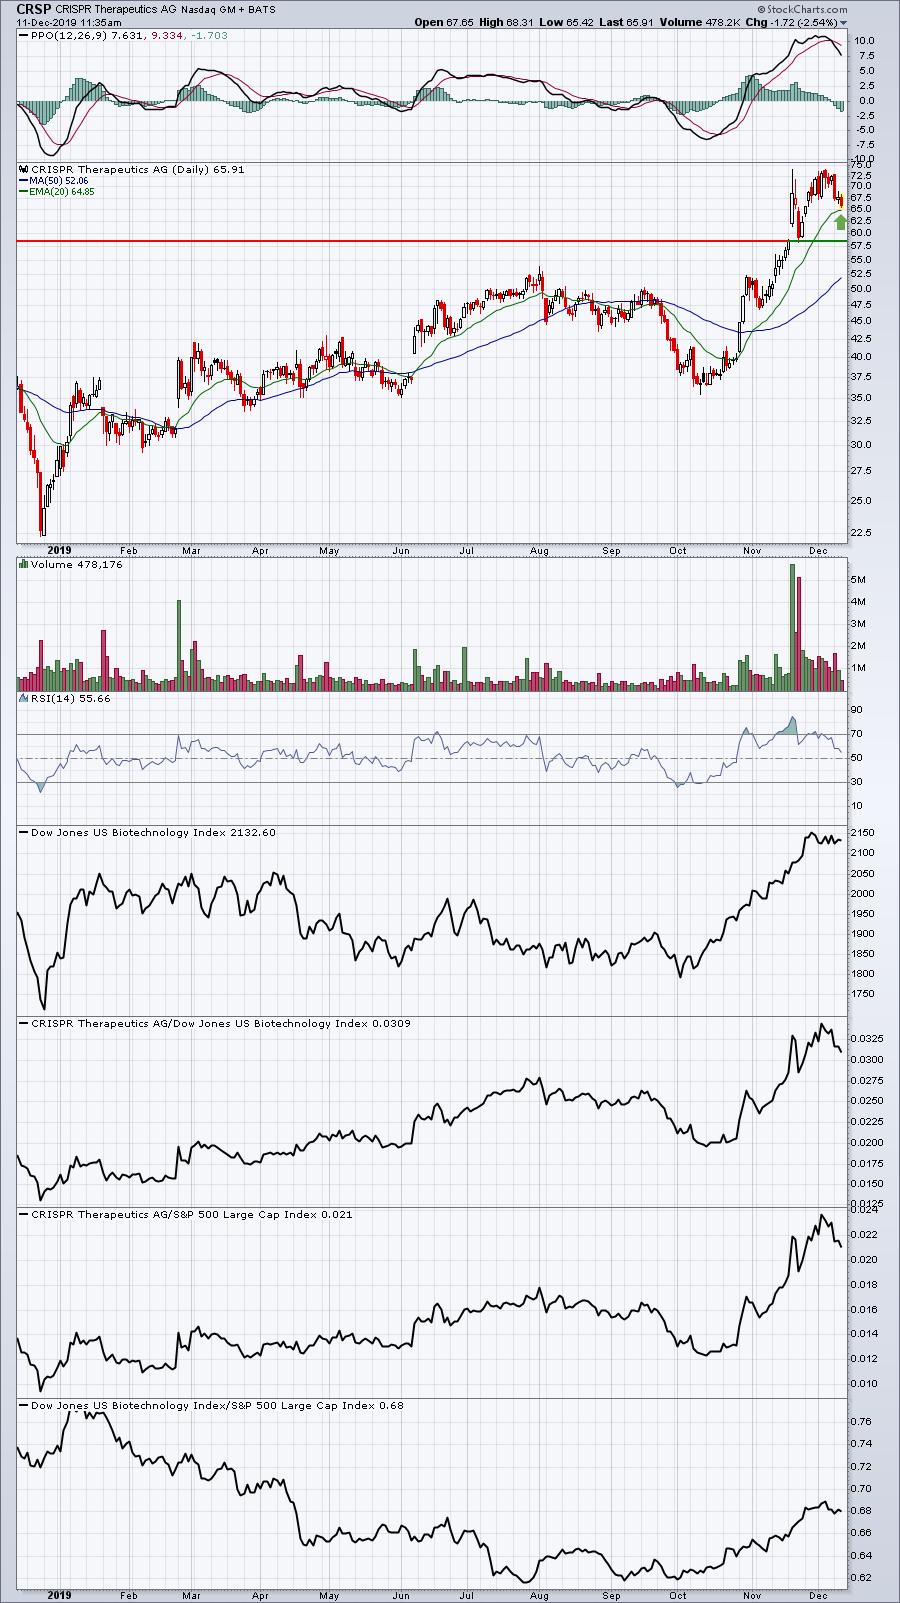
CRSP is nearing its first 20 day EMA test in 6-7 weeks. Many stocks will bounce off of such a test, but keep in mind that CRSP is a very volatile. A more manageable approach might be to allow CRSP to move below its 20 day EMA on an intraday basis and place a "stop buy" order when it moves back above. Then consider an intraday stop beneath that intraday low. No matter how you slice it, however, you need to have a high risk tolerance for a volatile stock like CRSP.
EVER:
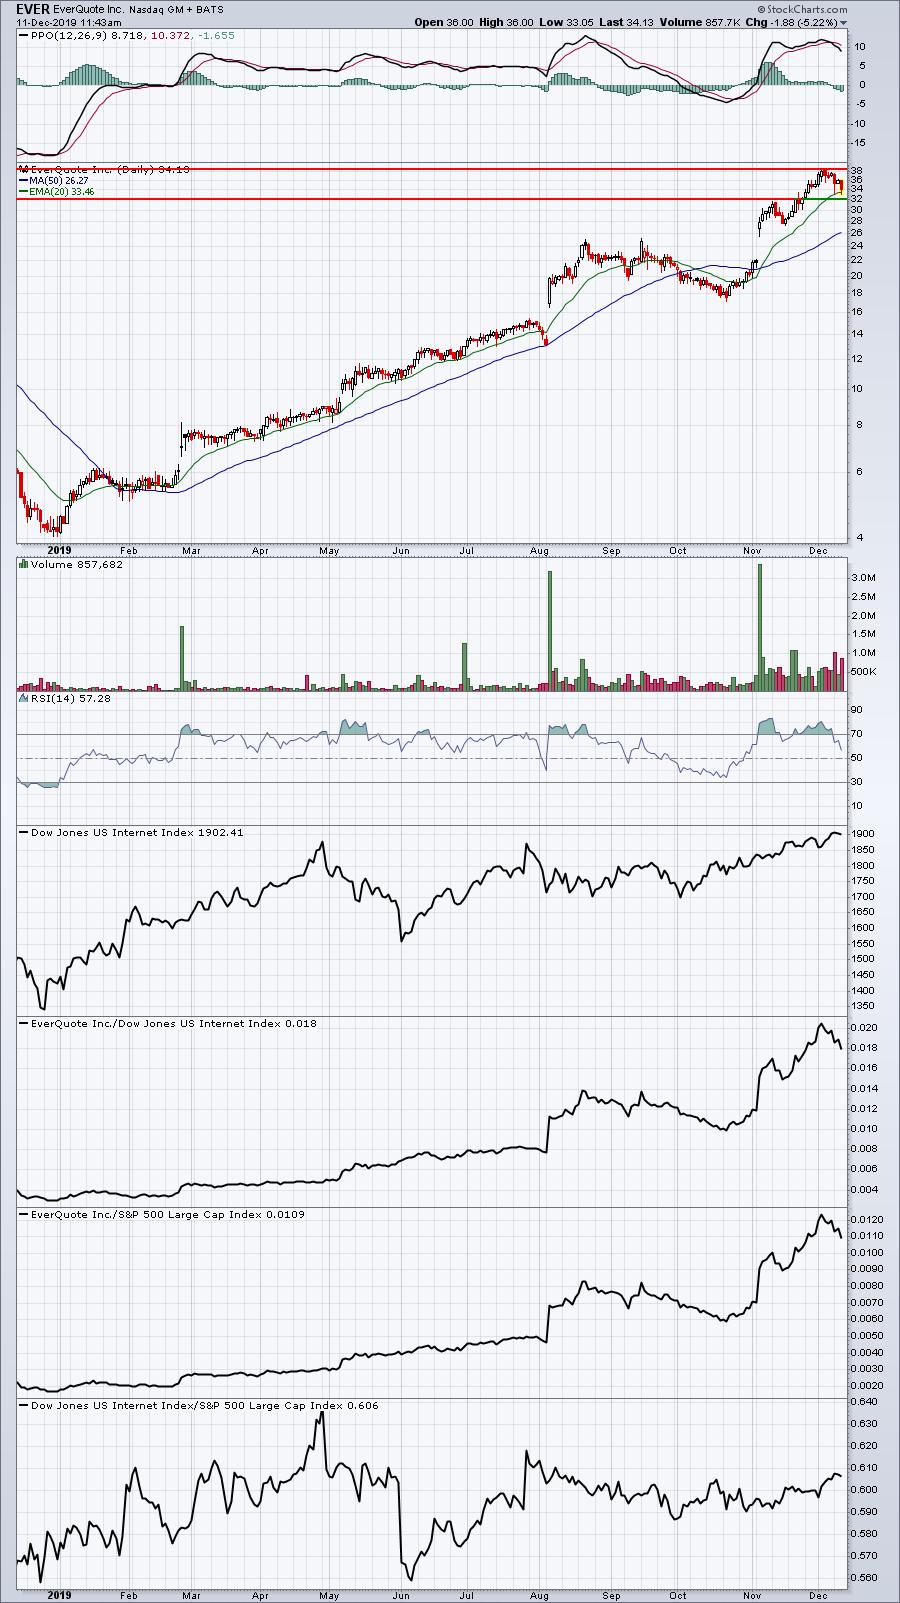
EVER is providing a second opportunity at its rising 20 day EMA support. Should it fail to hold, there is rather solid price support near 32. Building a position from the current price down to 32, taking advantage of near-term weakness should it surface, makes technical sense. Like CRSP, however, trading EVER does come with high risk as it's volatile.
PH:
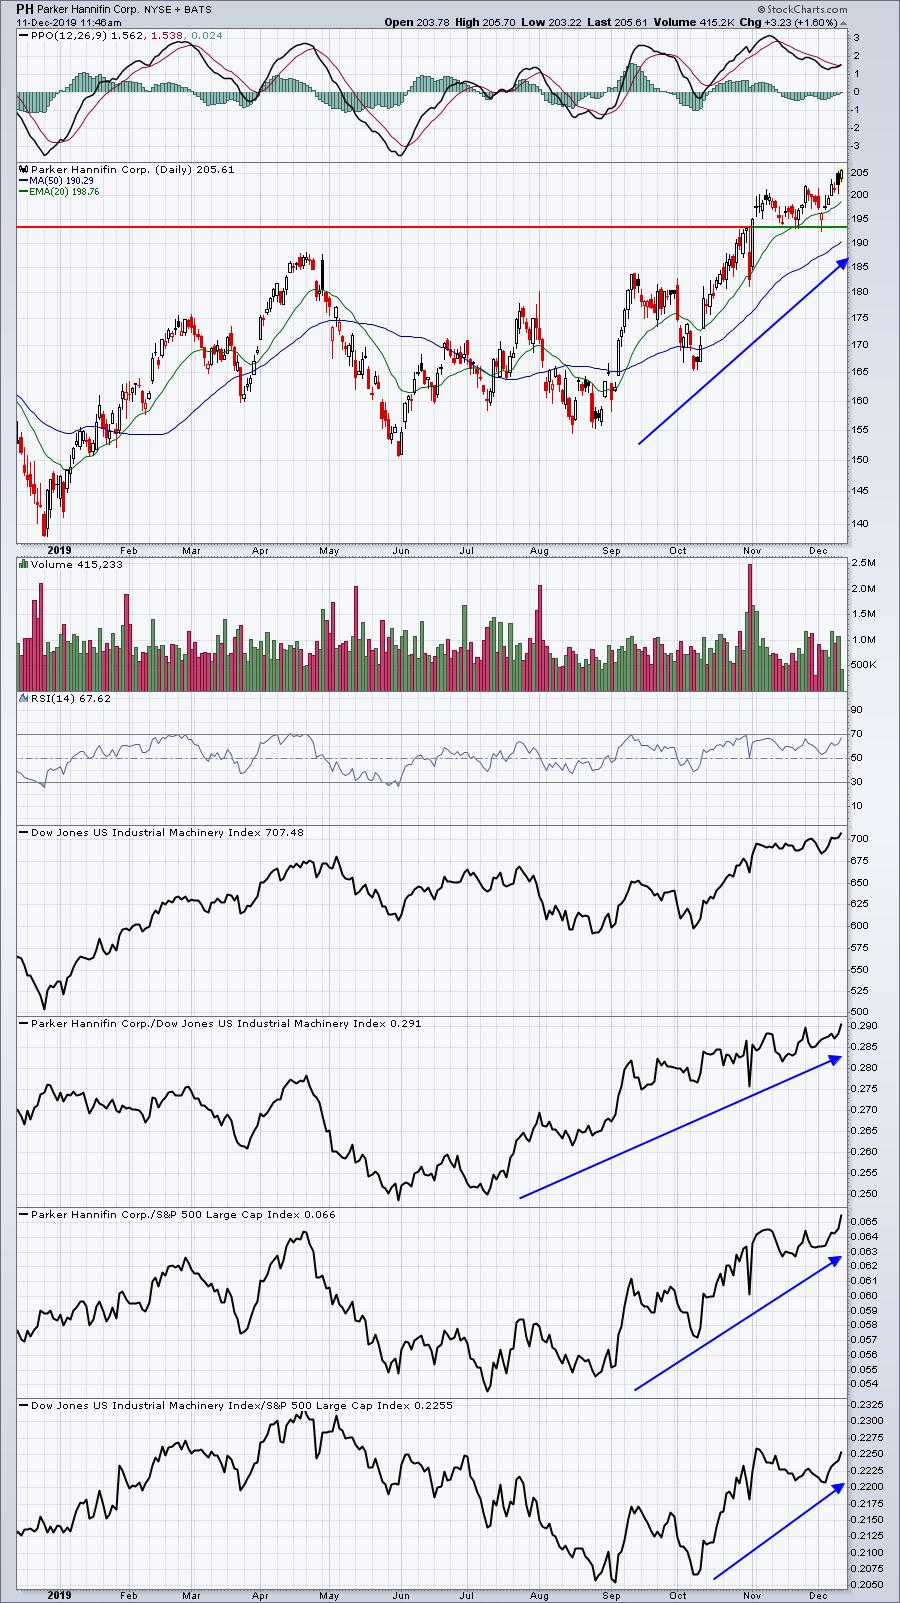
There's a lot to like here. For starters, the industrial machinery ($DJUSFE) group has become a leader and PH has been trending higher on a relative basis to its industrial machinery peers. Volume trends are strong, so for those willing to build a position, the current price down to 193 support would represent a solid accumulation zone.
Movers & Shakers
I looked at the SCTR movers on mid caps and found the following possible trade candidates:
MFG:
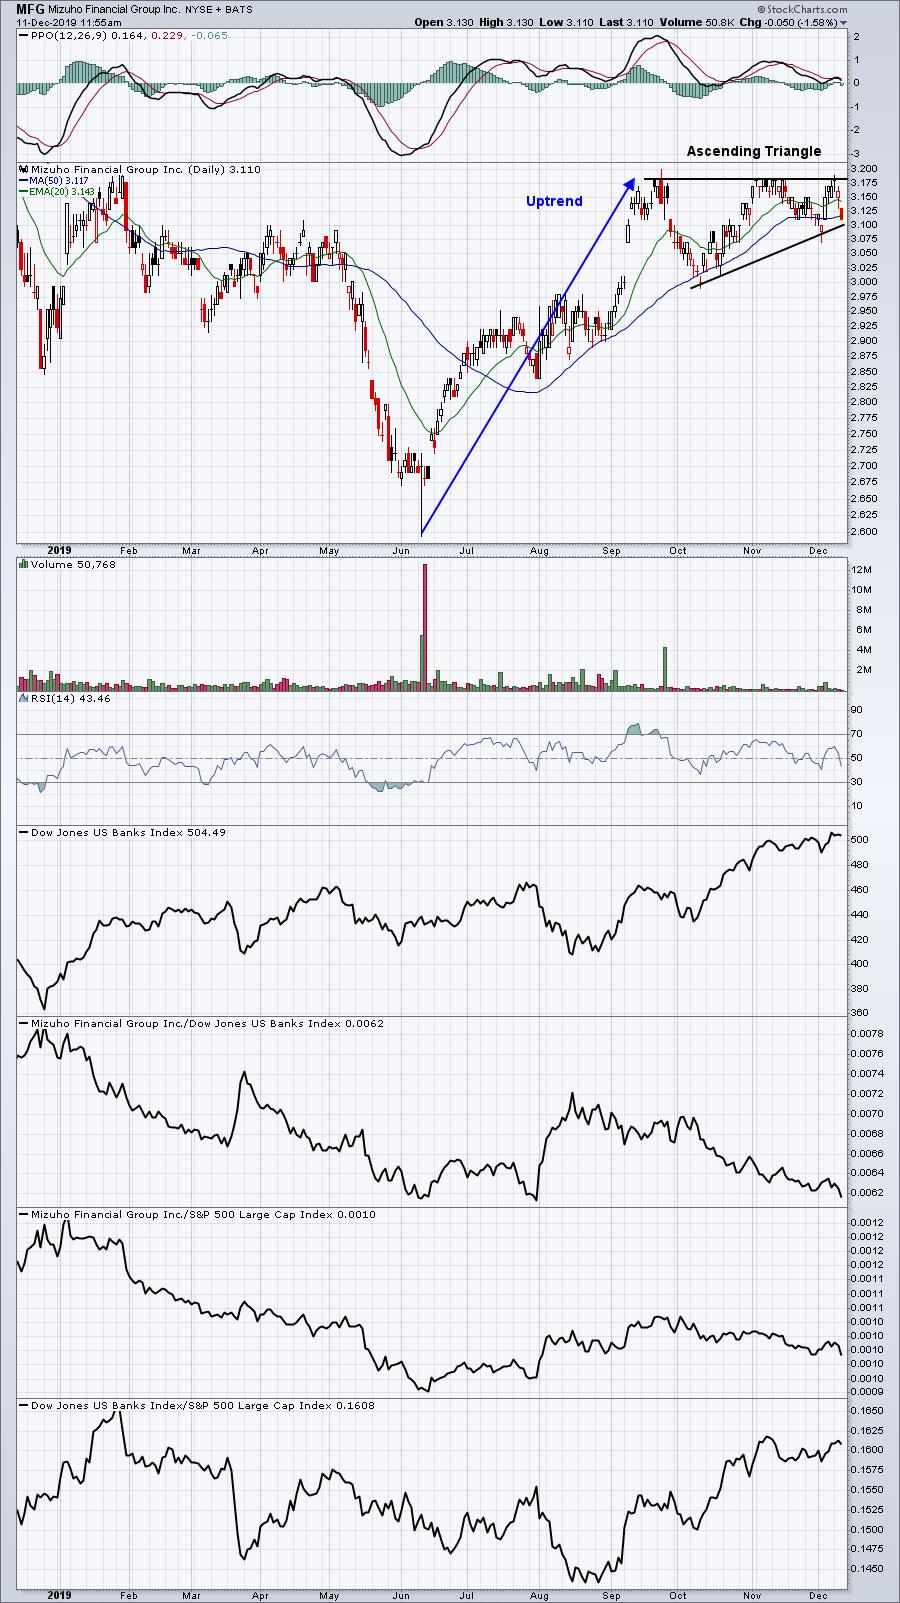
The ascending triangle pattern here off the uptrend looks very bullish. However, there are two reasons to make me pause. First, the volume can be light at times, with a just a bit over 50,000 shares traded today. Second, and perhaps more importantly, MFG has been a laggard among its banking peers. That could change with a bullish breakout, but it might be best to see that breakout and improving relative strength before considering further.
VOYA:
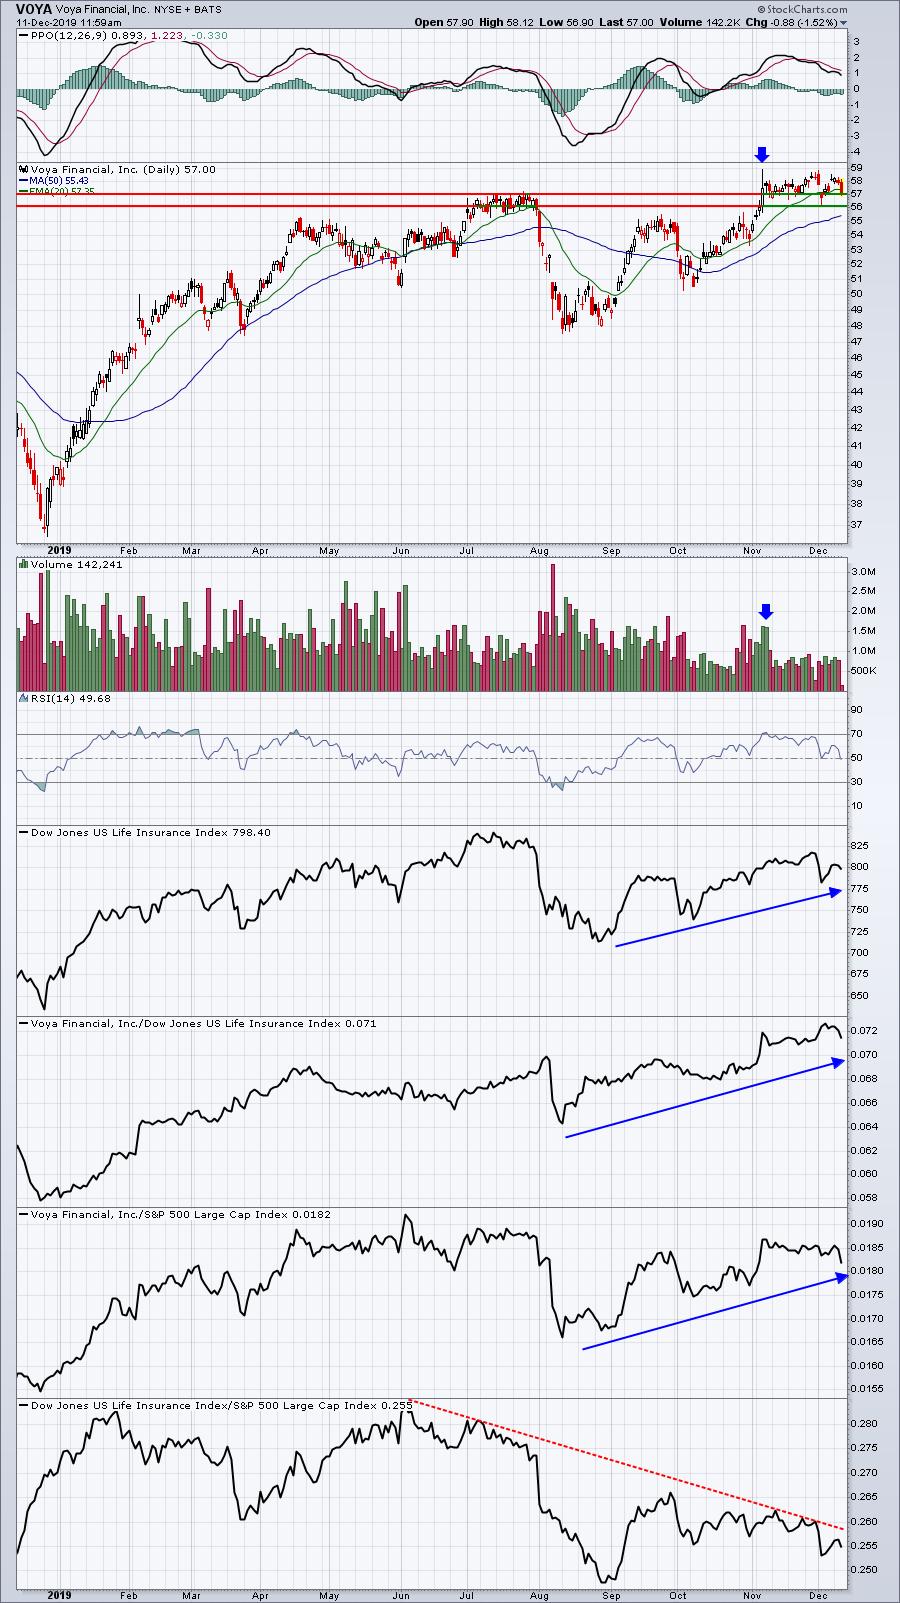
VOYA looks pretty solid, with just one technical issue. The good news is that the recent breakout occurred on confirming volume (blue arrows). VOYA, unlike MFG, shows relative strength vs. its peers and the S&P 500. The one negative, however, is life insurance ($DJUSIL) being in a relative downtrend to the benchmark S&P 500. If the group could break out, VOYA would become even more attractive.
Earnings Reports
Here are the key earnings reports for this week, featuring stocks with market caps of more than $5 billion. I also include a few select companies with market caps below $5 billion. Finally, any portfolio stocks (or active trade alerts) that will be reporting results are highlighted in BOLD. Please make sure you check for earnings dates for any companies you own or are considering owning:
Wednesday, December 11:
LULU, NDSN. Others below $5 bil: AEO, OXM, PLCE
Thursday, December 12:
ORCL, ADBE, COST, AVGO, CIEN. Others below $5 bil: None
Friday, December 13:
None
Economic Reports
November CPI: +0.3% (actual) vs. +0.2% (estimate)
November Core CPI: +0.2% (actual) vs. +0.2% (estimate)
FOMC policy statement due at 2:00pm EST (no rate change expected)
Happy trading!
Tom