
EB Daily Market Report - Thursday, December 12, 2019
Executive Market Summary
- Futures were lower, but we've seen strength resume
- President Trump tweeted that the U.S. and China were close to a big trade deal, sparking the rally
- The S&P 600 small cap index is leading on a relative basis, though all major indices are higher
- Financials (XLF) and energy (XLE) are higher, led by banks ($DJUSBK) and higher crude oil prices, respectively
- Real estate (XLRE) is once again the laggard
- Gambling stocks are up nearly 3% to lead consumer discretionary (XLY) higher, but the rising 10 year treasury yield ($TNX) is hurting home construction, the only loser in discretionary
- Our alert TPX continues to hover near its key 20 day EMA support
Market Outlook
Today is a perfect example of why I don't like to bet against a bull market advance within a secular bull market. Yes, we were recently overbought. Yes, we have a negative divergence on the S&P 500 daily chart. Yes, the hourly chart was pointing to further consolidation. Yes, we're in the historically weak part of December. All of those things are true. But we're in a market that wants to go higher. This morning, President Trump indicated that the U.S. and China were close to a big trade deal....and higher we go!
There are two technical developments to point out. First, the S&P 500 opened beneath the breakout level and currently trades above it on an intraday basis. If we were to finish today near the flat line, we could still move lower over the next few days. A shooting star (reversing candle) with a negative divergence in play could result in a 50 day SMA test, which is currently at 3058. That's more than 100 points from our current price. Here's the visual:
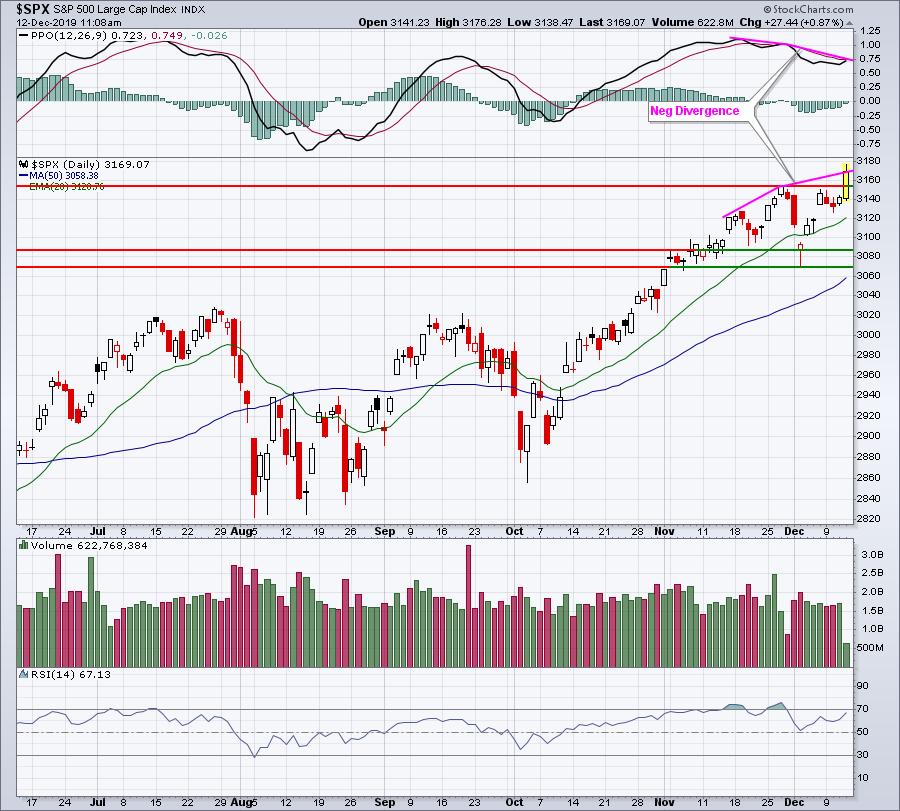
A breakout on solid volume is bullish, even with a negative divergence in place. But if we see a reversing candle and a false breakout, together with a negative divergence, you might want to hedge near-term. The 50 day SMA will continue rising, so a reversal and subsequent pullback below 3100 to test the two support levels would not be out of the question.
Make no mistake about it, I am very bullish and I believe we're going higher. But the stock market's job is to create fear and uncertainty. It's rarely easy. A reversal today could suggest we have one more pullback in store. But a trend day (buying throughout the day) would be undeniably bullish.
Sector/Industry Focus
Banks ($DJUSBK) are exploding today, up more than 2.3% at last check:
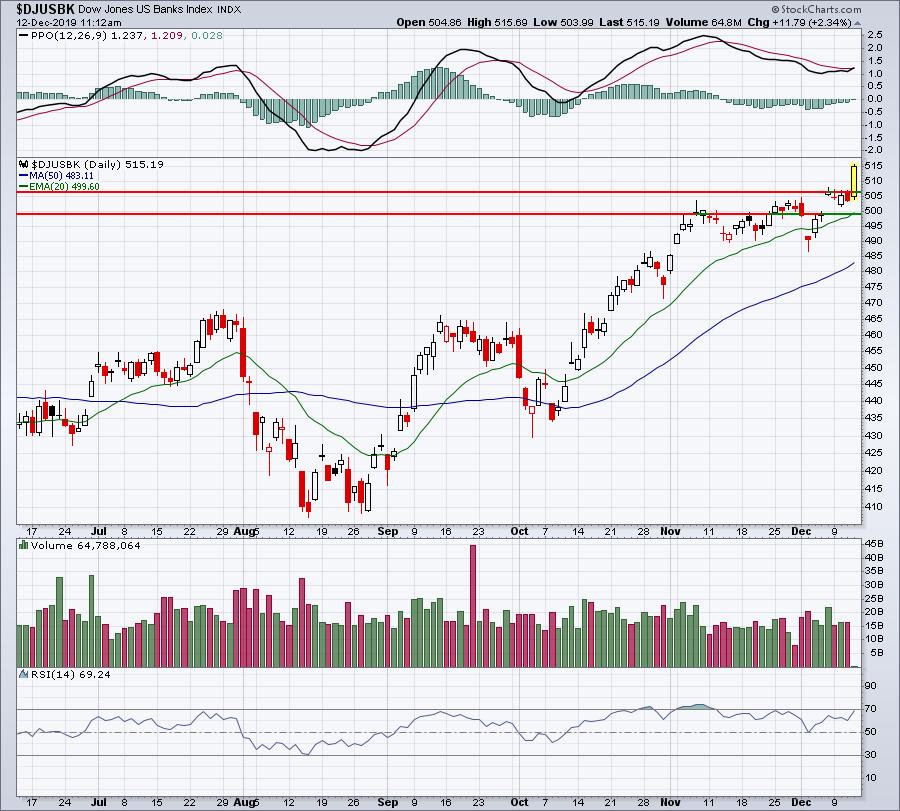
I absolutely love the banks right now. The Fed has announced a plan to purchase short-term T-bills for at least the next few months, which will keep the low end of the yield curve down. Economic improvement is likely to send the upper end of the yield curve higher. This increasing "spread" is to banks roughly the same as golf is to me. :-)
The recent action is also increasing the relative performance of banks to REITs ($DJUSBK:$DJR):
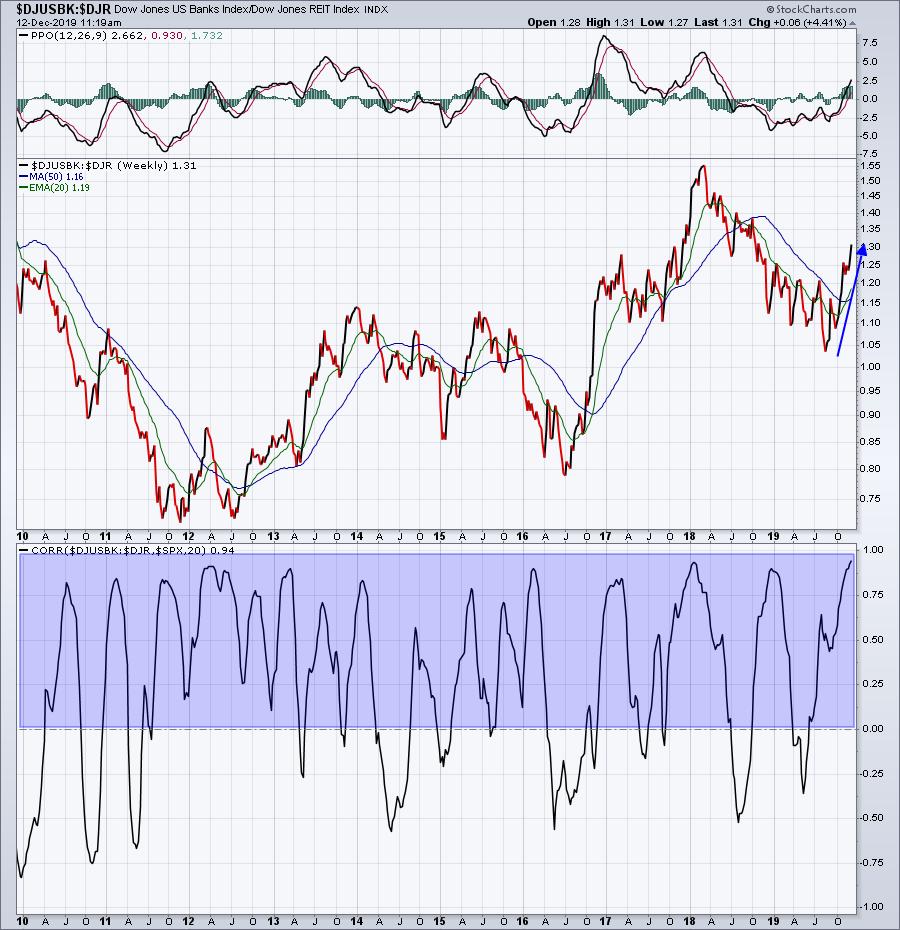
That blue-shaded area highlights the positive correlation between the direction of the DJUSBK:DJR ratio and the direction of the S&P 500. In other words, when banks are outperforming REITs, it is almost always associated with a rising U.S. equity market.
Active Trade Alerts
We have one active trade alert currently:
TPX (-0.34%) - reports earnings on February 12. We've seen TPX recover off of 20 day EMA tests the last two days. Today, it's slightly lower again; a close above 87 is what I'd look for to suggest it's prime for a return to 91-92.
Strong Earnings ChartList (SECL)
I ran a scan this morning of our SECL stocks that are in the financial and industrials sectors that currently have a SCTR score beneath 50, looking to see how many might provide a trading opportunity for those who try to avoid stocks in lengthy uptrends. I also view both financials and industrials as two of my favorite sectors heading into 2020, especially if the 10 year treasury yield ($TNX) can break above 2.00%. The following stocks were returned:
Financials - ALL, ORI, ONDK, JKHY, SQ
Industrials - UPS, ALK, BAH, EFX, ATSG, BE
Of these 11 stocks, I found the following charts interesting:
ALL:
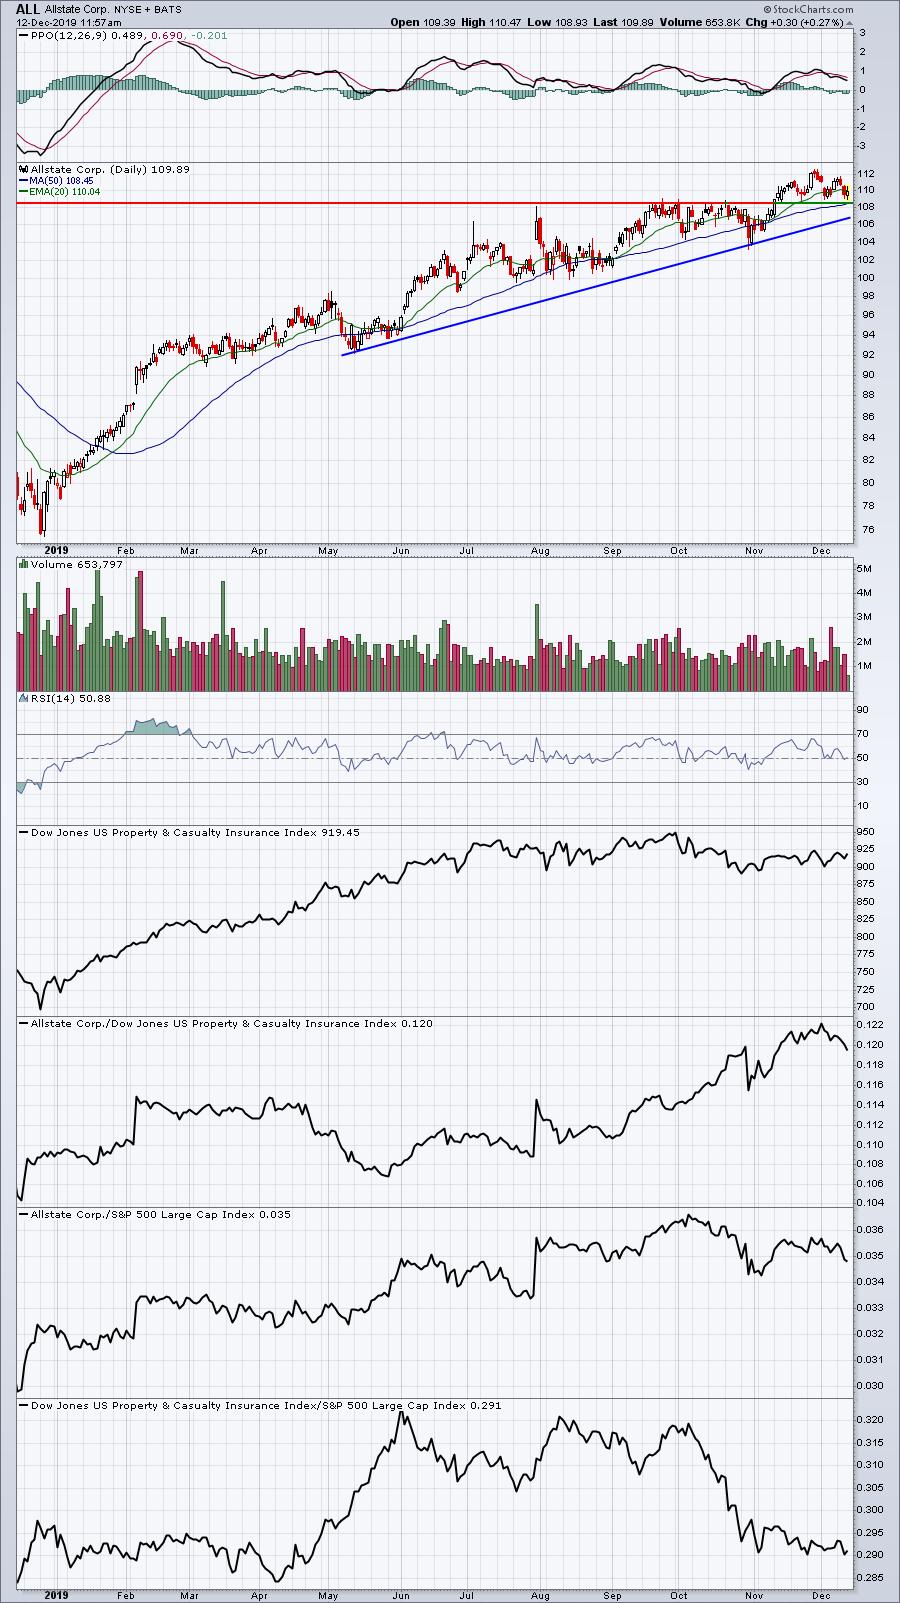
ALL is a leading property & casualty insurer and has recently pulled back closer to price and trendline support.
UPS:
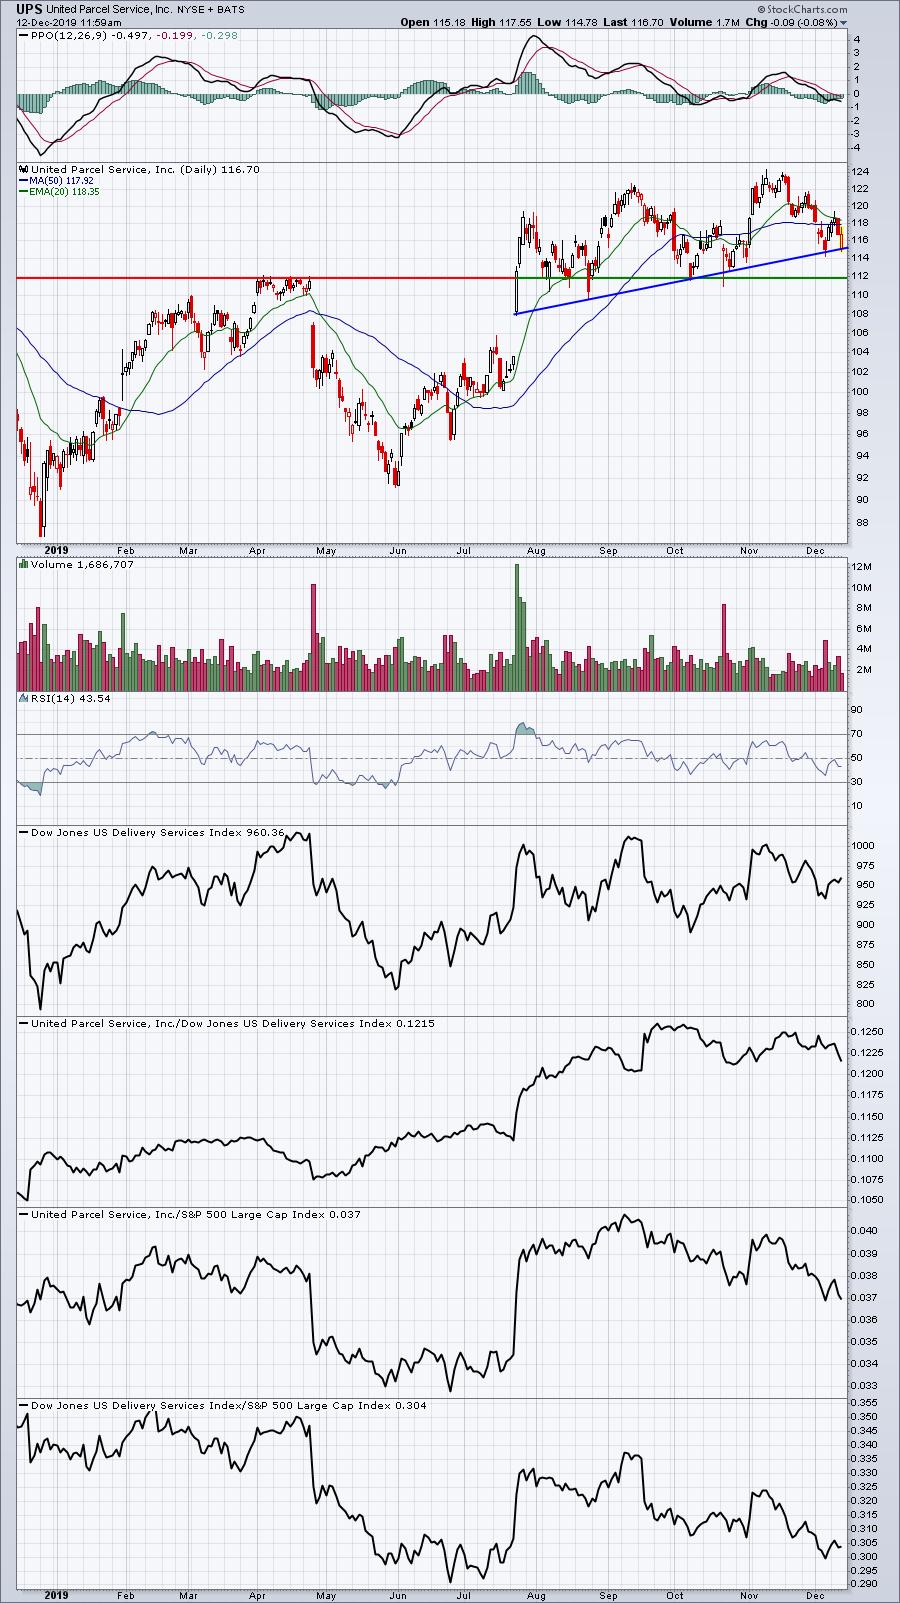
UPS has been crushing FDX in 2019 and based up its relative strength, I expect that trend to continue. The recent selling is likely presenting a high reward to risk opportunity to trade it.
ALK:
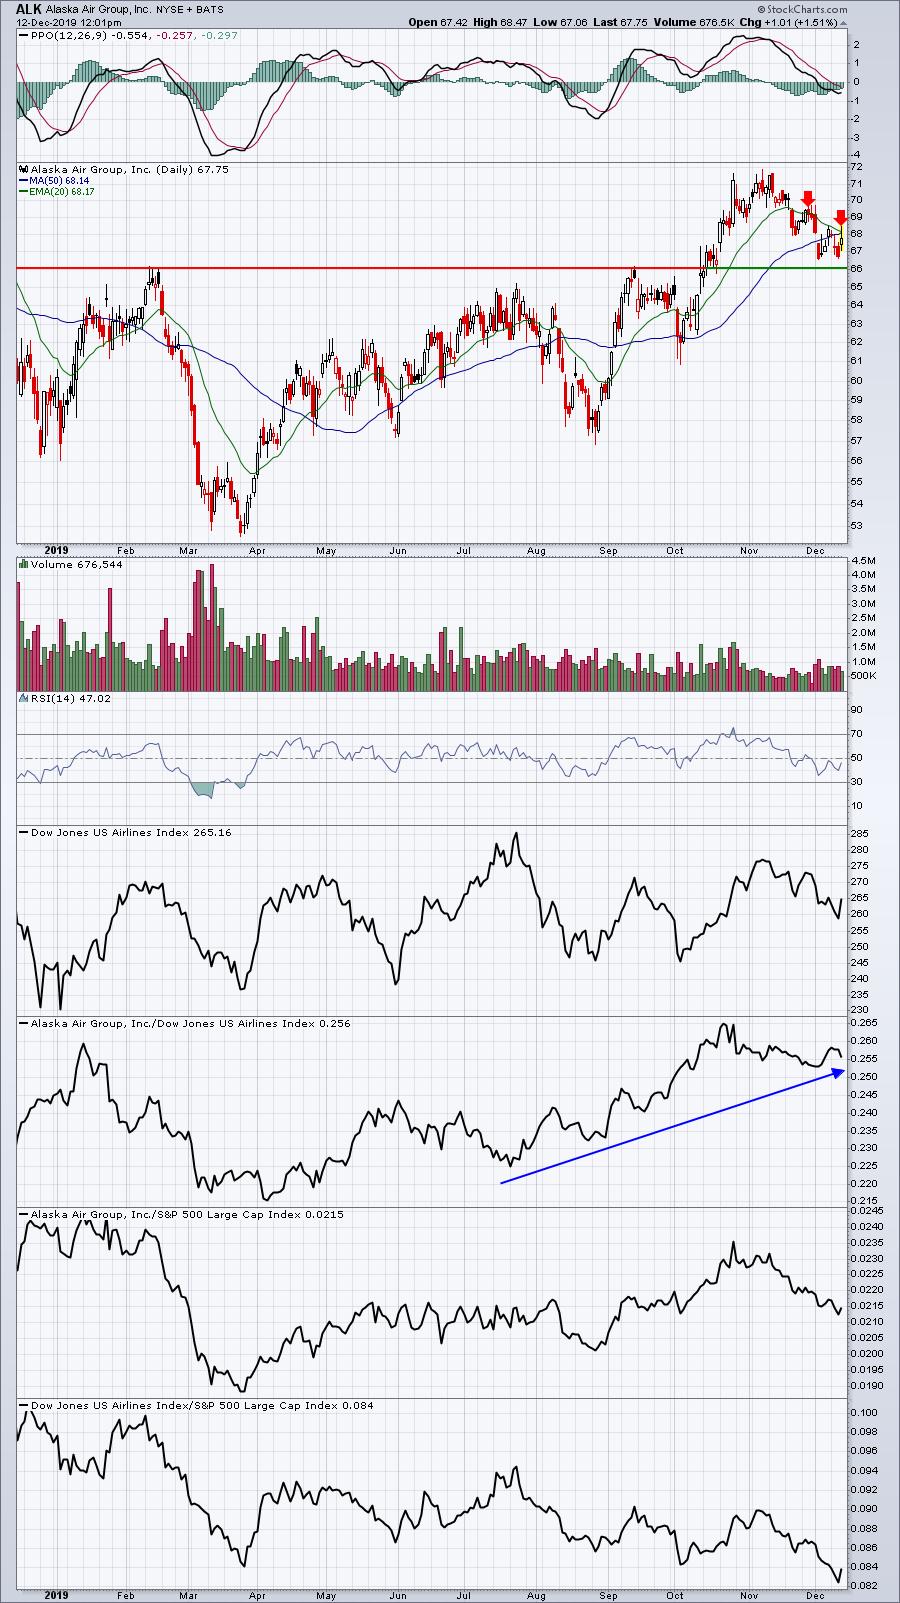
Airlines have not been great performers in 2019, but ALK has gone against the grain and outperformed its peers. The recent selling has taken it back close to a breakout level near 66. It's currently trending beneath its 20 day EMA, so either a test of price support at 66 or a breakout above the 20 day EMA is what I'd look for.
ATSG:
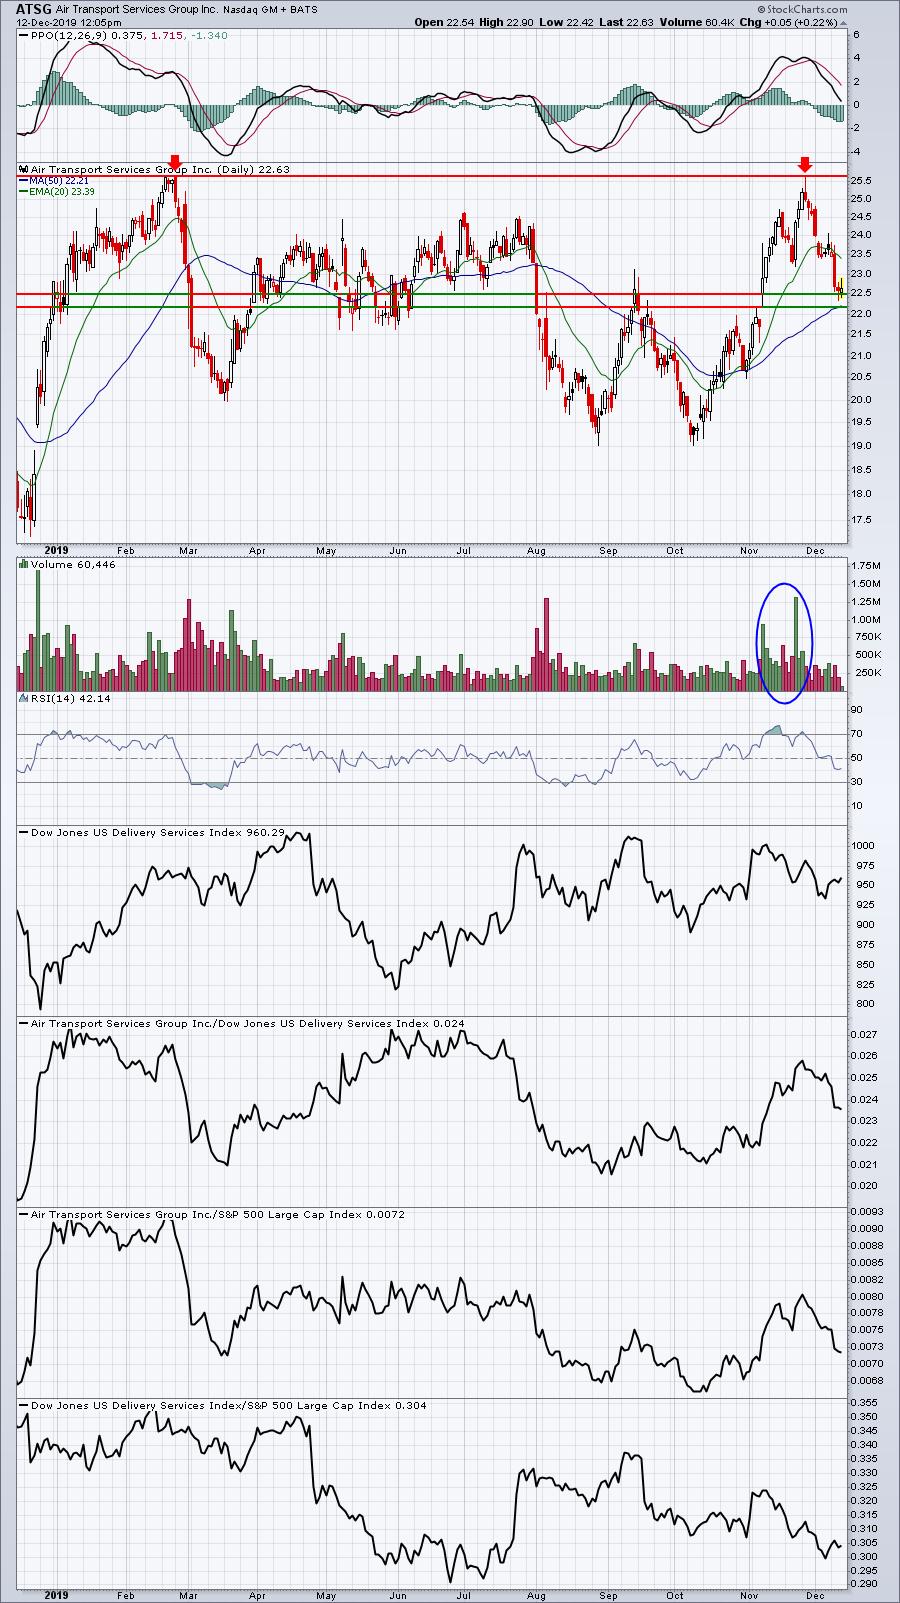
Delivery services has been another rough group in 2019, but ATSG showed a big pickup in volume that accompanied a better-than-expected quarterly earnings report back in early-November. The selling has taken ATSG back to a key area of price/gap support from 22.20 to 22.50.
Movers & Shakers
Gambling stocks ($DJUSCA) are breaking out above key resistance as you can see below:
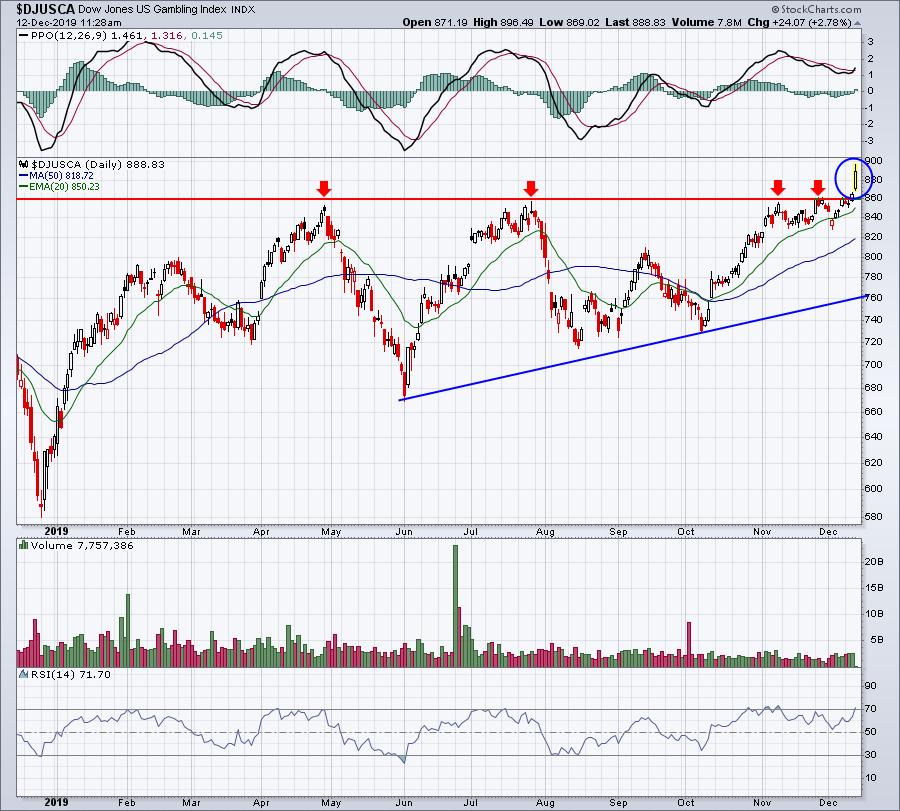
I thought it would be timely to provide you a few gambling stocks that look solid technically:
LVS:
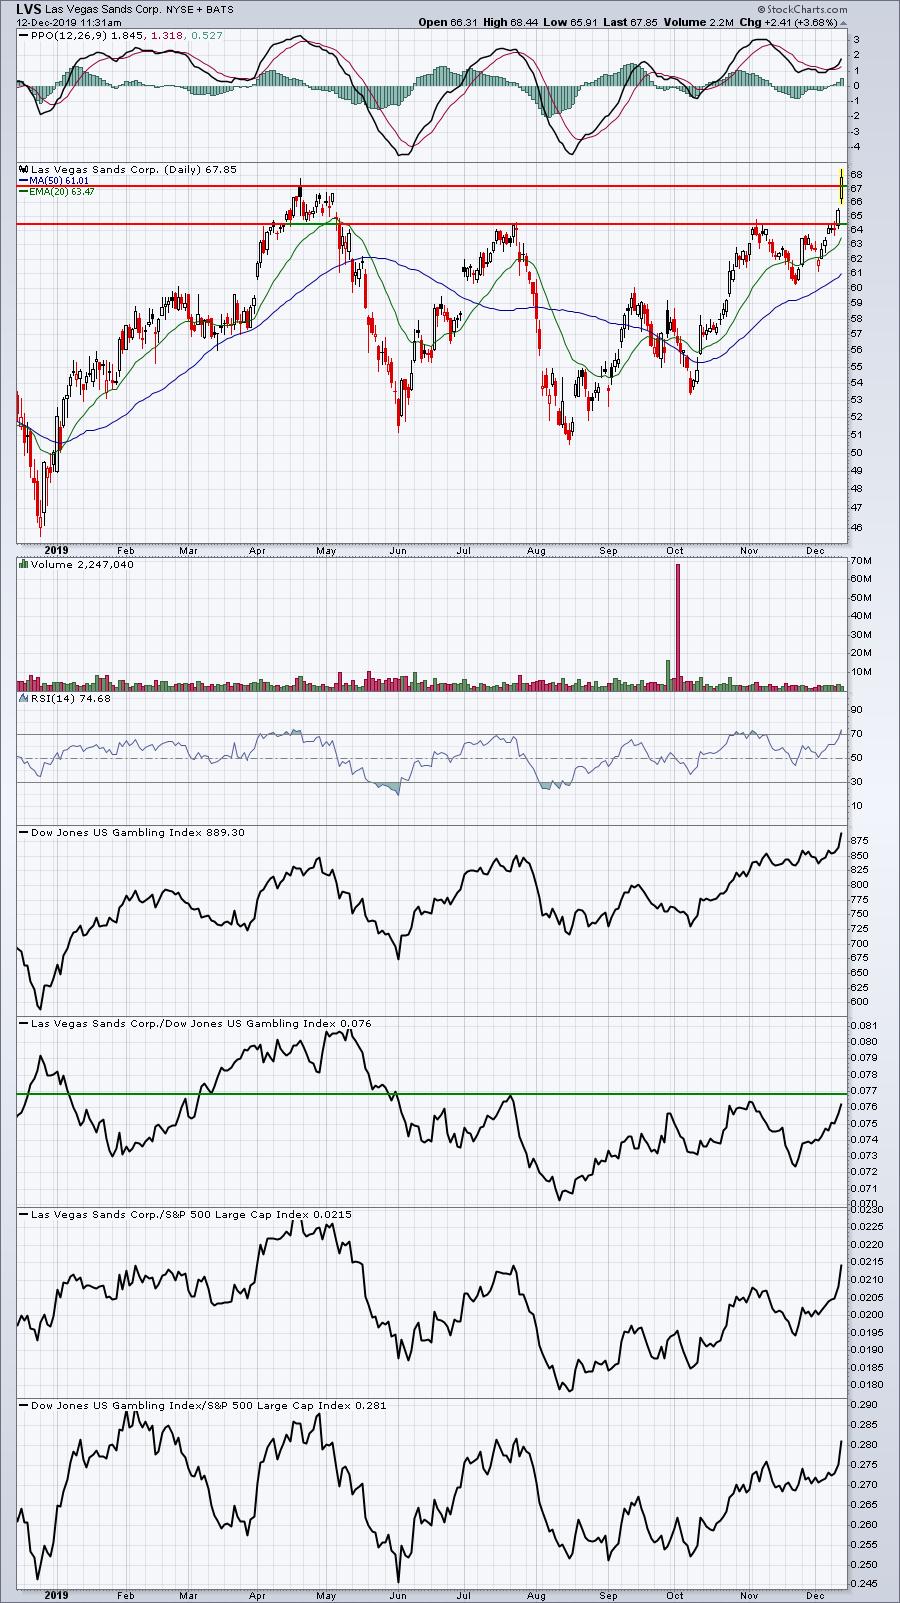
LVS looks solid to me, but I'd like to see two things. First, I want to see LVS break out to a multi-month relative high vs. its gambling peers. Second, I want to see that absolute price breakout above 68. Jumping in here without a breakout could be dangerous since LVS is already overbought. Failure to breakout today could lead to a short-term pullback to test its rising 20 day EMA.
SGMS:
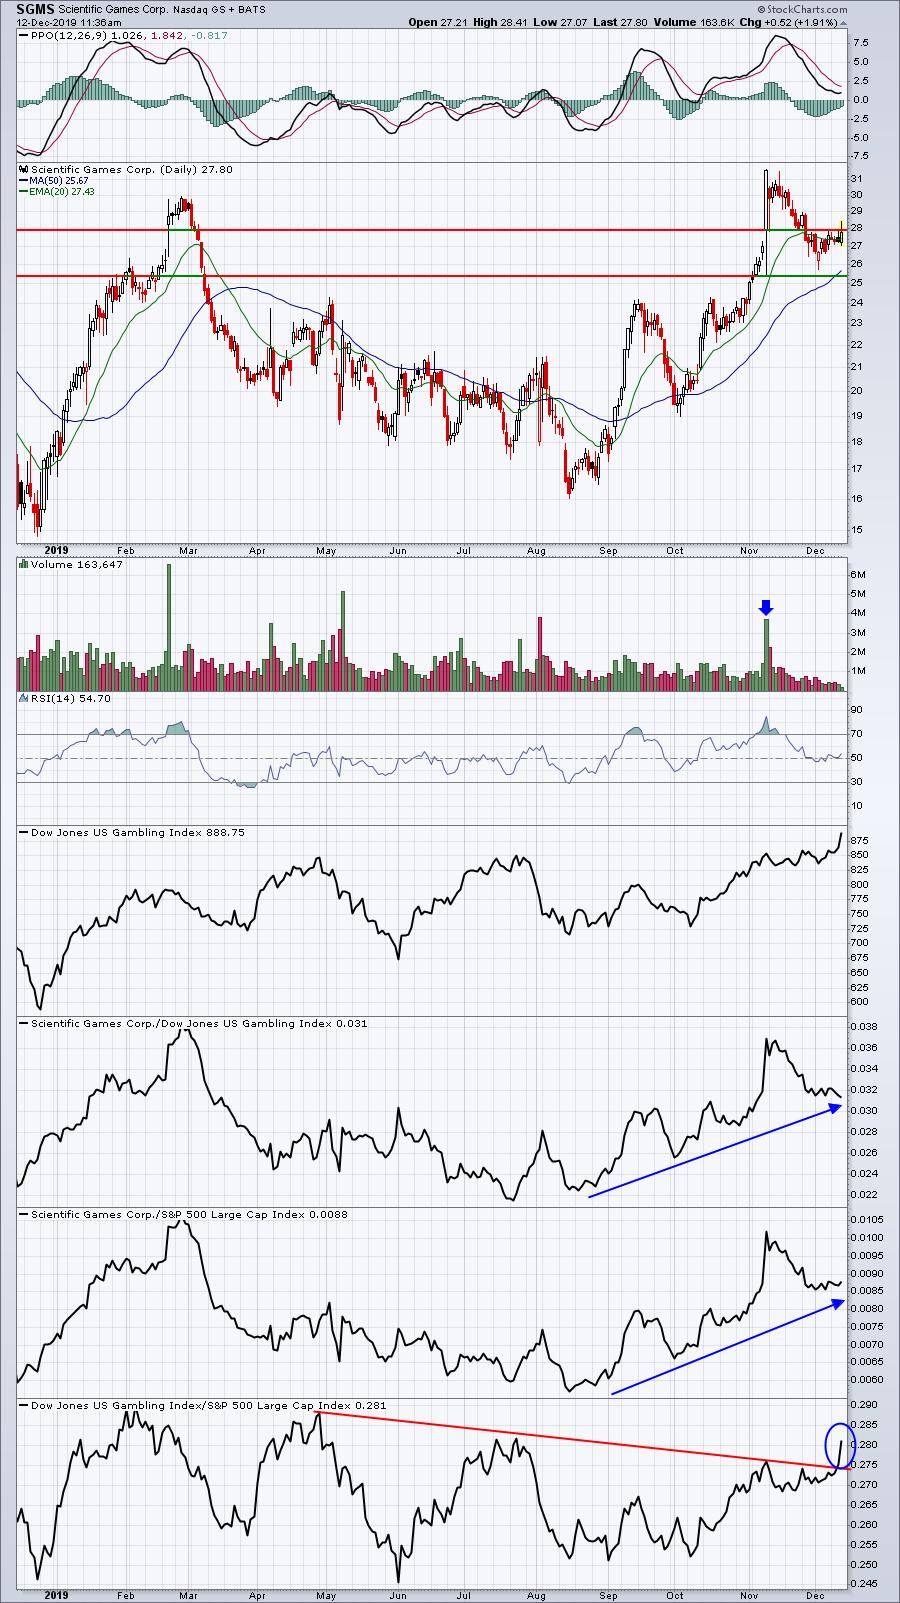
SGMS should have solid support between 25.50-28.00. I also like the small cap angle here, since I'm a fan of small cap stocks heading into 2020. It'll likely be volatile, but I see it moving higher.
WYNN:
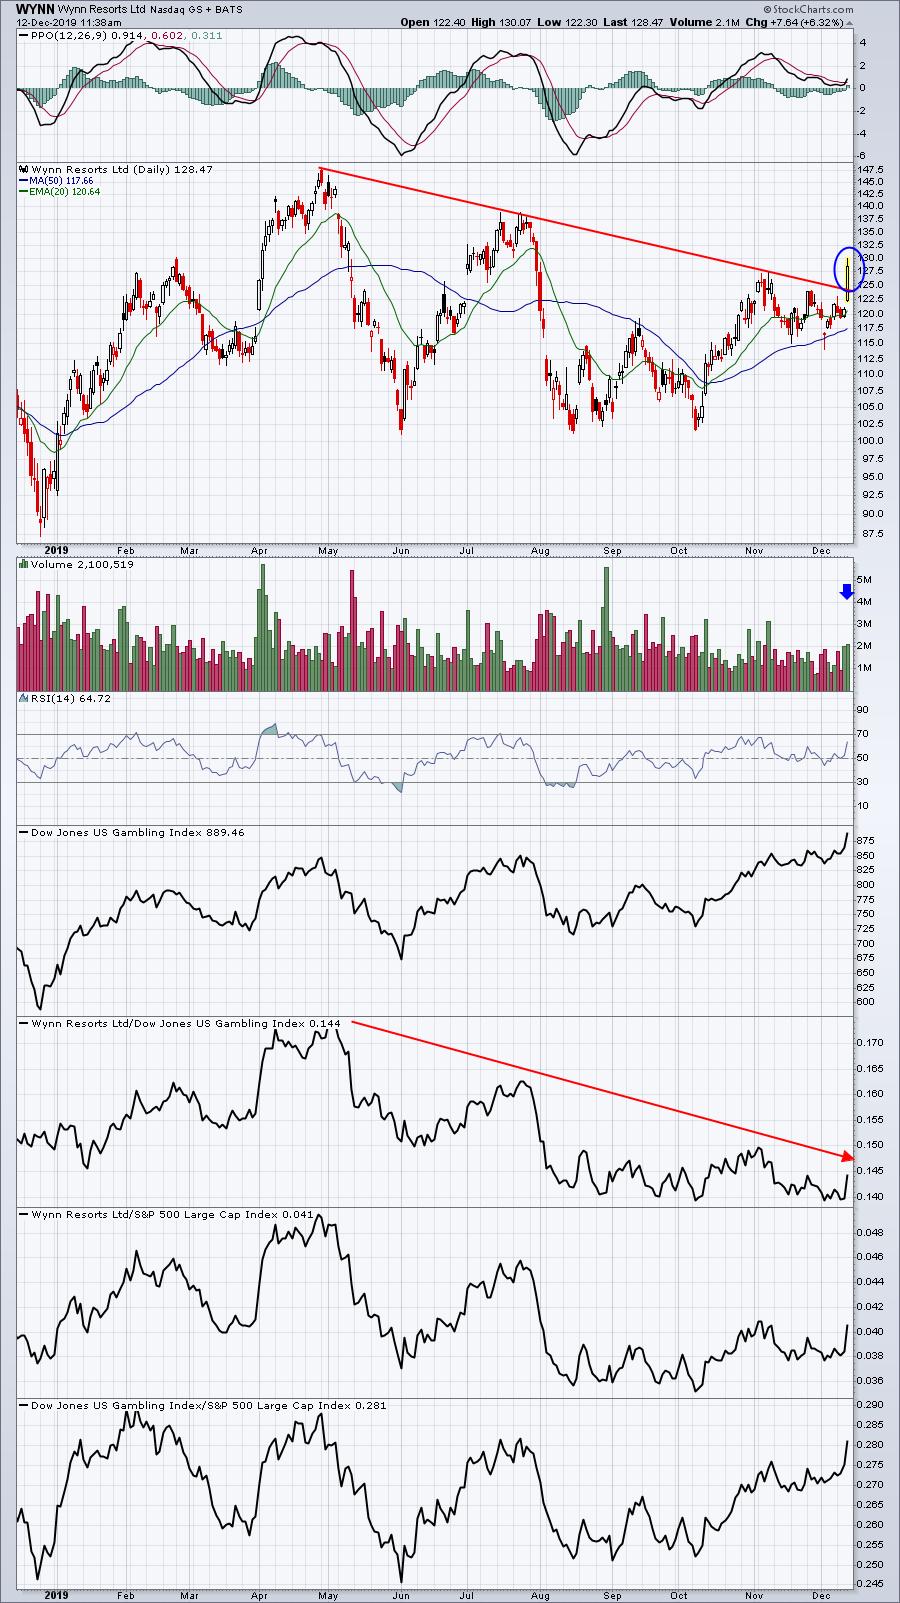
WYNN is a different type of trading candidate within the gambling industry. It's been trending lower vs. its industry peers for several months, but it's trying to break its downtrend line today on its absolute chart. A breakout there could begin to lead to further relative strength. It's more of a technical "value" play within the group.
Earnings Reports
Here are the key earnings reports for this week, featuring stocks with market caps of more than $5 billion. I also include a few select companies with market caps below $5 billion. Finally, any portfolio stocks (or active trade alerts) that will be reporting results are highlighted in BOLD. Please make sure you check for earnings dates for any companies you own or are considering owning:
Thursday, December 12:
ORCL, ADBE, COST, AVGO, CIEN. Others below $5 bil: None
Friday, December 13:
None
Economic Reports
November PPI: +0.0% (actual) vs. +0.2% (estimate)
November Core PPI: -0.2% (actual) vs. +0.2% (estimate)
Initial jobless claims: 252,000 (actual) vs. 213, 000 (estimate)
Happy trading!
Tom