
EB Daily Market Report - Monday, December 16, 2019
Executive Market Summary
- Futures were green to open a new trading week
- The second half of December tends to be much stronger historically than the first half
- Currently, all of our major indices are at 2019 highs (most are at all-time highs)
- Energy (XLE), healthcare (XLV), and technology (XLK) are today's leading sectors
- Renewable energy ($DWCREE) is breaking above short-term resistance at 110
- Housing market index jumps unexpectedly to 76, its highest reading in 20 years
- Our alert TPX reversed nicely on Friday and is up 2% today
Market Outlook
New records are being set today as the Dow Jones, S&P 500, and NASDAQ all trade at fresh all-time highs. We've moved into the more bullish half of December and early results are following the historical trend. Several weeks ago, I set a year end target of 3225 on the S&P 500 as we had broken out of a bullish ascending triangle continuation pattern that measured to that level. Here's the chart I was looking at:
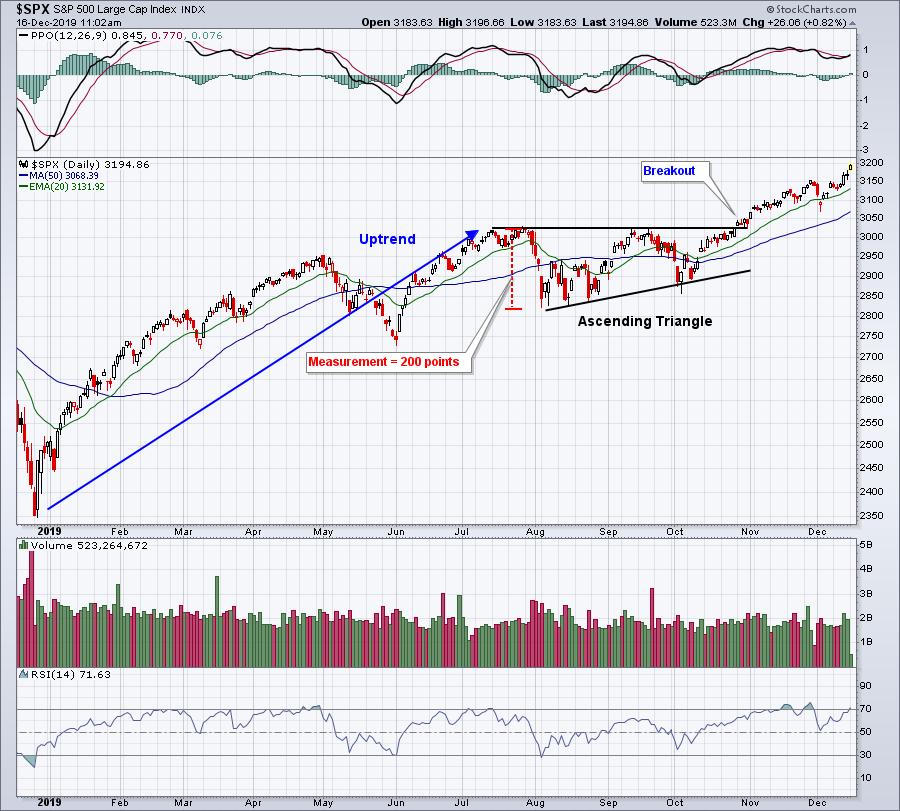
The beauty of patterns is that they provide initial targets. The "measurement" of an ascending triangle continuation pattern is the distance (in terms of points) from the top of the triangle to the initial low. That was roughly 200 points in the above chart and we're now approaching that initial measurement to 3225. This does not mean that the rally will end there, but we should at least consider the possibility that we could see bears get a bit more aggressive there.
Sector/Industry Focus
Renewable energy ($DWCREE) is clearing important short-term price resistance at 110 and it's also the second best performing industry group today. First, check out the industry group relative strength leaderboard:
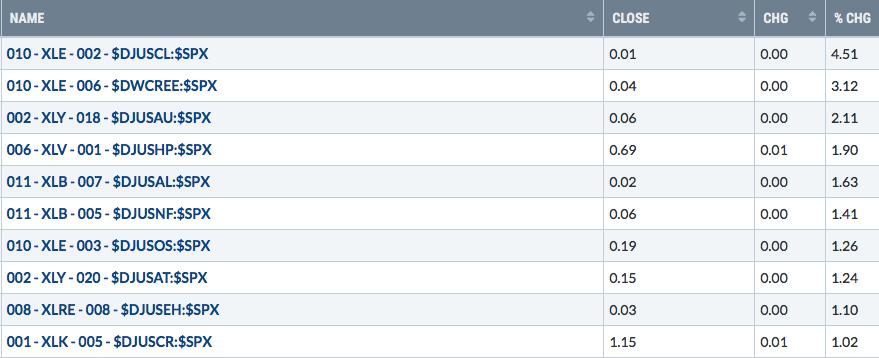
Auto parts ($DJUSAT) is 8th on this list and that helps to explain why our current Active Trade Alert is performing so well today.
Active Trade Alerts
We have one active trade alert currently:
TPX (+2.00%) - reports earnings on February 12. The nice reversal on Friday is paying off today as TPX has broken out above short-term resistance in the 86.50-87.00 area:
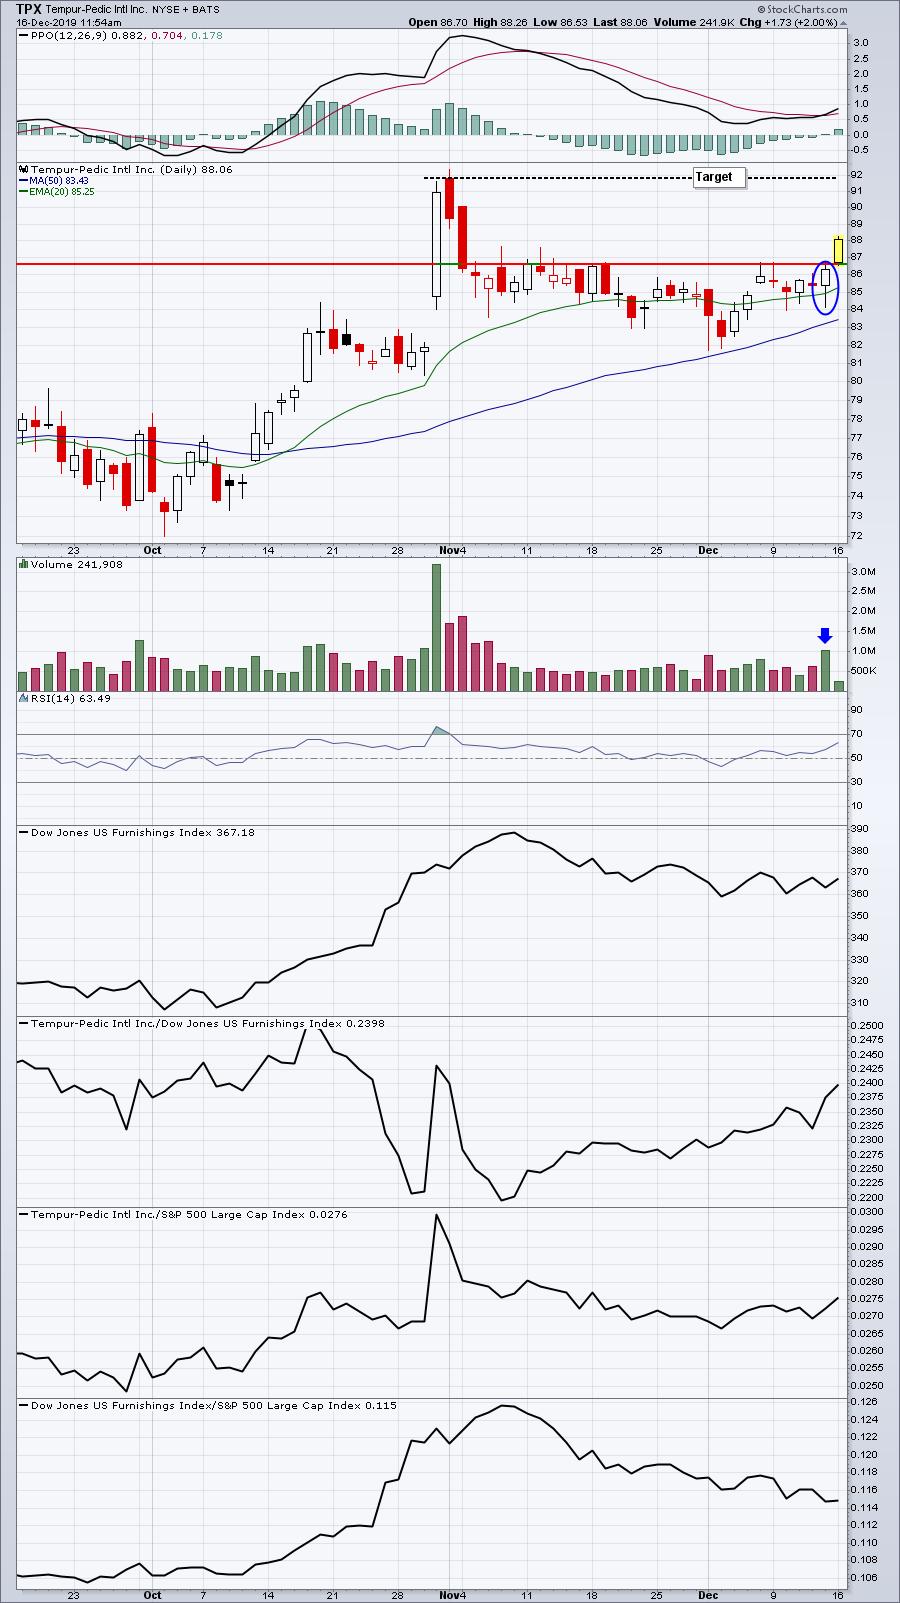
The next stop is our target of 91.80, although taking profits along the way, especially with zero-commission trading, makes good sense.
Strong Earnings ChartList (SECL)
There's no way to run a scan, looking for stocks on our SECL hitting gap support, but I reviewed many charts looking for exactly that. Here are a few examples of what I look for when I look for tests of gap support:
ISRG:
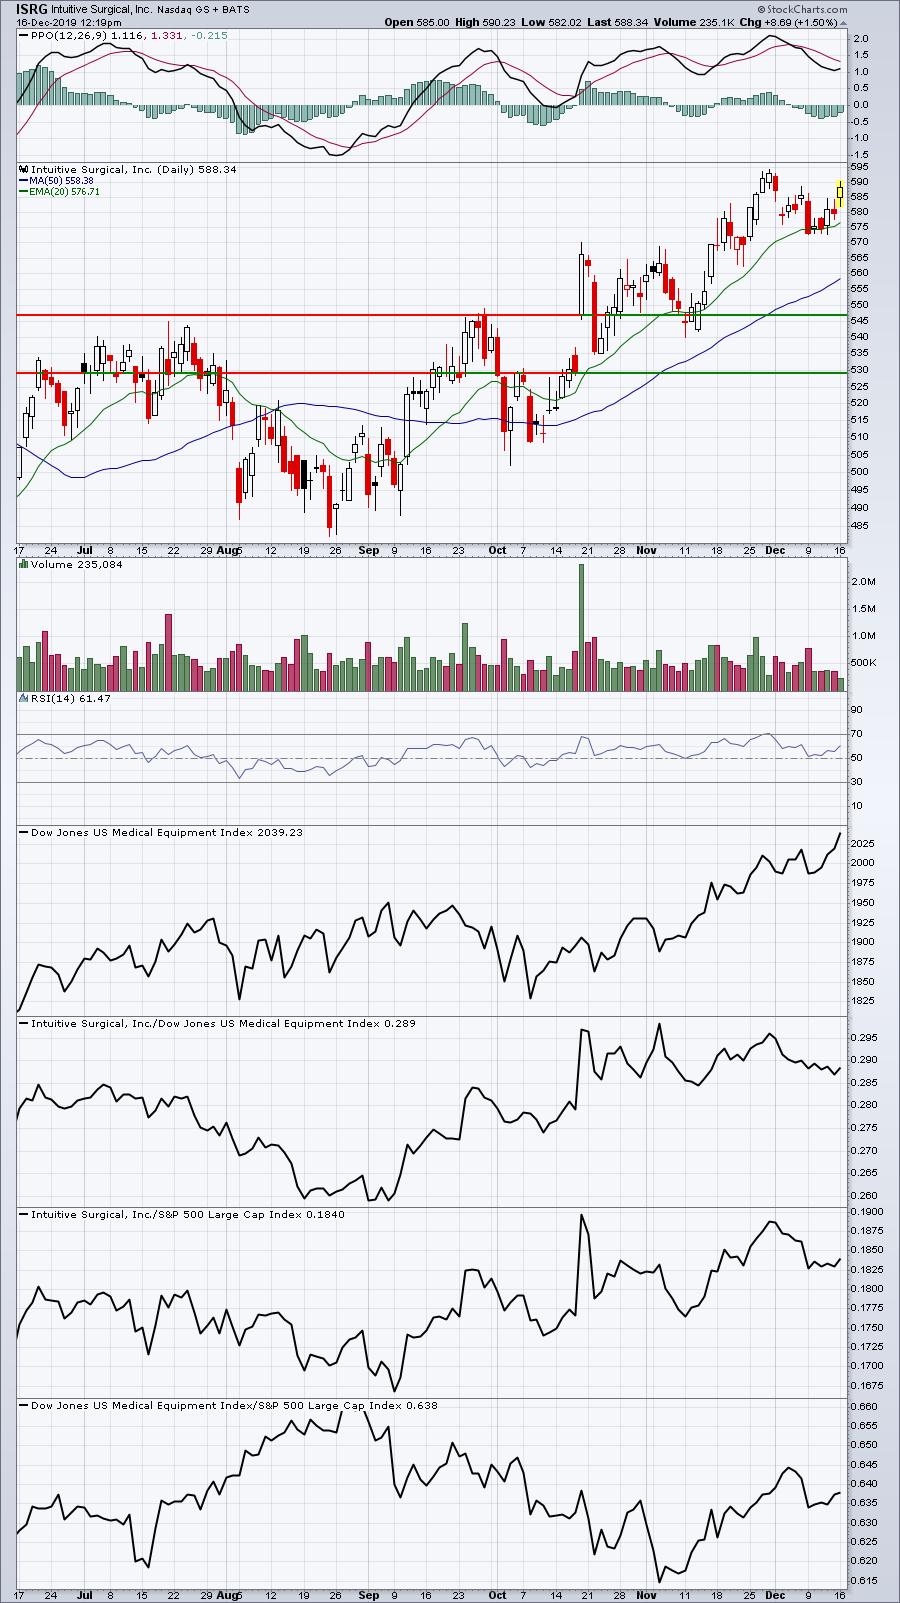
Gap support from earnings ranged from 547 (top) to 529 (bottom). Buying in this range would have turned out to be a rewarding strategy.
KSU:
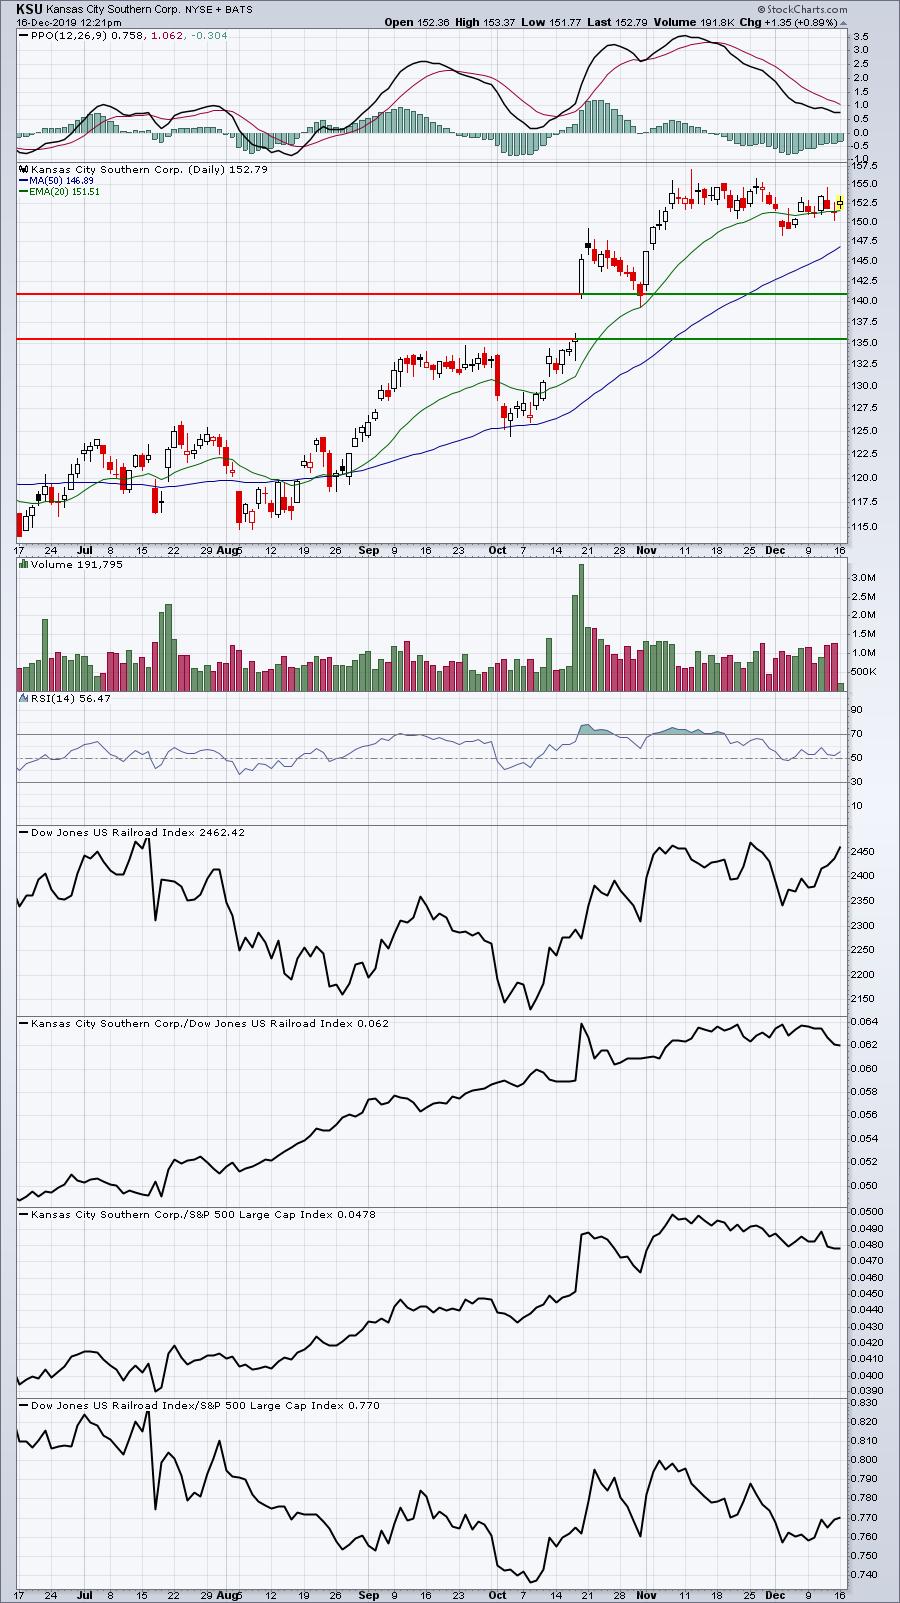
KSU ran from 136 to 149 within two days of its earnings report, but patience is what's necessary to allow a stock like this to drop back into the gap support zone from 141 (top) to 136 (bottom).
CNC:
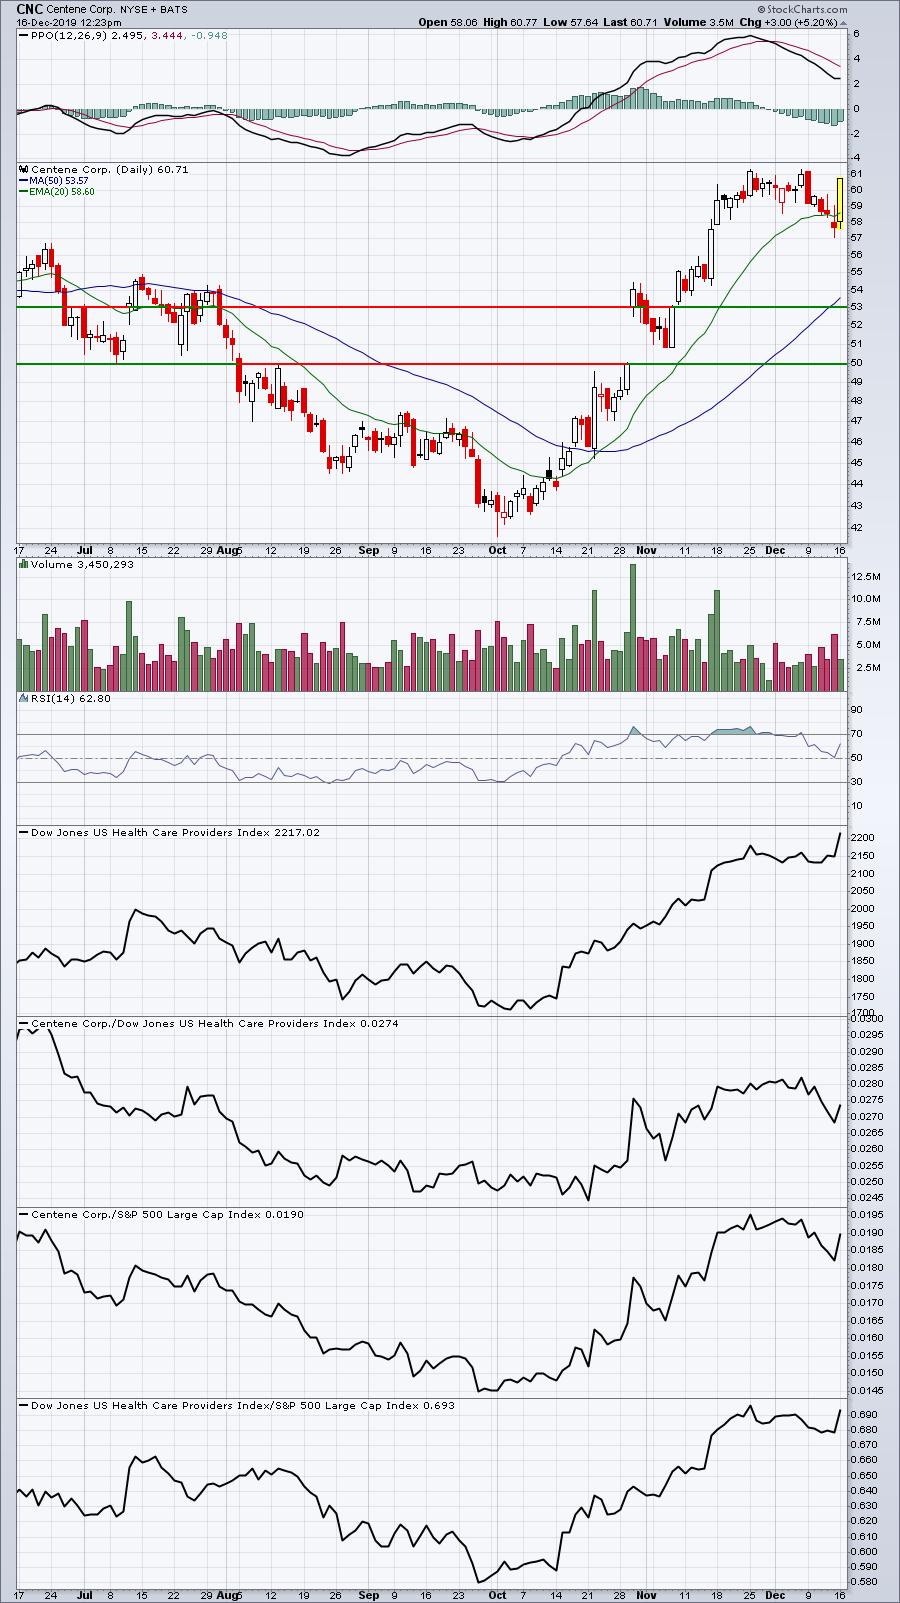
CNC also rewarded patient traders. I realize these ideas are with 20/20 hindsight, but as we look to potential future trades, this is exactly what we should be looking for.
Go back up and look at our Active Trade Alert (TPX). We alerted it just above 82 as it was trading in this same gap support zone. It's now recovering back toward our target price of 91.80. We want more trades like this one and we're going to talk about our trading strategy in a zero-commission environment later today at 4:30pm EST. I hope you can make it. If not, no worries, as we'll be recording the event.
Movers & Shakers
One big mover today is also a SECL stock and a portfolio stock, so I wanted to highlight it.
CROX:
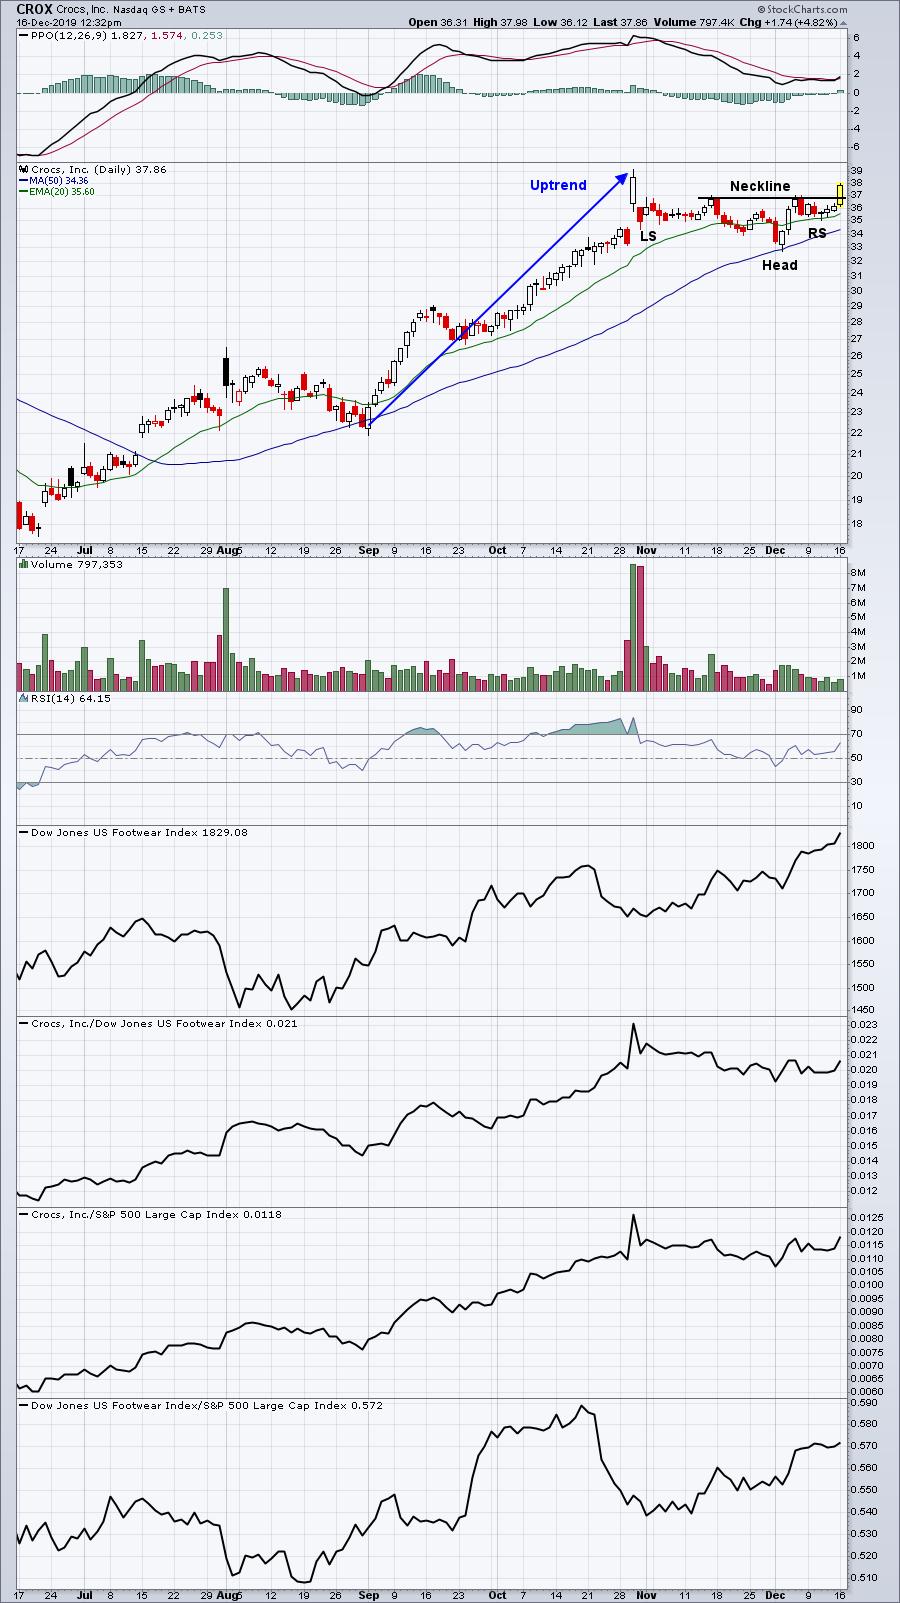
Here's another continuation pattern - the inverse head & shoulders - which followed a beautiful uptrend. CROX should be expected to make a measurement to approximately 41.00. The measurement of an inverse head & shoulders pattern is calculated from the neckline down to the depth of the inverse head. In this case, I'd look for a 4 point move above the neckline breakout. That would take CROX initially to the 41 level.
Earnings Reports
Here are the key earnings reports for this week, featuring stocks with market caps of more than $5 billion. I also include a few select companies with market caps below $5 billion. Finally, any portfolio stocks (or active trade alerts) that will be reporting results are highlighted in BOLD. Please make sure you check for earnings dates for any companies you own or are considering owning:
Monday, December 16:
HEI. Others below $5 bil: None
Tuesday, December 17:
FDX, CTAS, JBL. Others below $5 bil: NAV, WOR, SCS
Wednesday, December 18:
MU, GIS, PAYX, TTC. Others below $5 bil: MLHR, ABM
Thursday, December 19:
NKE, ACN, DRI, CAG, FDS. Others below $5 bil: SAFM, AIR
Friday, December 20:
KMX. Others below $5 bil: BB, WGO
Economic Reports
November empire manufacturing survey: 5.3 (actual) vs. 4.0 (estimate)
November PMI composite flash: 52.2 (actual) vs. 52.4 (estimate)
November housing market index: 76 (actual) vs. 70 (estimate)
Happy trading!
Tom