
EB Daily Market Report - Tuesday, December 17, 2019
Executive Market Summary
- We had another positive start to a trading session this morning
- The Volatility Index, which opened the month with a move to 18, has settled back to 12
- All major indices are higher, but small caps are pacing the advance
- Crude oil ($WTIC) is rallying again, up 1.26% to near $61 per barrel
- There was more positive housing news with both housing starts and building permits exceeding estimates
- The 10 year treasury yield ($TNX) is flat at 1.89%
- Sector leadership is found in energy (XLE) and financials (XLF); real estate (XLRE) lags
- Our alert TPX reversed nicely on Friday and is up 2% today
Market Outlook
The S&P 400 Mid Cap Index ($MID) has broken out on an absolute basis, but has been a very poor performer relative to the larger cap S&P 500 ($SPX) throughout 2019. While today's breakout is nice, I really want to see its relative strength hold key support and begin to trend higher:
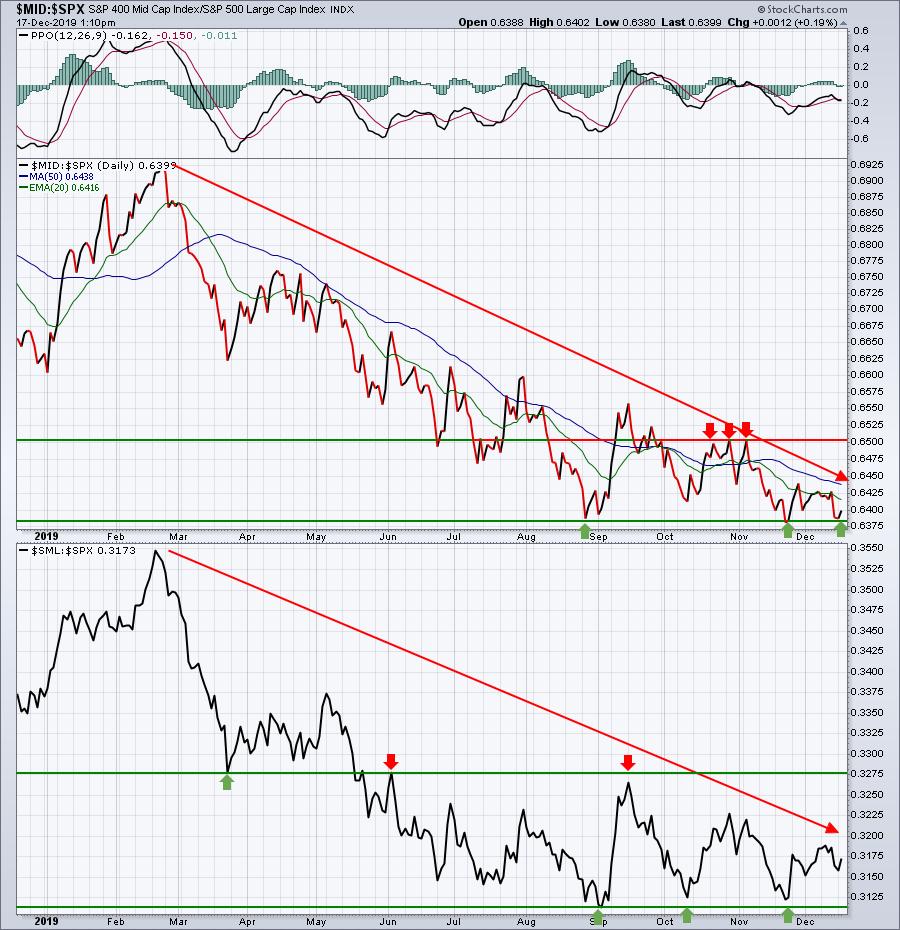
While small caps ($SML) have strengthened a bit on a relative basis over the past month or so, mid caps have not. I'd like to see both begin to clear relative resistance in order to confirm the idea that our economy will improve throughout 2020.
Sector/Industry Focus
I featured renewable energy ($DWCREE) yesterday as it recently had cleared its 20 day EMA and 50 day SMA. It also successfully negotiated price resistance near 110. After a bit of brief selling this morning, the DWCREE is higher now by 0.30% and one of its best performing stocks, SolarEdge Technologies, Inc. (SEDG), appears to have printed the right side of a cup:
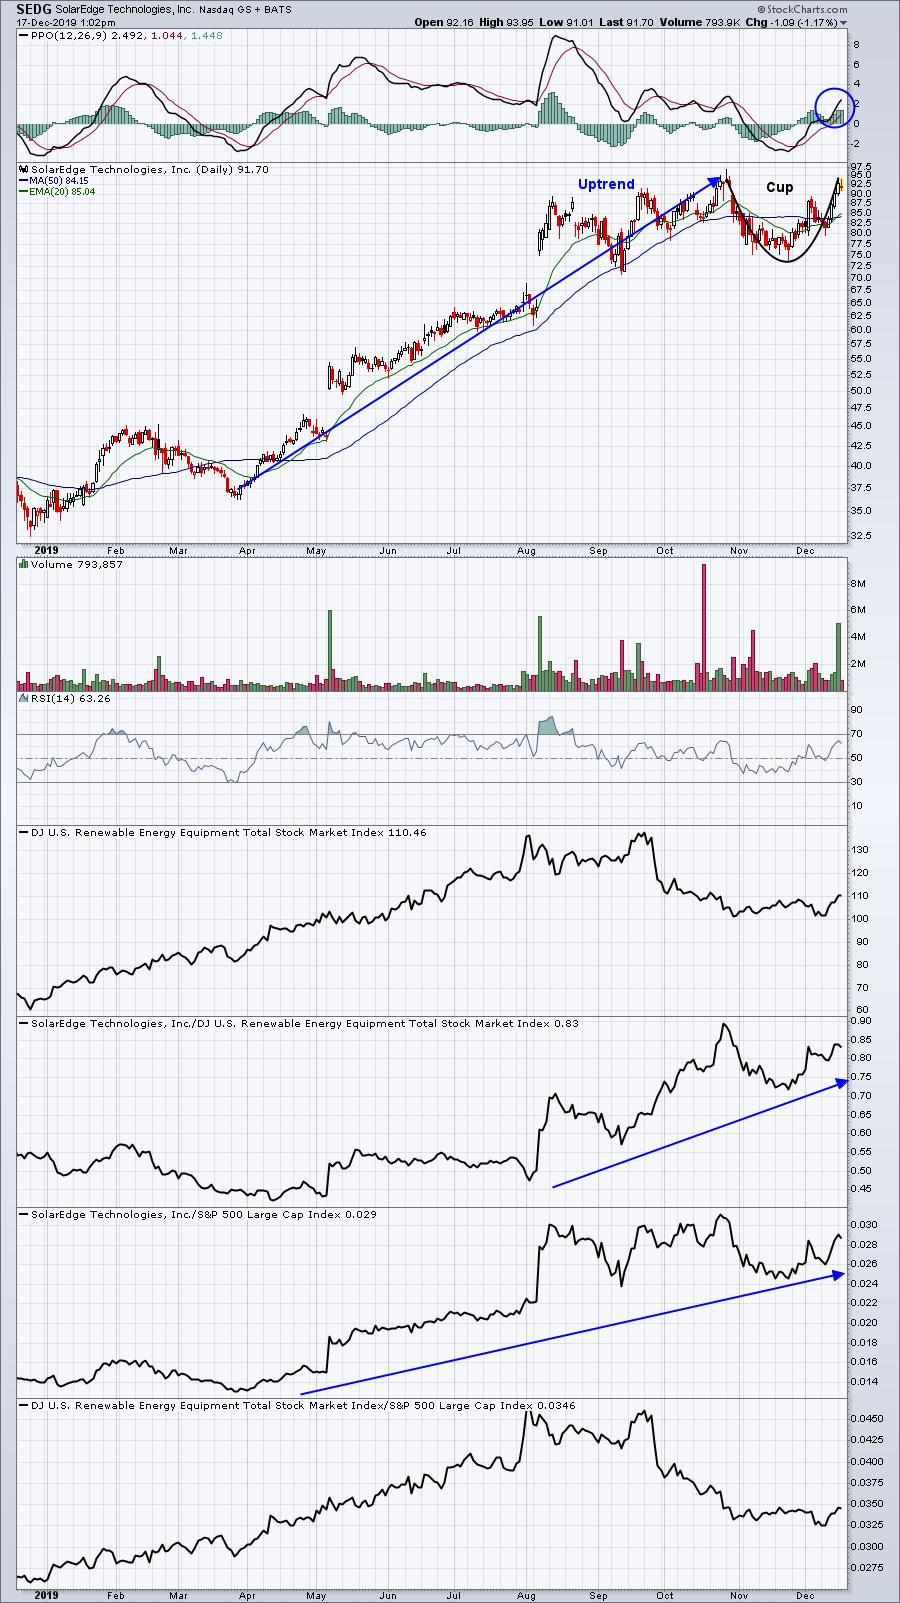
Please understand that SEDG is an extremely volatile stock and should not be considered for a trade unless you have a strong stomach and a very high tolerance of risk. A handle back to the 20 day EMA would present an aggressive trading opportunity.
Active Trade Alerts
We have one active trade alert currently:
TPX (-0.08%) - reports earnings on February 12. TPX pulled back earlier, but is relatively flat. Not a bad day after two solid days.
Strong Earnings ChartList (SECL)
A great way to find strong trading candidates that could offer up a really nice bounce opportunity is to pull up the SECL in summary form and then sort by clicking on the "% chg" column. That will bring them up from best performing to worst performing today. Click on that column again and it will reverse the order and list the worst performers first. That's what I've done and here are the results as of 12:40pm:
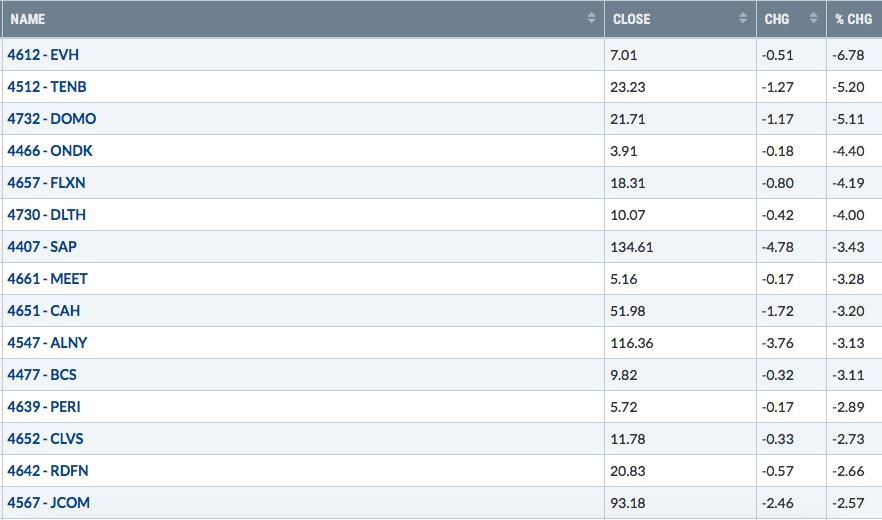
Here are the most interesting from a potential trade perspective:
TENB:
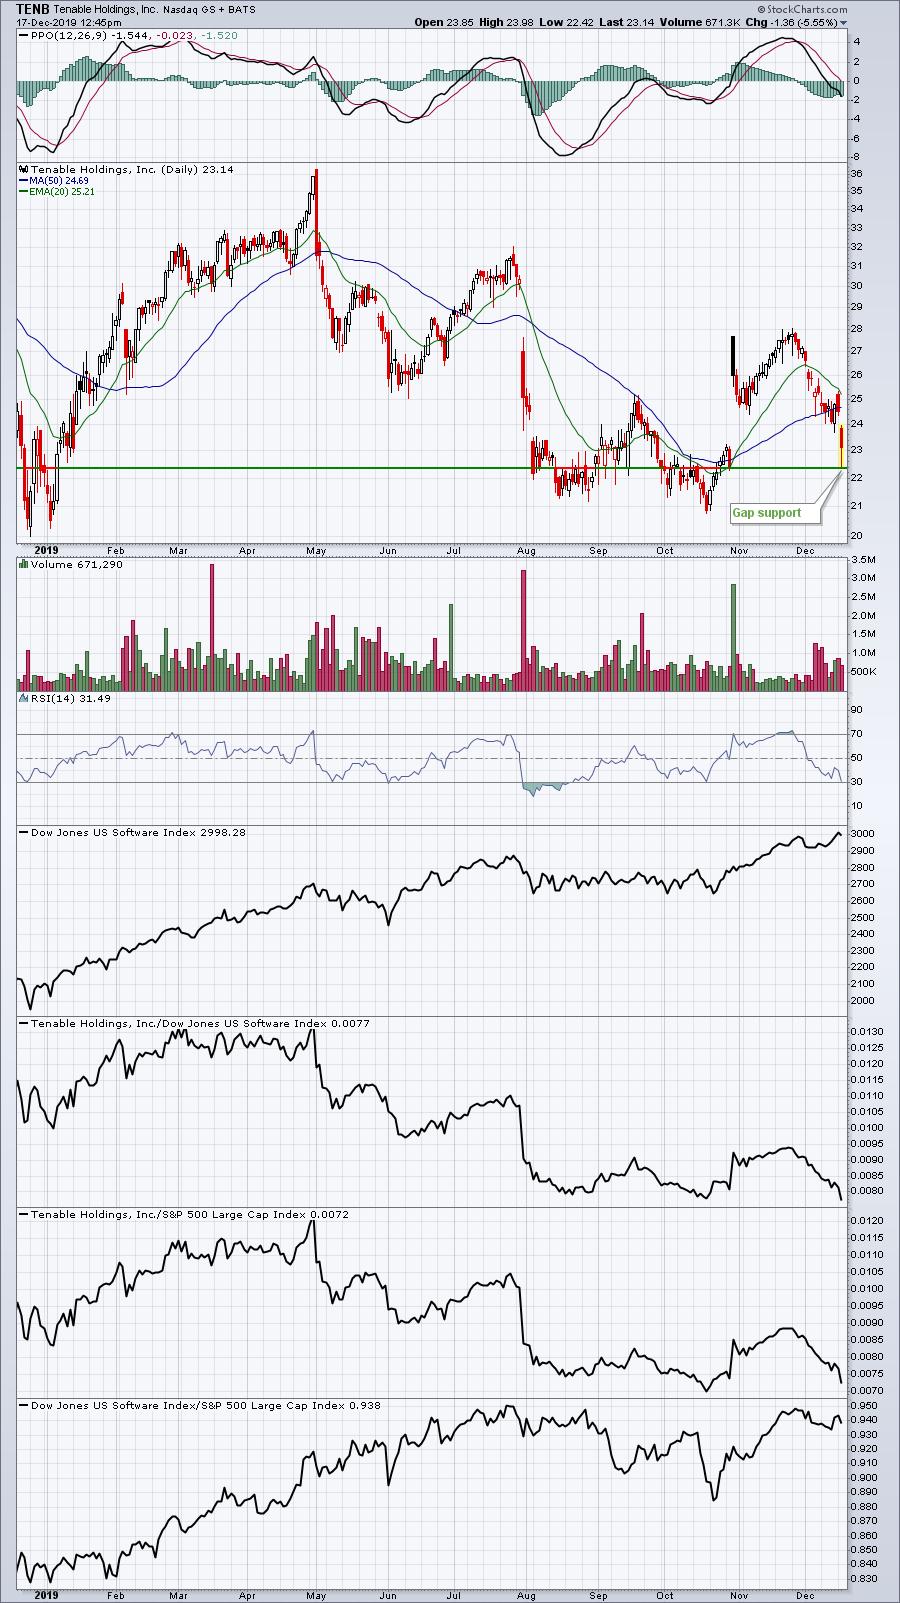
While TENB has clearly been in a downtrend, if it's solid earnings report in late-October has truly reversed that downtrend, we should see key support levels hold. That first support level is gap support at 22.40. Today's low was 22.42.
DOMO:
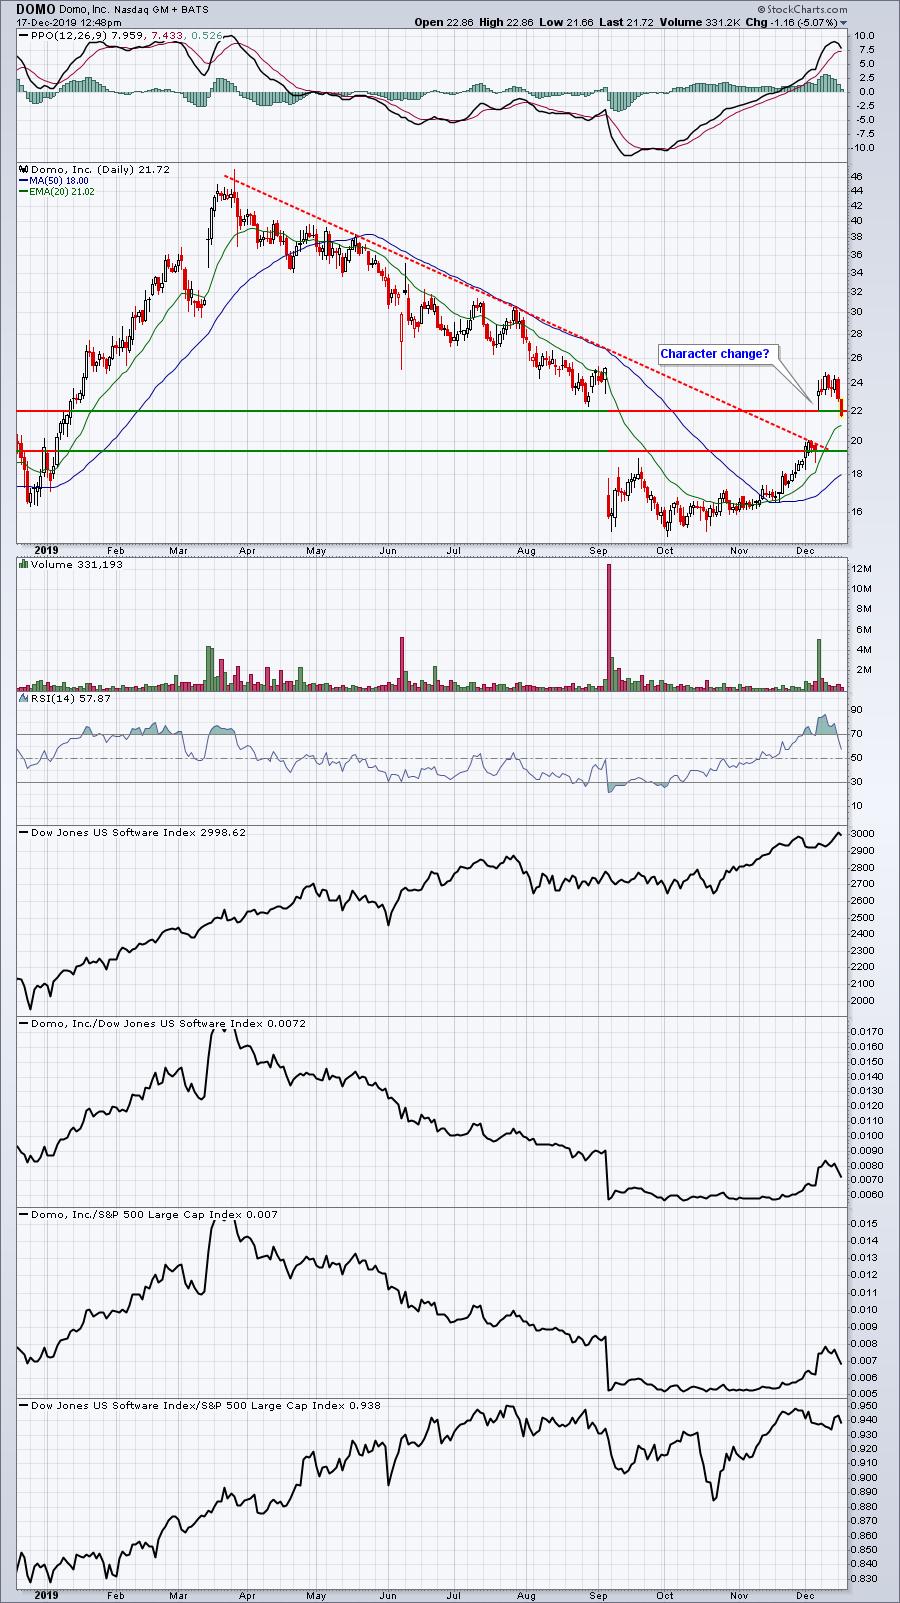
DOMO saw an excellent reaction to its latest quarterly earnings report, but today it's falling beneath the intraday low from December 6th. A hammer would be a bullish development so watch to see if buyers return later this afternoon.
FLXN:
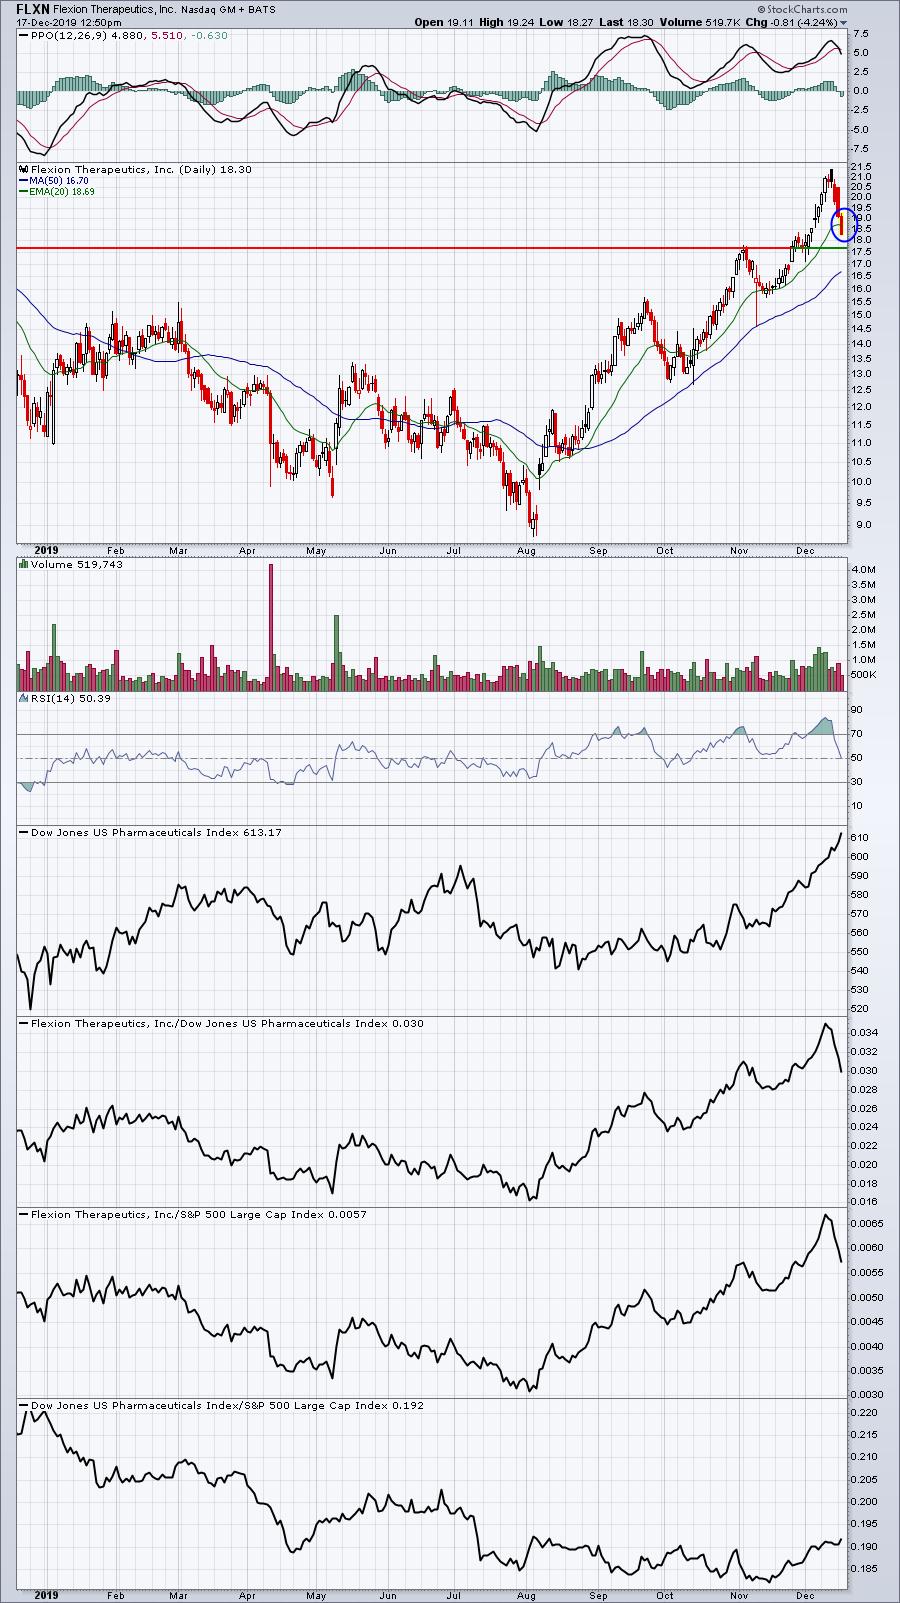
FLXN has been a great performer since early-August and recent selling episodes have been supported by buyers at the rising 20 day EMA. Today, we're falling a bit below that level and toward a key price support level near 17.60. A reversal in this area with a close back above the 20 day EMA would be bullish.
CAH:
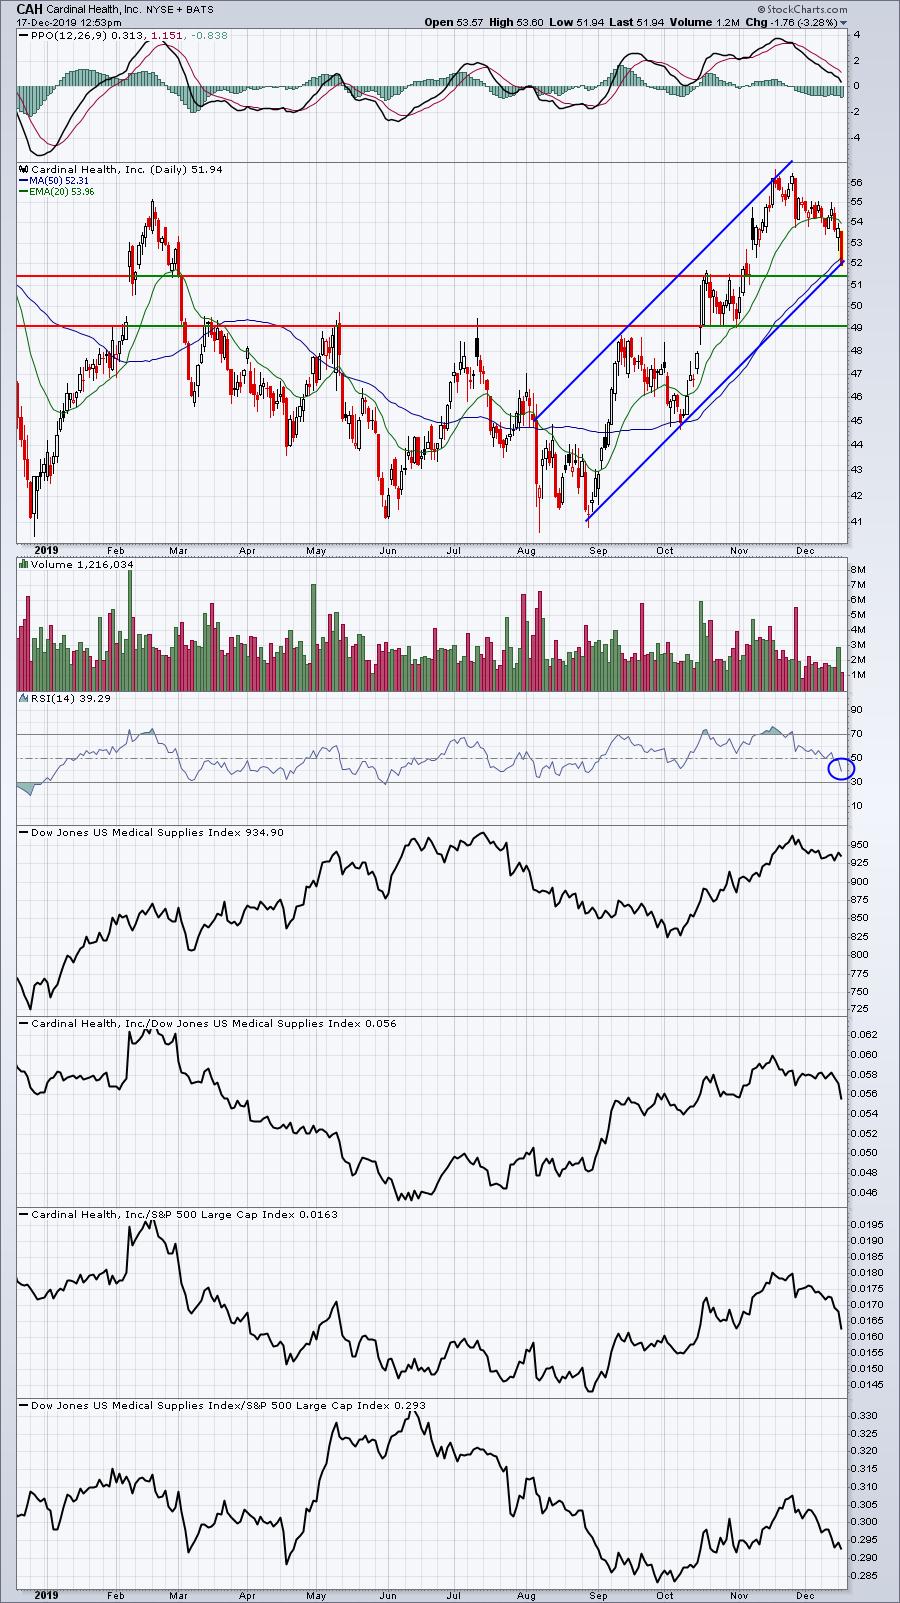
CAH is testing channel support and is nearing key gap support at 51.43. Accumulating CAH in this area isn't a bad strategy. That last pullback bottomed near 49, so accumulating down to that level would work with a closing stop just beneath it.
JCOM:
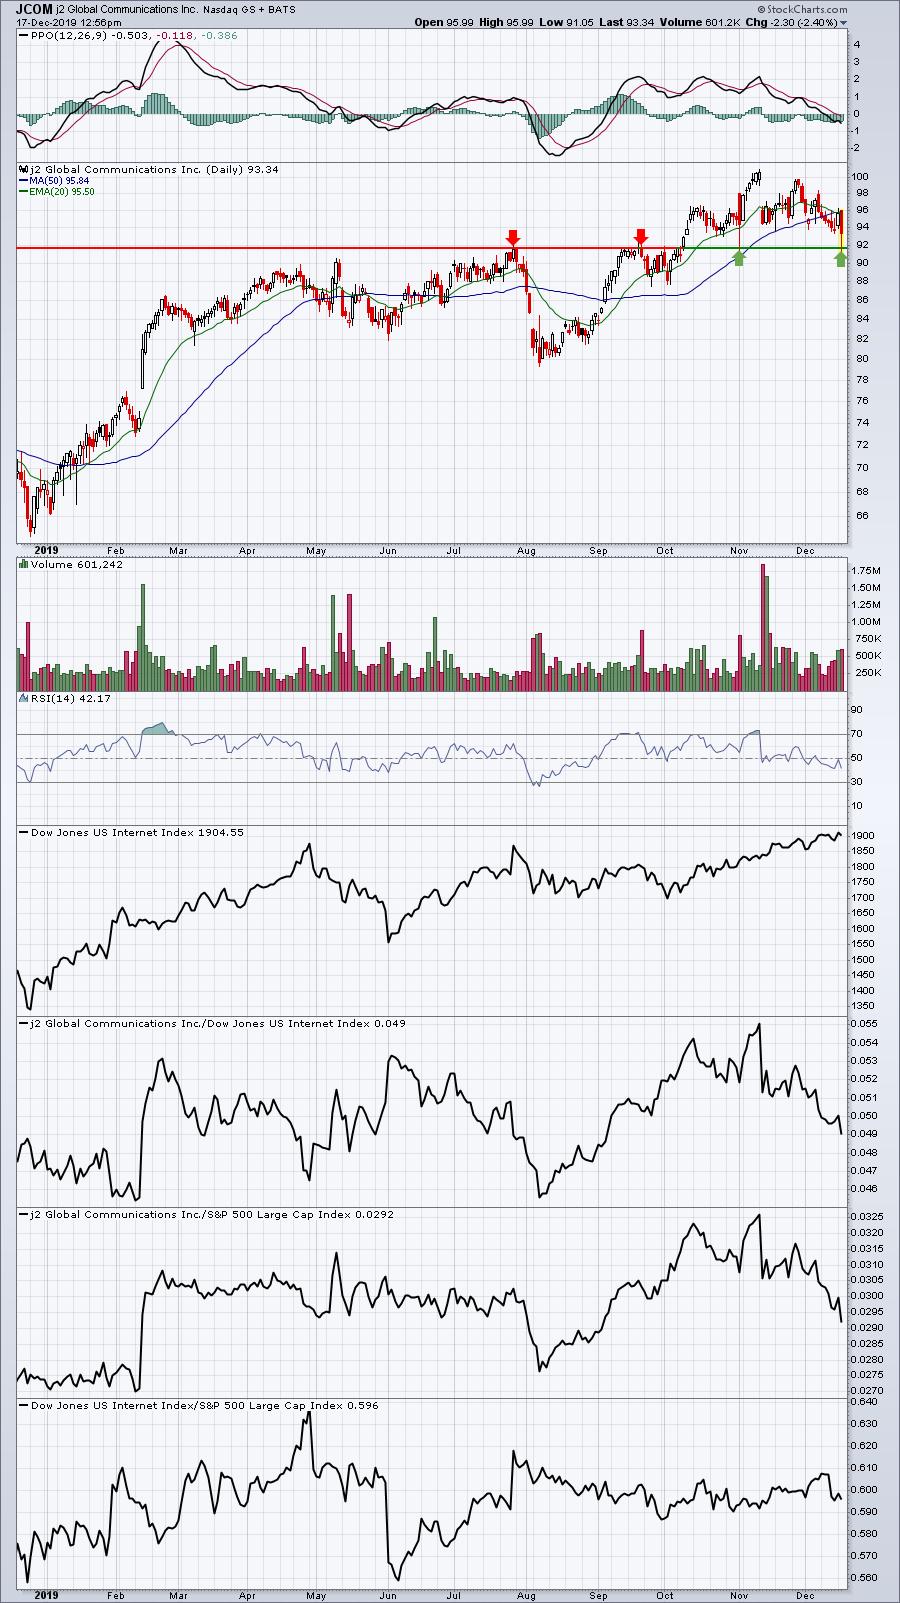
JCOM tested price support near 92 for the second time after doing so about 7 weeks ago. Volume is heavy so I'd be careful on any close beneath 92, but thus far we're seeing a reversal at that level.
Movers & Shakers
From the S&P 500 top performers list today:
NFLX:
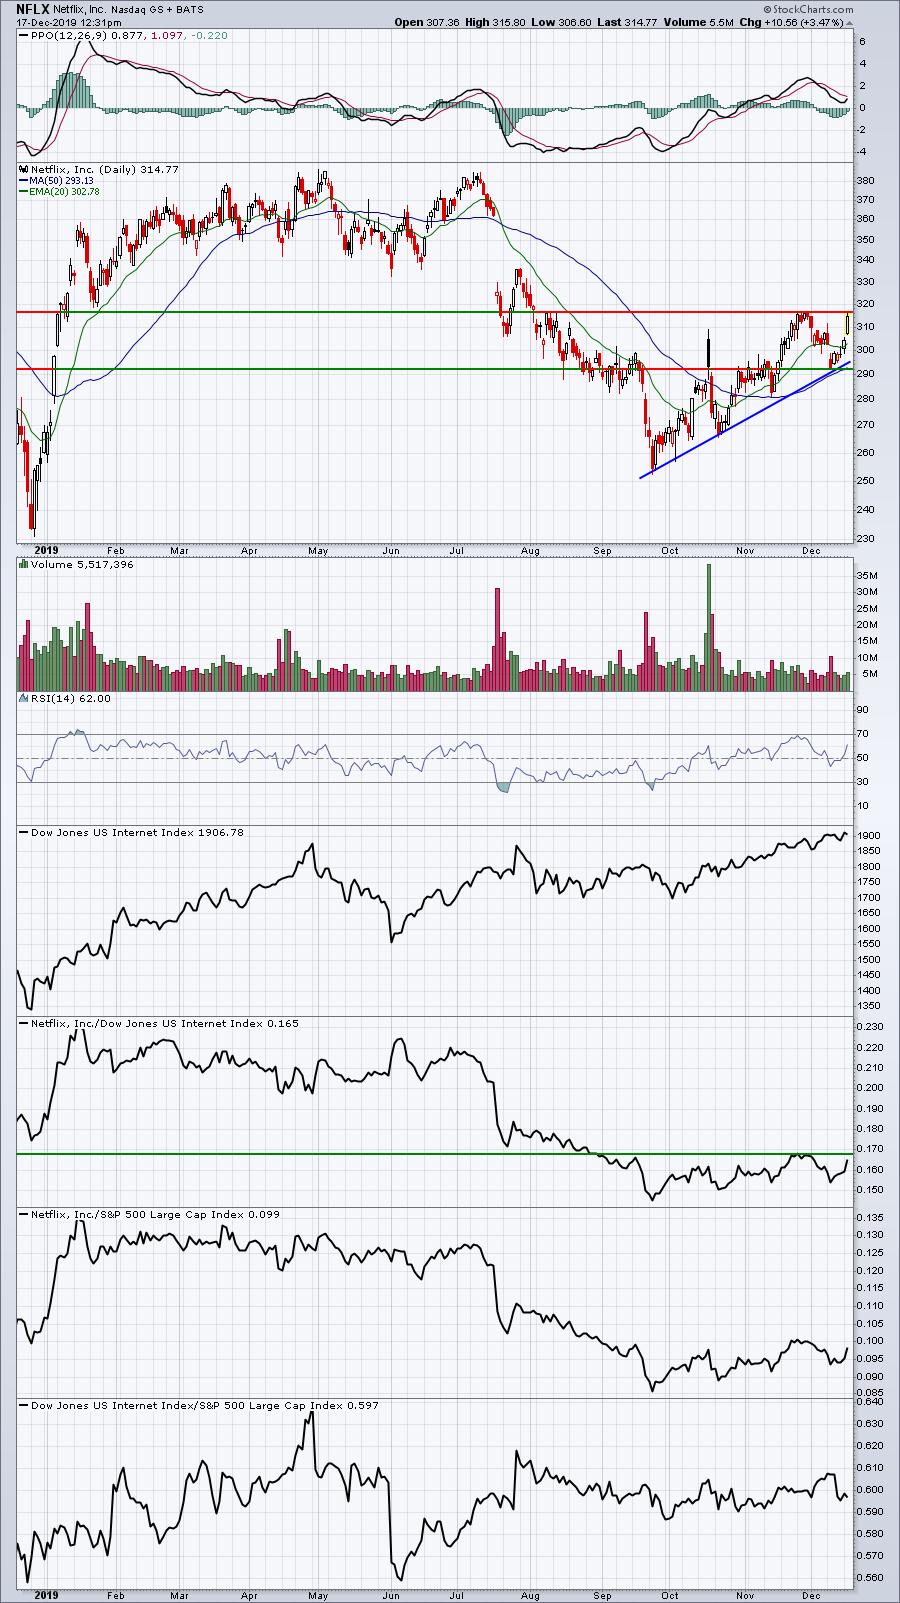
NFLX is approaching overhead resistance and is in a nice uptrend. My biggest concern here has been its inability to show leadership in the internet space ($DJUSNS). If NFLX can clear overhead resistance on both an absolute and a relative basis, my opinion would begin to change.
AAP:
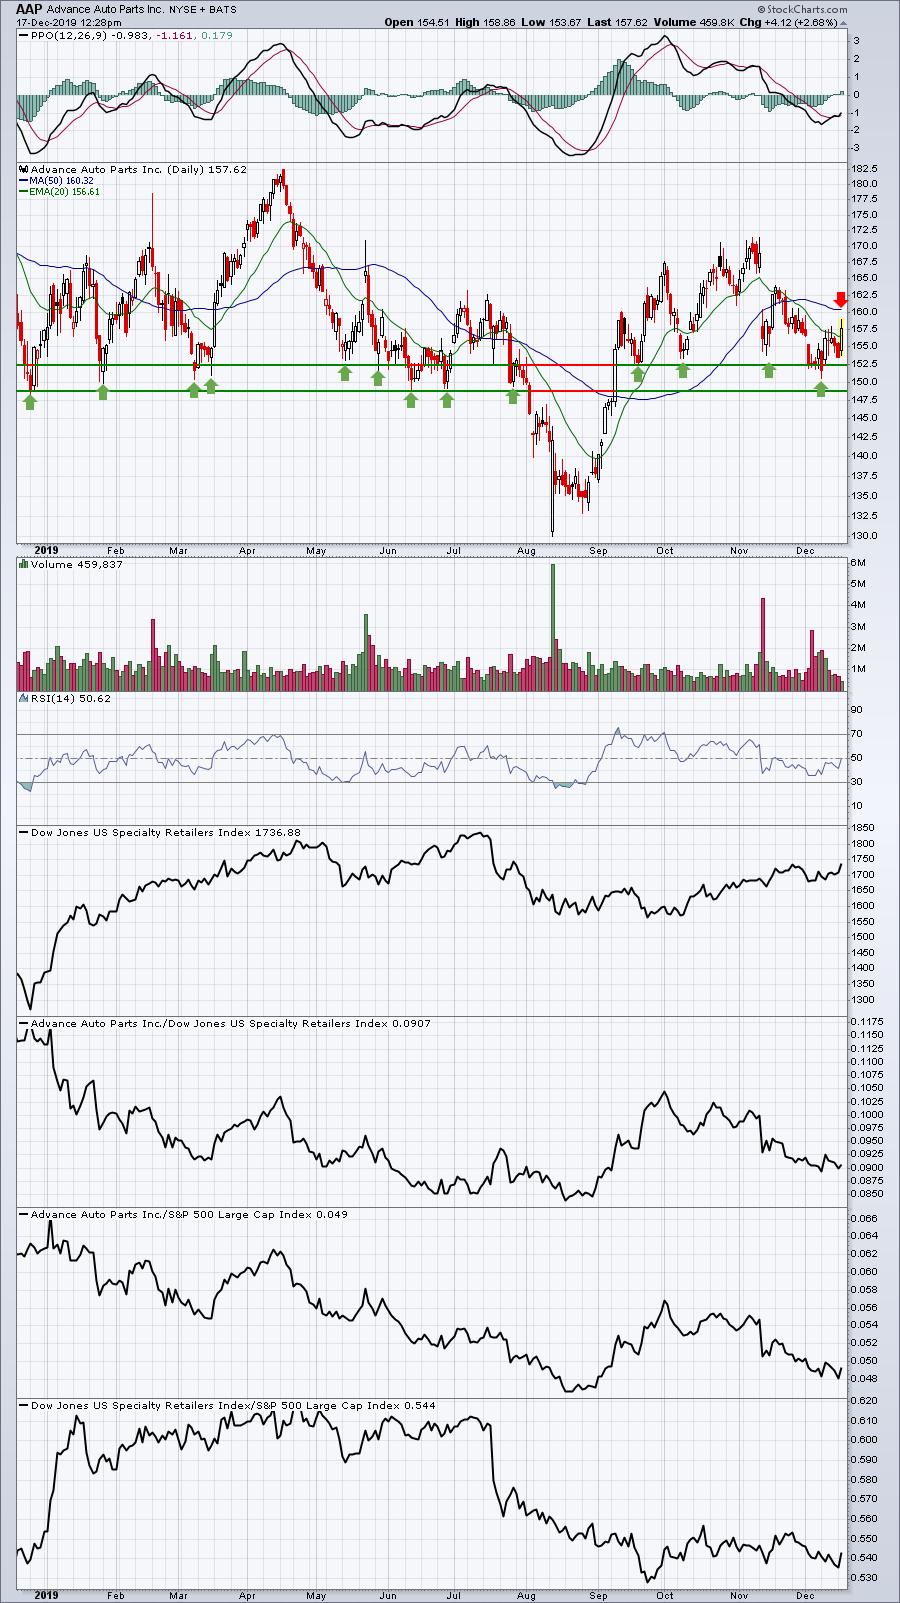
I think it's pretty clear that 149.00-152.50 is a very solid support level for AAP. It's been a relative underperformer in specialty retail, so keep a very close eye on that support area. However, today's strength is carrying AAP just above its 20 day EMA, where it's failed on several occasions the past few weeks. Can AAP confirm a close above that 20 day EMA today?
SO:
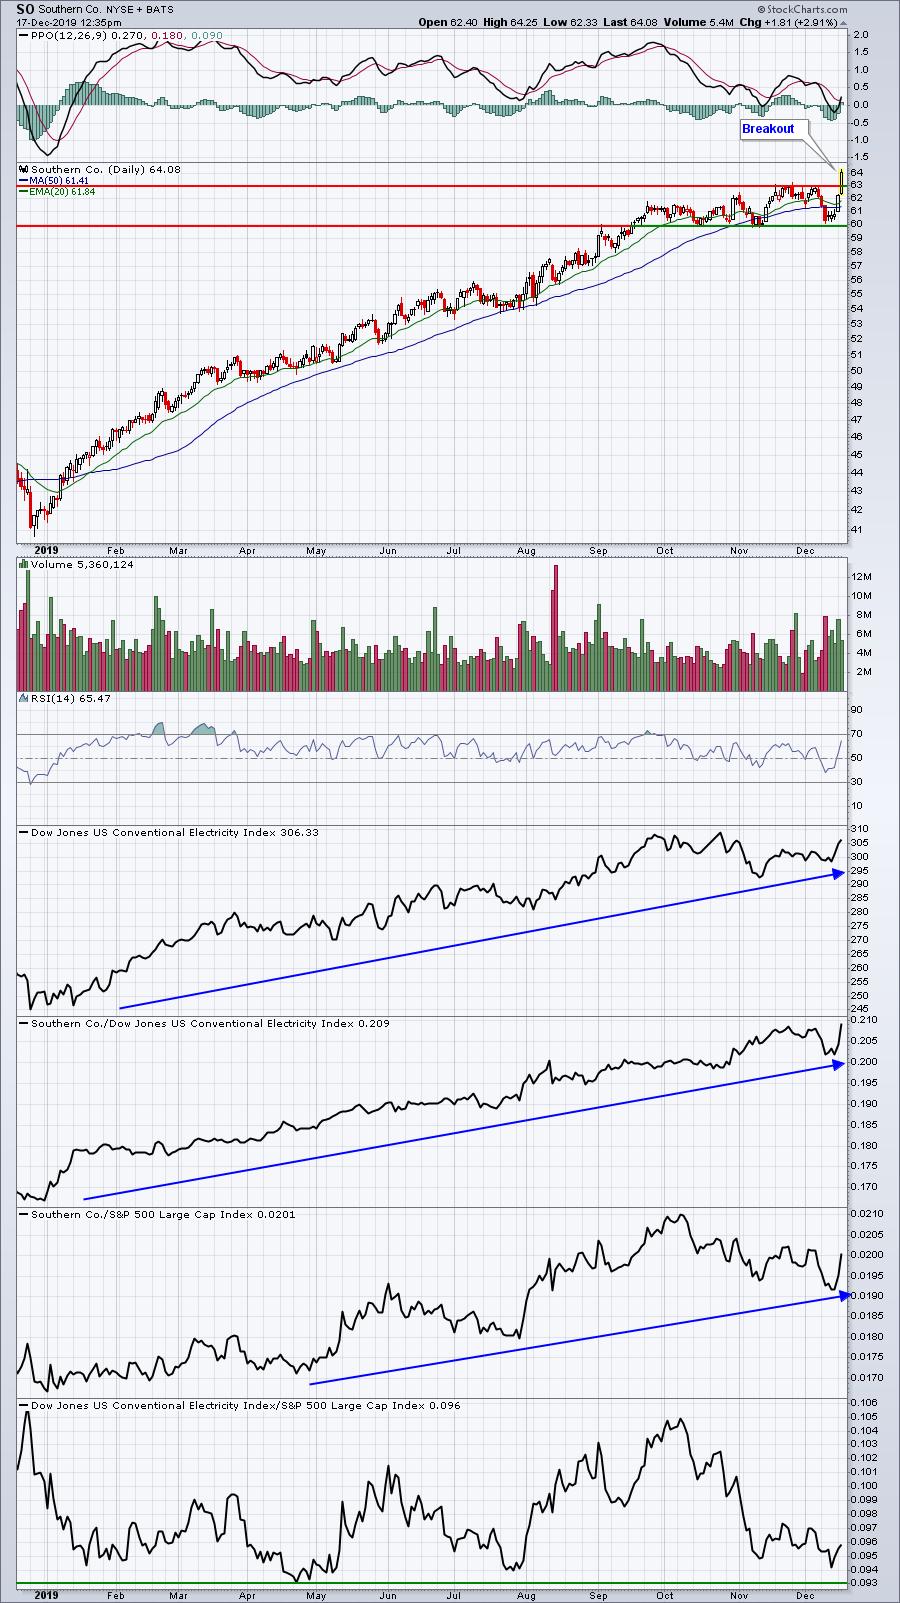
SO is a more defensive-oriented stock, from the utilities sector (XLU). While it should move higher in a good market environment, it also could provide a nice hedge in the event the stock market sells off as defensive stocks generally outperform during periods of market weakness. SO also sports a nice 4.00% dividend.
Earnings Reports
Here are the key earnings reports for this week, featuring stocks with market caps of more than $5 billion. I also include a few select companies with market caps below $5 billion. Finally, any portfolio stocks (or active trade alerts) that will be reporting results are highlighted in BOLD. Please make sure you check for earnings dates for any companies you own or are considering owning:
Tuesday, December 17:
FDX, CTAS, JBL. Others below $5 bil: NAV, WOR, SCS
Wednesday, December 18:
MU, GIS, PAYX, TTC. Others below $5 bil: MLHR, ABM
Thursday, December 19:
NKE, ACN, DRI, CAG, FDS. Others below $5 bil: SAFM, AIR
Friday, December 20:
KMX. Others below $5 bil: BB, WGO
Economic Reports
November housing starts: 1,365,000 (actual) vs. 1,340,000 (estimate)
November building permits: 1,482,000 (actual) vs. 1,410,000 (estimate)
November industrial production: +1.1% (actual) vs. +0.9% (estimate)
November capacity utilization: 77.3% (actual) vs. 77.4% (estimate)
Happy trading!
Tom