
EB Daily Market Report - Thursday, December 19, 2019
Executive Market Summary
- Futures were near the flat line, but early action shows us that traders are supporting equities
- All of our major indices are higher, albeit fractionally
- Several economic reports were released this morning and they mostly disappointed
- The TNX initially gapped higher to that key 1.95% level, but it's now down a basis point to 1.91%
- Carmax (KMX), a member of our Model portfolio, will be our first portfolio component stock to report earnings this quarter; KMX reports tomorrow before the opening bell
- Utilities (XLU) is the only sector lower today; real estate (XLRE) and communication services (XLC) are leading
- Our alert TPX is up again and we've decided to take profits on 25% of our shares, with details of other selling levels below
Market Outlook
The S&P 500 has done very well throughout this latest rally, no doubt. But that doesn't mean it's the best ETF to park your money during a bull market advance. Many times, the more aggressive QQQ (which tracks the NASDAQ 100, or $NDX) is the better spot. Or at least you should consider owning a portion of the QQQ. Here's the latest chart, showing a relative breakout on the QQQ:
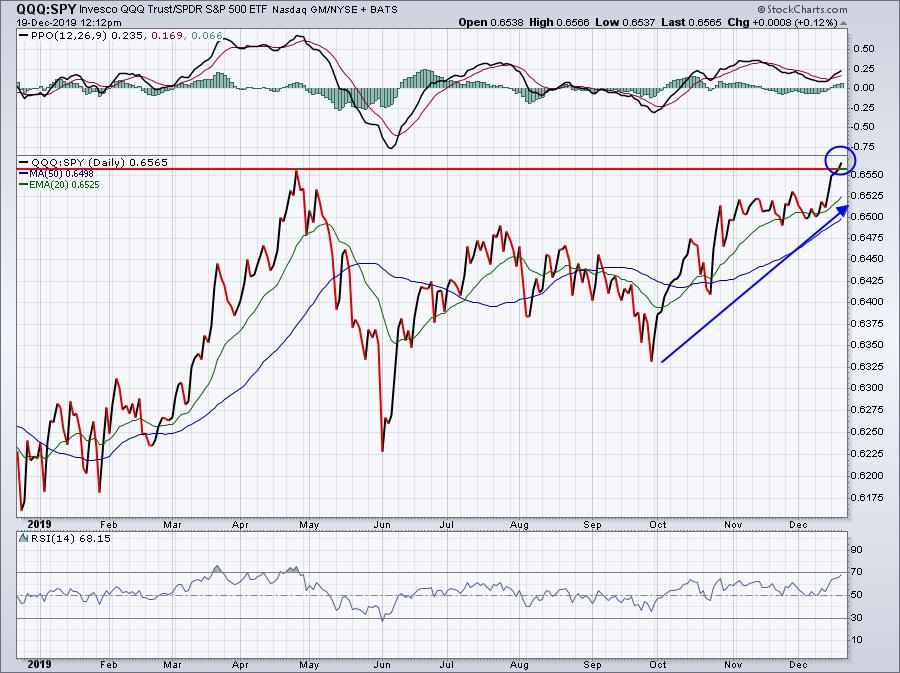
The QQQ:SPY ratio is at a new high and you can see from the blue directional line that the QQQ has been leading throughout this bull market advance. That's an incredibly bullish signal as it tells us that traders are in a "risk on" mode and it's this appetite for risk that sustains bull markets.
Sector/Industry Focus
We definitely want to continue to focus on healthcare stocks (XLV) as the group is strengthening vs. the benchmark S&P 500. Outperforming the S&P 500 becomes much easier if you're trading stocks/ETFs that are relative leaders. Check out the current relative strength chart of XLV:
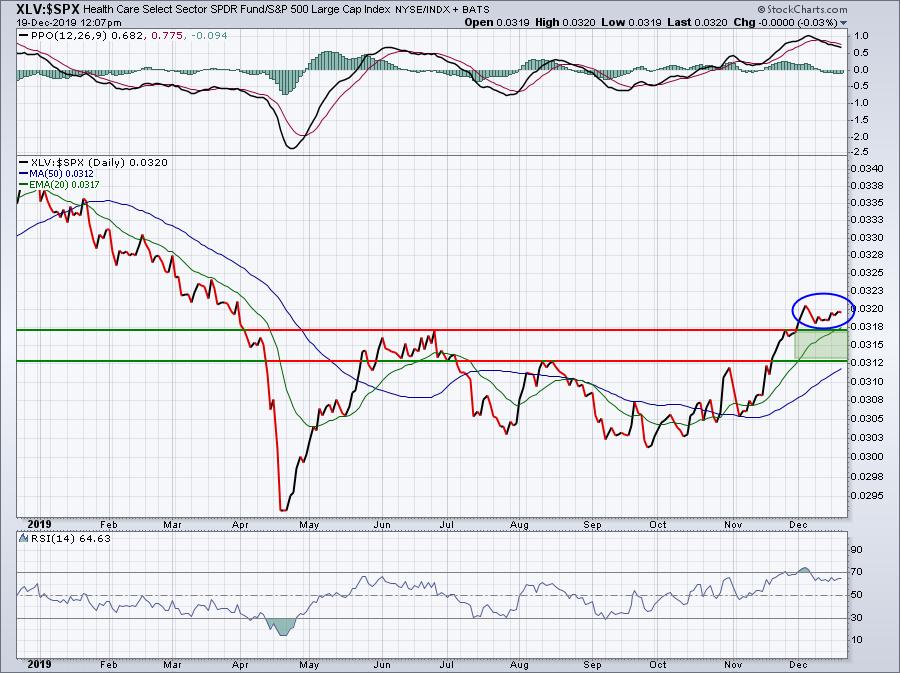
During the next profit taking stretch on the S&P 500, the XLV may hold up well on a relative basis. But if it doesn't, I'll be watching the green shaded area above for relative support.
Active Trade Alerts
We have one active trade alert currently:
TPX (+1.46%) - reports earnings on February 12. TPX is climbing closer and closer to our target. As I mentioned yesterday, taking profits from here up to our target reduces the risk of a top and a return back to support near 82.50. For our purposes, we will sell in 4 stages. We'd sell 25% of shares at current price (89.46) and sell the other 75% in three stages - at 90.00, 91.00 and at 91.80 (our original target). This is the type of strategy we will employ more now that we're in a zero-commission trading environment.
Strong Earnings ChartList (SECL)
I simply reviewed SECL charts this morning and wanted to mention the following:
ACAD:
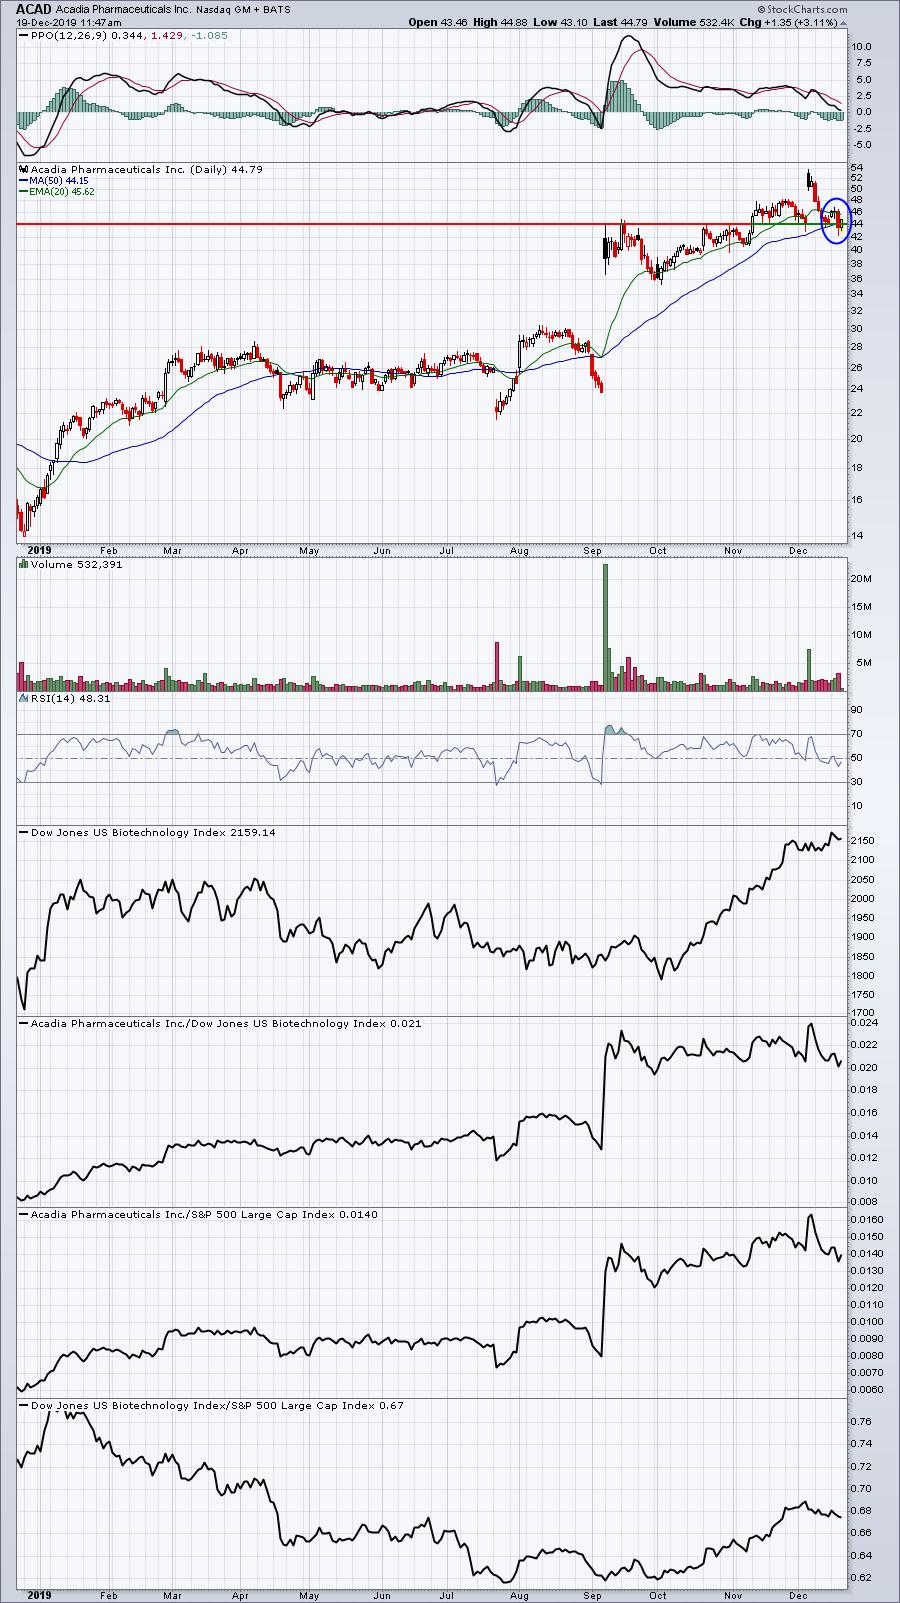
I provided ACAD in yesterday's DMR, so I just wanted to follow up today. ACAD did close just beneath support yesterday, but a reversing candle today would provide a solid argument for entry (for those with a high risk tolerance). I could easily see a return trip to the recent high near 54. That's a 20% move. Price support, 50 day SMA, PPO centerline, RSI in the 40s. These are all typical areas where we see rebounds. Just remember to keep your stop in play.
BYND:
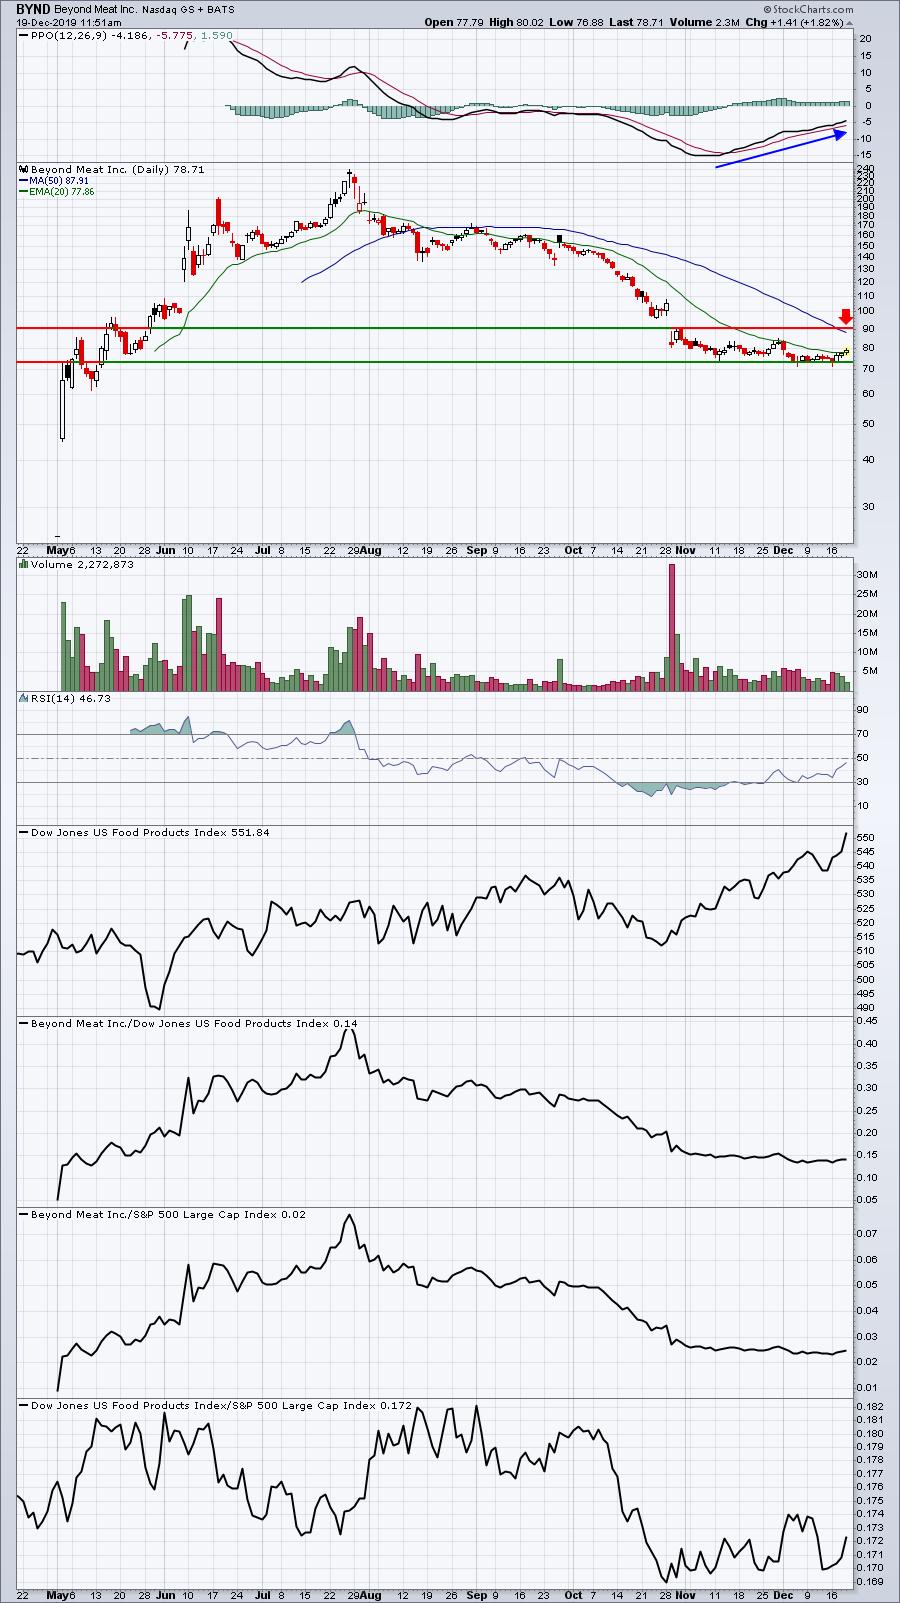
First, this is another very volatile stock, so you'll need a crash helmet to trade it. It seems as though the downward momentum has been slowing on BYND. The positive divergence (higher PPO with lower price) confirms it. That doesn't mean a downtrend is over, but it can result in a temporary halt to the selling. I've marked a key price resistance level to watch. I wouldn't be surprised to see BYND make a run for 90 as it's trying to close above its 20 day EMA for the first time since September.
Movers & Shakers
I looked at ETFs today and saw that the S&P Retail ETF (XRT) was among the top ETF SCTR movers today and I found the chart interesting. Check it out:
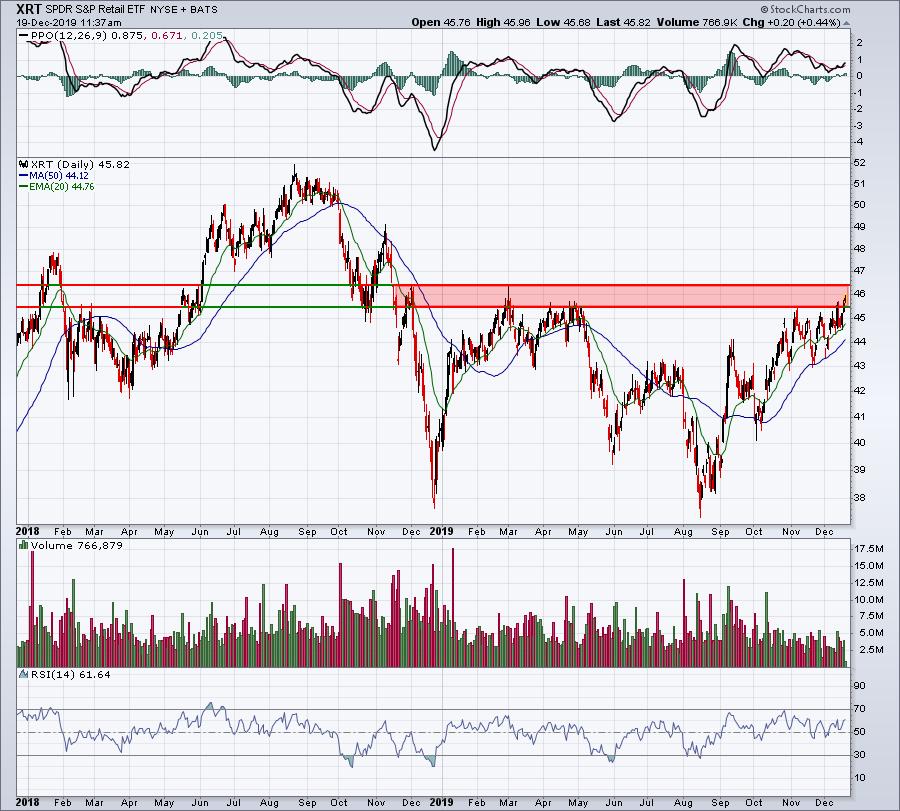
Over the past 13 months, a clear resistance zone between 45.50-46.50 has formed. Watching this resistance will be important, because consumer discretionary (XLY) has lagged the benchmark over the past several weeks. A breakout in a widely-diversified retail ETF, however, could completely change things in that area.
Earnings Reports
Here are the key earnings reports for this week, featuring stocks with market caps of more than $5 billion. I also include a few select companies with market caps below $5 billion. Finally, any portfolio stocks (or active trade alerts) that will be reporting results are highlighted in BOLD. Please make sure you check for earnings dates for any companies you own or are considering owning:
Thursday, December 19:
NKE, ACN, DRI, CAG, FDS. Others below $5 bil: SAFM, AIR
Friday, December 20:
KMX. Others below $5 bil: BB, WGO
Economic Reports
Initial jobless claims: 234,000 (actual) vs. 221,000 (estimate)
December Philadelphia Business Outlook Survey: 0.3 (actual) vs. 8.5 (estimate)
November existing home sales: 5,350,000 (actual) vs. 5,450,000 (estimate)
November leading indicators: +0.0% (actual) vs. +0.1% (estimate)
Happy trading!
Tom