
EB Daily Market Report - Thursday, January 2, 2020
Executive Market Summary
- Futures were strong to open 2020, though we do have bifurcated action
- Small caps and mid caps are underperforming as they did throughout much of 2019
- Boeing (BA), Intel (INTC), and Apple (AAPL) are leading the Dow Jones to another all-time record high
- The 10 year treasury yield ($TNX) is down 4 basis points to 1.88%
- Aggressive sectors are leading today's advance - all five are higher; all defensive sectors are lower
- Our sole active trade is VC, which is higher today
Market Outlook
Happy New Year!!! As we start a brand new year and decade, the short-term uptrend remains intact as you can clearly see from this hourly S&P 500 chart:
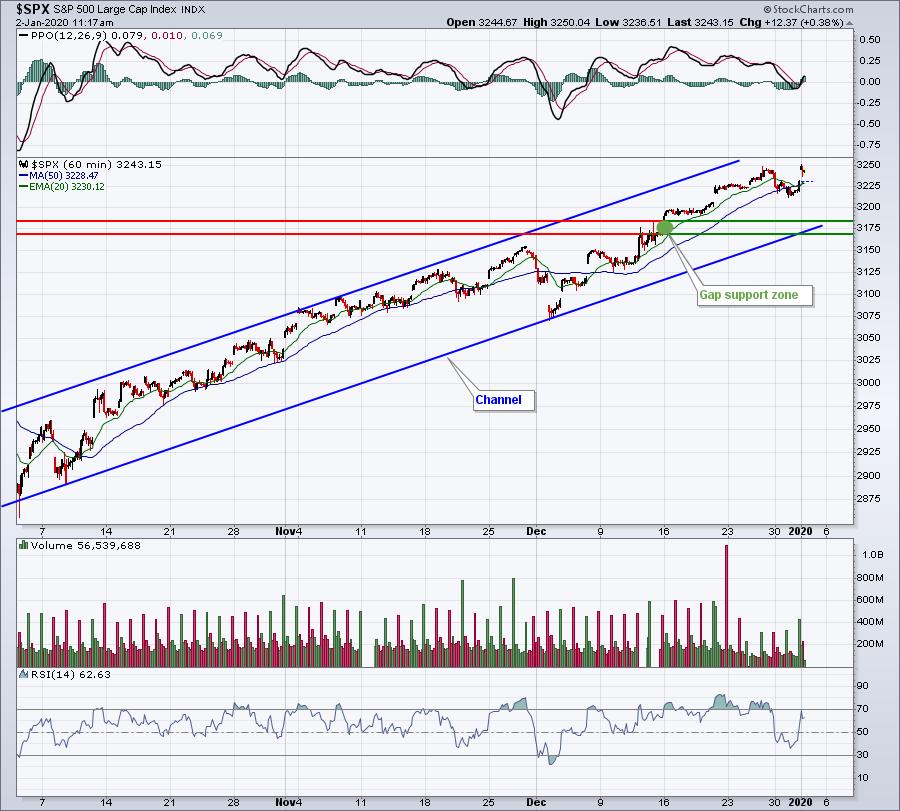
I wouldn't be shocked to see the current rally take the S&P 500 into the 3300-3350 range by January 18th, which ends the most bullish historical period of the year (October 27th close through January 18th close) - dating back to 1950.
Sector/Industry Focus
Despite a big drop in the 10 year treasury yield ($TNX) today, banks ($DJUSBK) are slightly higher. This group is a great example of what can happen when a key price resistance level is finally cleared:
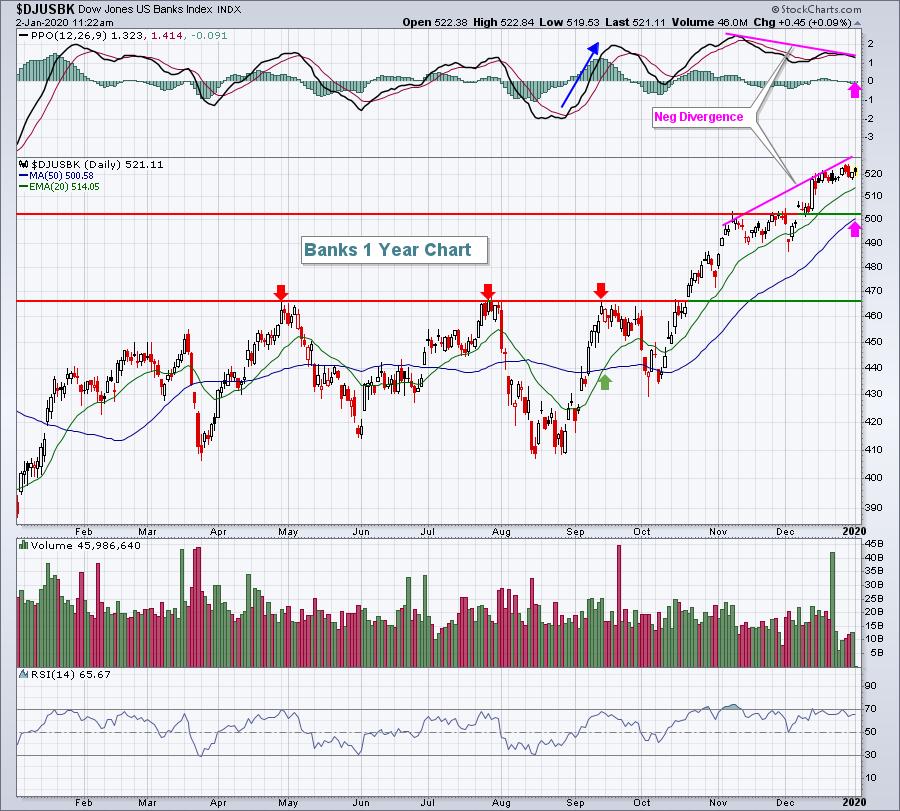
This rally is beginning to look a bit unstable as a rather ugly negative divergence has emerged. These divergences don't guarantee us weakness ahead. Rather, they simply suggest that we be a bit more cautious. In other words, I wouldn't be adding to banks at this point. I expect banks to perform well in 2020, so any short-term weakness down to test its rising 50 day SMA would likely present a great opportunity for entry.
Active Trade Alerts
We have one active alert as follows:
VC (+1.32%) - reports earnings on February 19. VC is trading at a four day high today, but its first test still awaits at the declining 20 day EMA, currently at 89.33.
Strong Earnings ChartList (SECL)
Our SECL currently has 363 annotated charts on it, but we'll be deleting a number of stocks that will be reporting upcoming quarterly results in the 2nd half of January.
I was simply reviewing charts from the SECL and found these two very interesting at current levels.
CRSP:
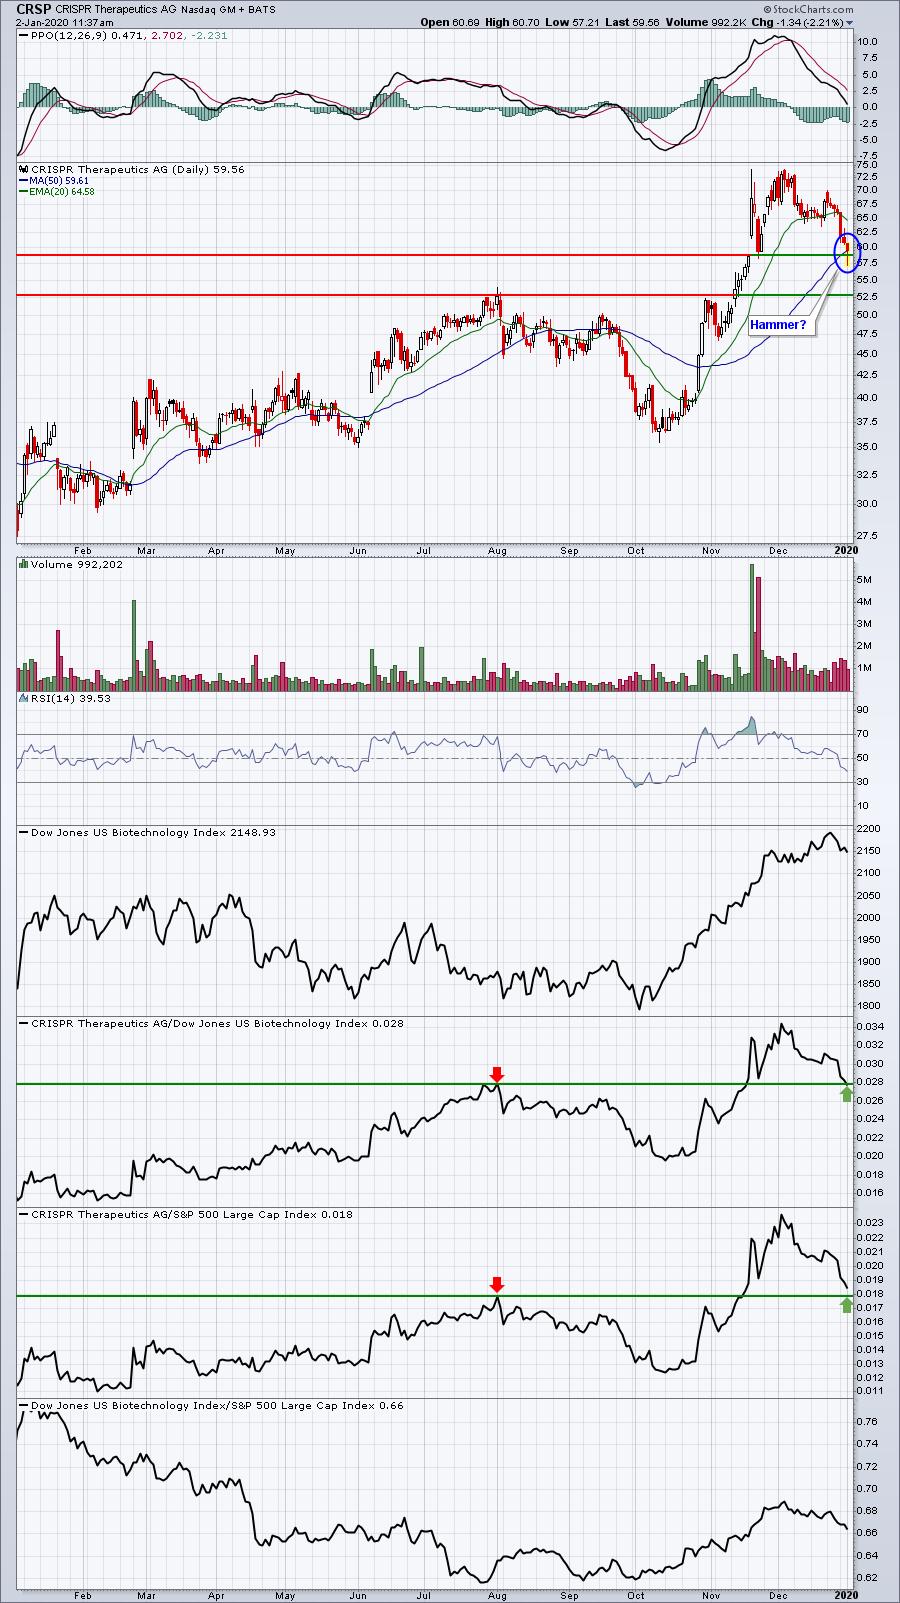
CRSP is trying to reverse off its earlier intraday low and the attempt is at both gap support and the 50 day SMA. It's also interesting that CRSP is at relative support vs. biotechs ($DJUSBT) and the benchmark S&P 500. CRSP is a smaller biotech and should be recognized as a very volatile and potentially risky trade.
OMF:
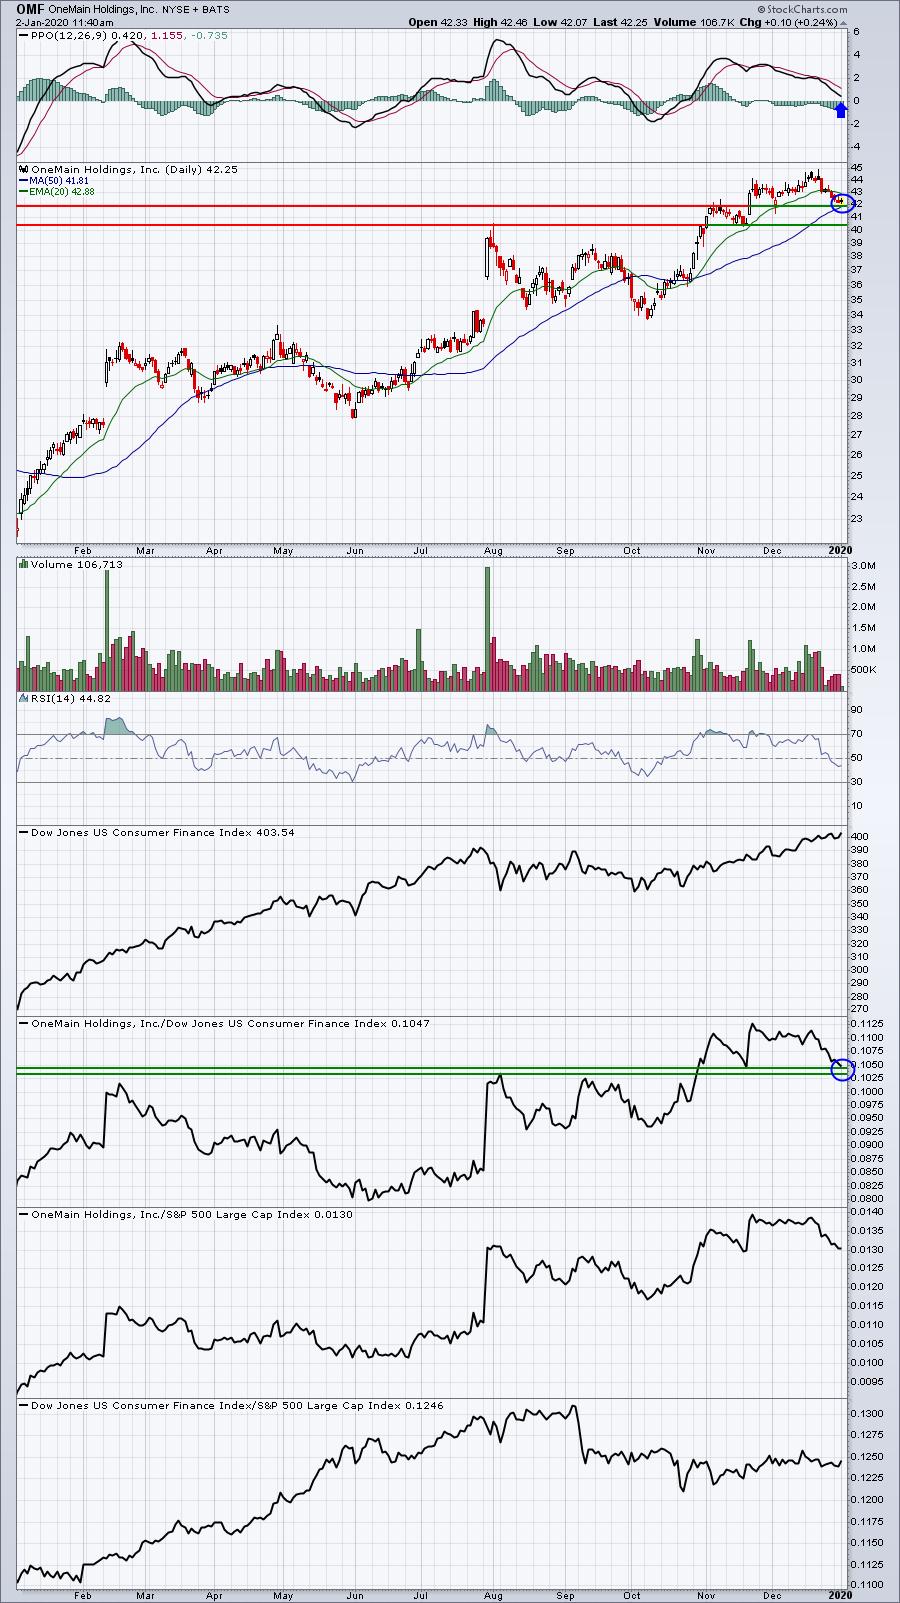
The blue circles show OMF hitting both absolute and relative price support levels. Its RSI is also at 44, a popular pivot area for uptrending stocks. It seems the reward to risk is solid for OMF at its current price.
Movers & Shakers
Here are two additional stocks to consider - one on a breakout and the other testing its 50 day SMA after massive recent strength.
MELI:
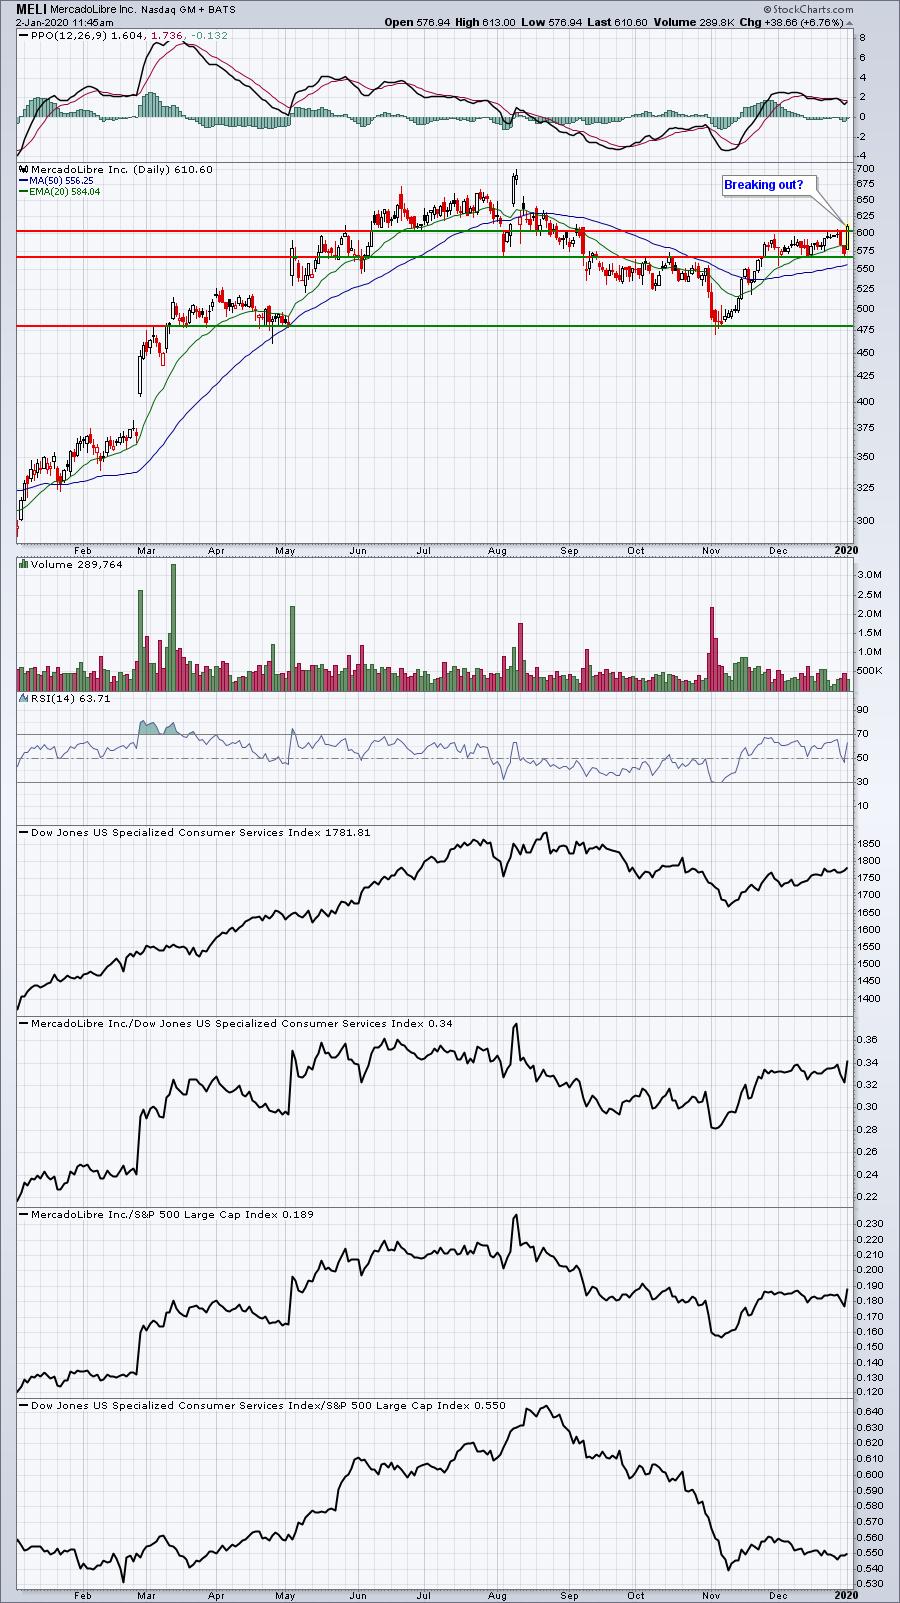
The key here could be the volume this afternoon. Increasing volume and a strong finish would be quite bullish and would likely lead to another test of 700.
ATRS:
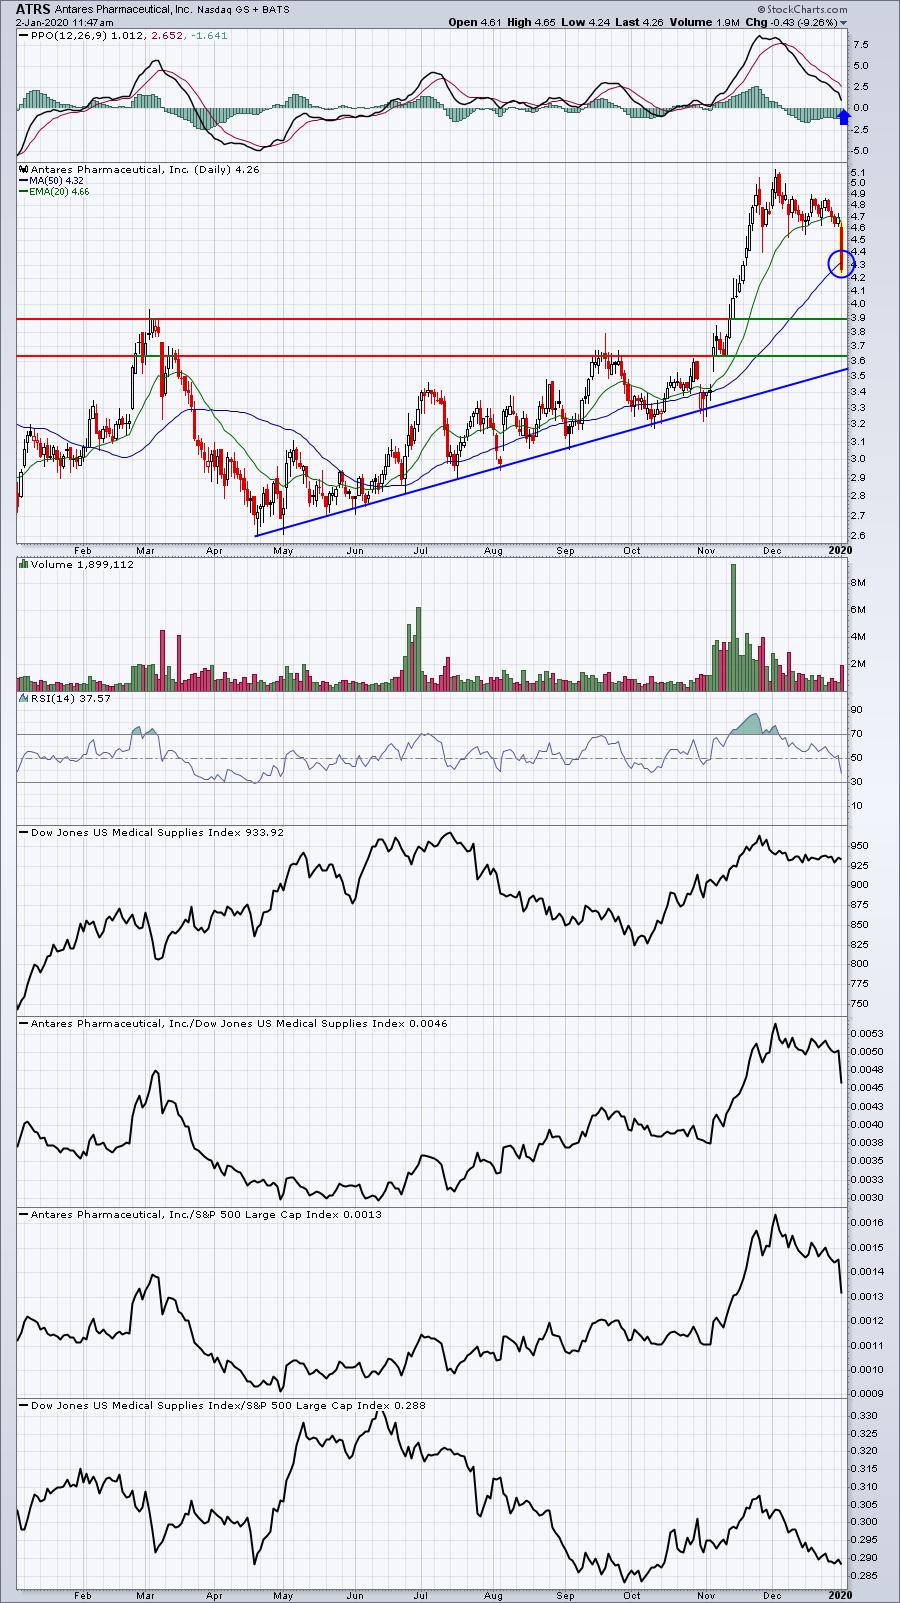
We saw a major advance in November that was accompanied by significant volume, typically a sign of accumulation. Many buying at the top, however, are not excited by the most recent selling episode, which can lead to an overshoot to the downside. The 50 day SMA is the first key level to watch for a reversal, but others would be price support closer to 3.90, and then the combination of price, gap and trendline support near 3.70. I'd be very surprised if we see a close beneath 3.60-3.70. The closer that ATRS gets to the that level, the better the reward to risk. Like CRSP earlier, however, ATRS is a biotech and can be extremely volatile and risky.
Earnings Reports
Here are the key earnings reports for this week, featuring stocks with market caps of more than $5 billion. I also include a few select companies with market caps below $5 billion. Finally, any portfolio stocks (or active trade alerts) that will be reporting results are highlighted in BOLD. Please make sure you check for earnings dates for any companies you own or are considering owning:
Thursday, January 2:
None
Friday, January 3:
LW
Economic Reports
Initial jobless claims: 222,000 (actual) vs. 222,000 (estimate)
December PMI manufacturing index: 52.4 (actual) vs. 52.5 (estimate)
Happy trading!
Tom