
EB Daily Market Report - Monday, January 6, 2020
Executive Market Summary
- For a second straight day, futures were weak with buyers returning throughout the day
- The NASDAQ has turned positive, with the other major indices lower, though well off their intraday lows
- Communication services (XLC) and energy (XLE) are today's sector leaders, while industrials (XLI) lag
- Truckers ($DJUSTK) and railroads ($DJUSRR) are both down more than 1%, keeping pressure on the XLI
- The 10 year treasury yield ($TNX) was down 2 basis points earlier, but now is higher by 2 basis points
- Several retailers are strong, including Gap, Inc. (GPS), which is breaking to a 3 1/2 month high
- Our active trade alerts, VC and SBH, are mixed
Market Outlook
We'll get our latest jobs information on Friday when the latest monthly nonfarm payrolls are released. I believe this is the single most important economic report as 1/2 of the Fed's mandate is to maximize employment. The other is to stabilize prices. In my opinion, there is no bigger signal of an impending recession than seeing the 12 month rate of change (ROC) drop below zero. Over the past 70 years, this signal has been right EVERY SINGLE TIME. No exceptions. Currently, here's how this chart looks:
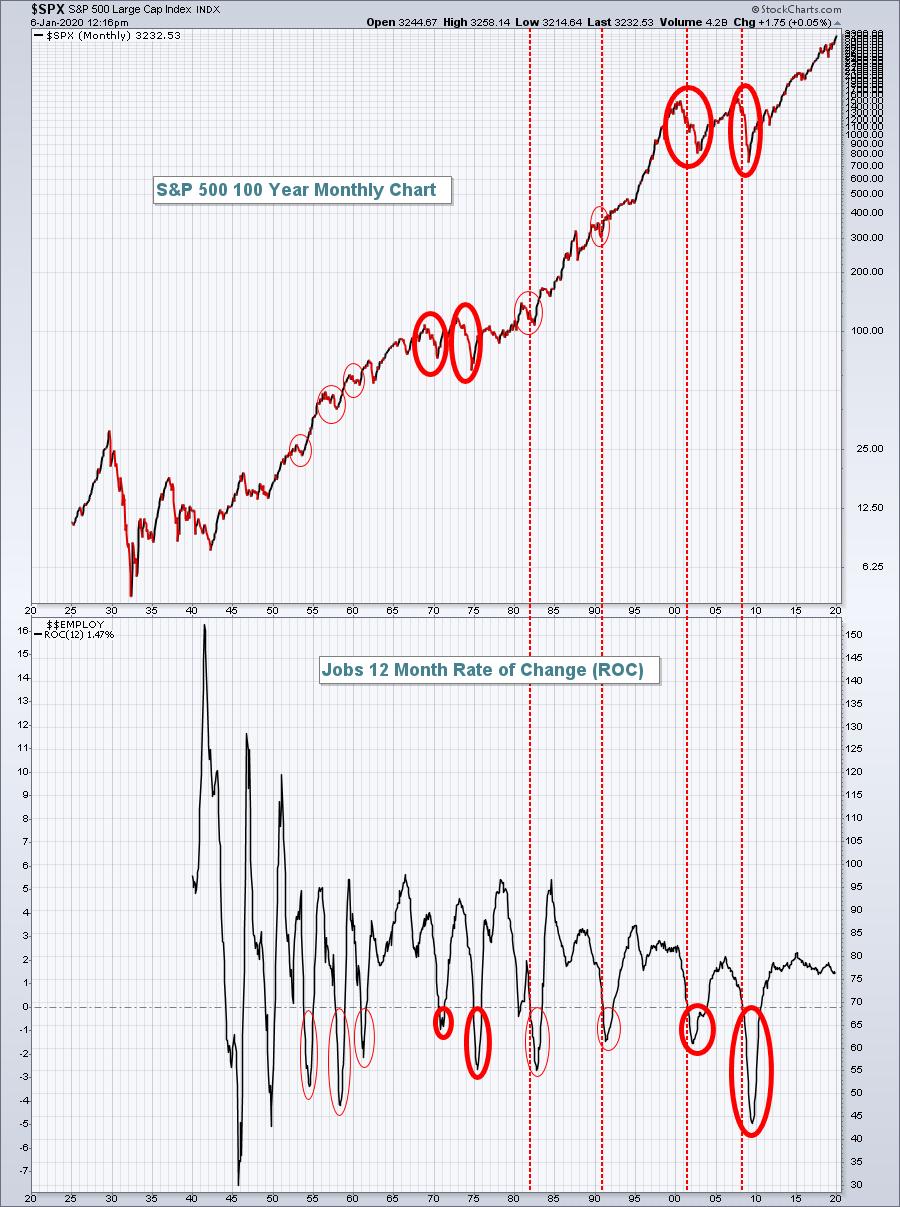
The dark red circles highlight the jobs 12 month ROC moving into negative territory during secular BEAR markets. The other lighter red circles highlight the jobs 12 month ROC moving into negative territory during secular BULL markets. Look at the market action during each. Recessions in secular bull markets show a history of brief downturns in the S&P 500, followed by moves back to higher highs. We are in a secular bull market, so even a recession, in my view, will result only in a temporary cyclical bear market within the confines of a secular bull market. That's a very important distinction.
Sector/Industry Focus
Defense stocks ($DJUSDN) made a huge breakout late last week after the shockwaves of the U.S. airstrike in Baghdad. The group had been struggling on a relative basis as its absolute price action based. That changed on Friday as you can see below:
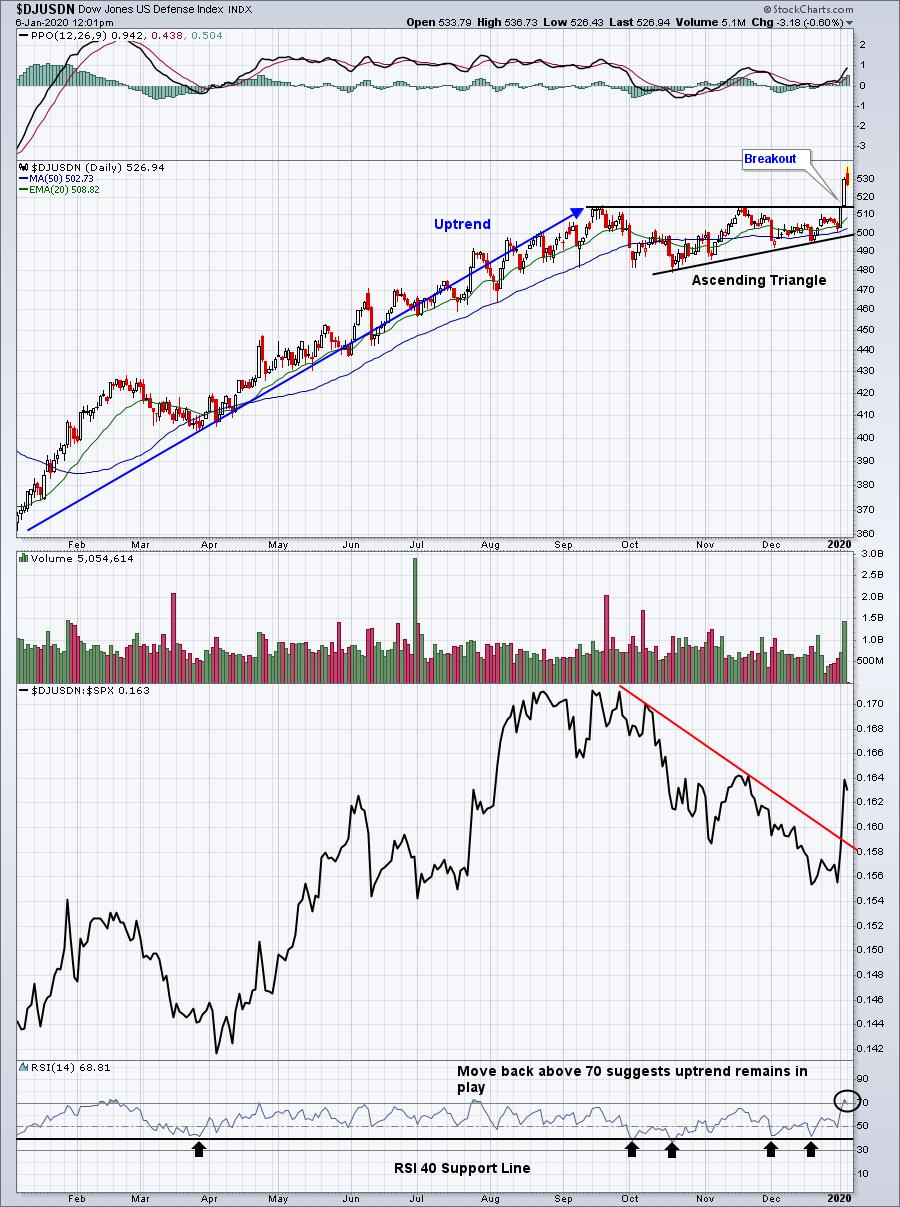
The measurement of this bullish ascending triangle continuation pattern is 550, so any pullback to test the breakout level and/or the rising 20 day EMA would provide a very solid reward to risk scenario for stocks in this space. The bottom panel also highlights how indices and stocks typically hold RSI 40 support during uptrends.
Active Trade Alerts
It's really important that you understand the purpose of our Active Trade Alerts. For us, it's an educational process of how to use the Strong Earnings ChartList, which is essentially our revolving Watch List of trading candidates. We are not looking to provide 10 Active Trading Alerts to fill out a portfolio. It's designed to walk everyone through how I trade, from the start of the trade to either our target being hit (or other profit level being reached), or our stop being triggered. It's just as important to limit your losses as it is to profit from big gains. Every day in the DMR, i'll keep you fully up-to-date on our Active Trade Alerts so that you can sense what I'm feeling about these trades on a daily basis.
I want to be clear about one other thing. You don't have to agree with me. You may love the trades I feature here or you may hate them. If certain trades don't appeal to you, don't trade them. Again, I want to provide education on how I trade. You might want to follow my strategy or you may not. You might pick up one or two ideas and add them to your own personal trading strategy, which is great.
Given that backdrop....
We have two active alerts right now as follows:
VC (-3.15%) - reports earnings on February 19. VC is seeing additional selling after recently failing to clear its 20 day EMA. We are keeping our multiple entries in play. Three entries have already triggered at 88.27, 87.00, and 86.00. After weakness the past couple days, VC is now just below 86 and we still have two remaining entries at 85.00 and 84.00 with a tight closing stop beneath 83.50. Gap support from VC's last earnings report is 83.92. If we see a complete gap fill, we'll execute all five of our entries, leaving us with an average cost of 86.05.
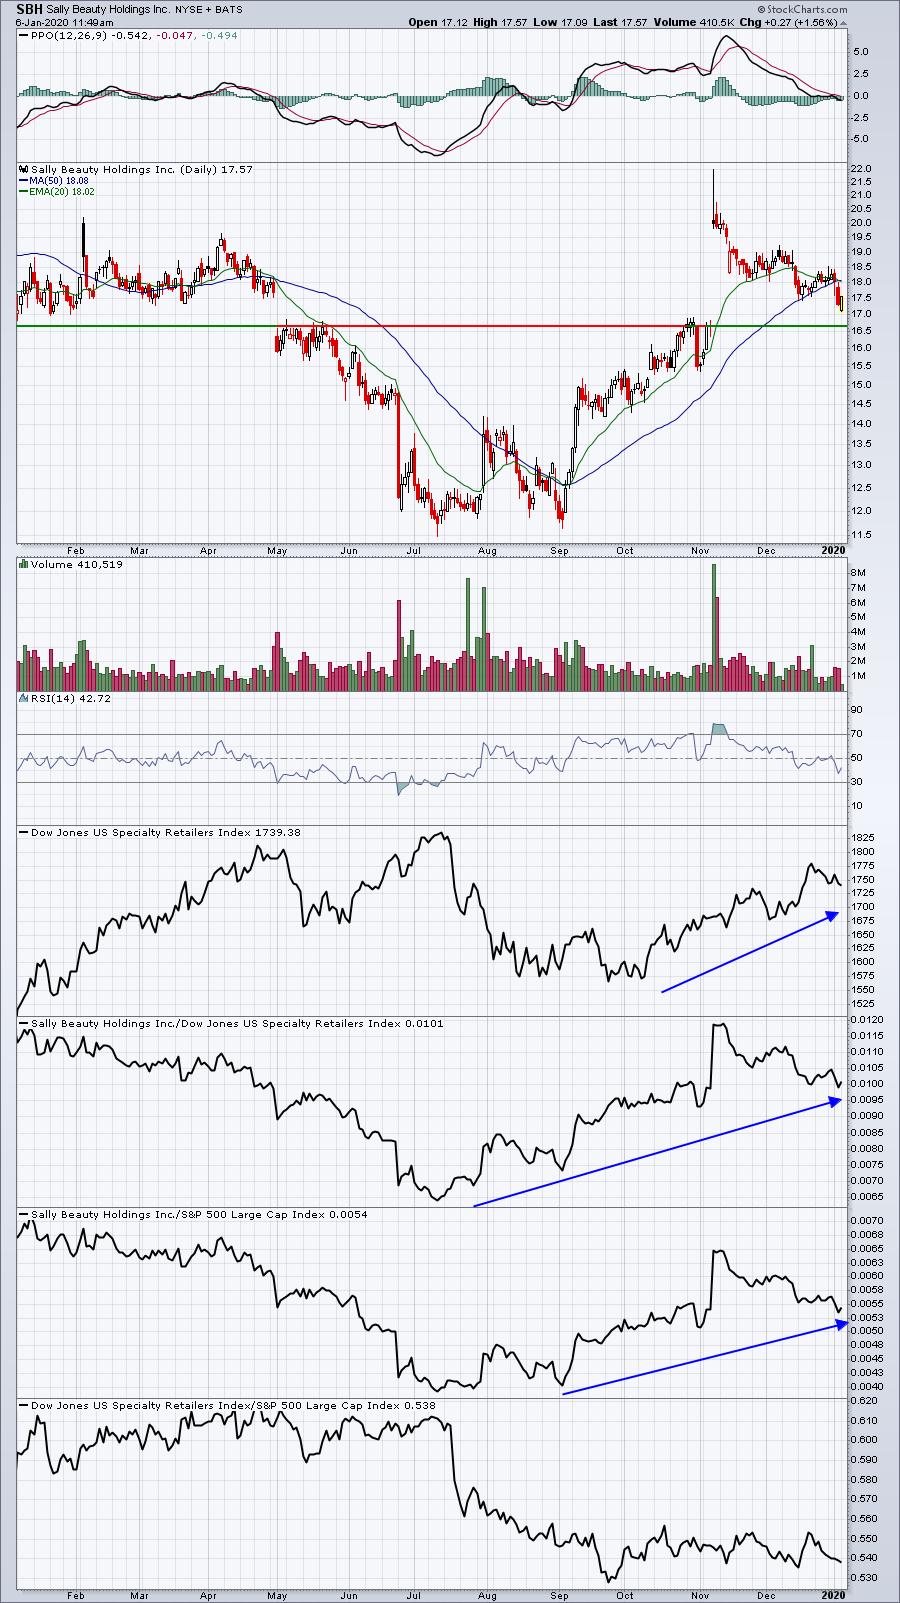
SBH (+1.56%) - reports earnings on February 3. SBH was alerted on Friday at 17.46 with additional entries at 17.29, 17.12, 16.95 and 16.78. Our target is 20.31 and our closing stop is 16.60. I'd love to see a bullish engulfing candle form today with a close back above both its 20 day EMA and 50 day SMA, but there's still a ways to go to achieve that type of rebound:
Strong Earnings ChartList (SECL)
Our SECL currently has 363 annotated charts on it, but we'll be deleting a number of stocks that will be reporting upcoming quarterly results in the 2nd half of January. Many stocks in our four portfolios will be deleted for SECL purposes because, from a trading perspective, we don't hold into earnings. Therefore, they're removed from the SECL, but unless otherwise noted, they will be held in their respective portfolios through their February 19th close. Portfolio stocks are treated differently as they're generally held (unless we specify a stop like we did with KMX) for a full three month period to include one earnings report. We encourage our members to do whatever is most comfortable for each of you. If you don't mind taking the risk of holding stocks into earnings, then by all means please do so. The philosophy with our portfolios is that each portfolio will be holding 10 stocks through earnings reports, so the risk of one company reporting a disaster is offset by another that reports blowout earnings. I mention this because we will begin to see portfolio stocks reporting earnings in the second half of January.
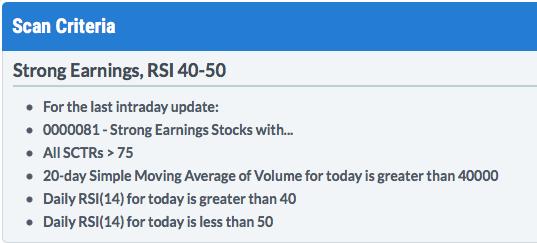
I ran a scan of SECL stocks testing the RSI 40-50 support zone with SCTR scores above 70 (solid relative strength). Here's the code:
Here were the results:
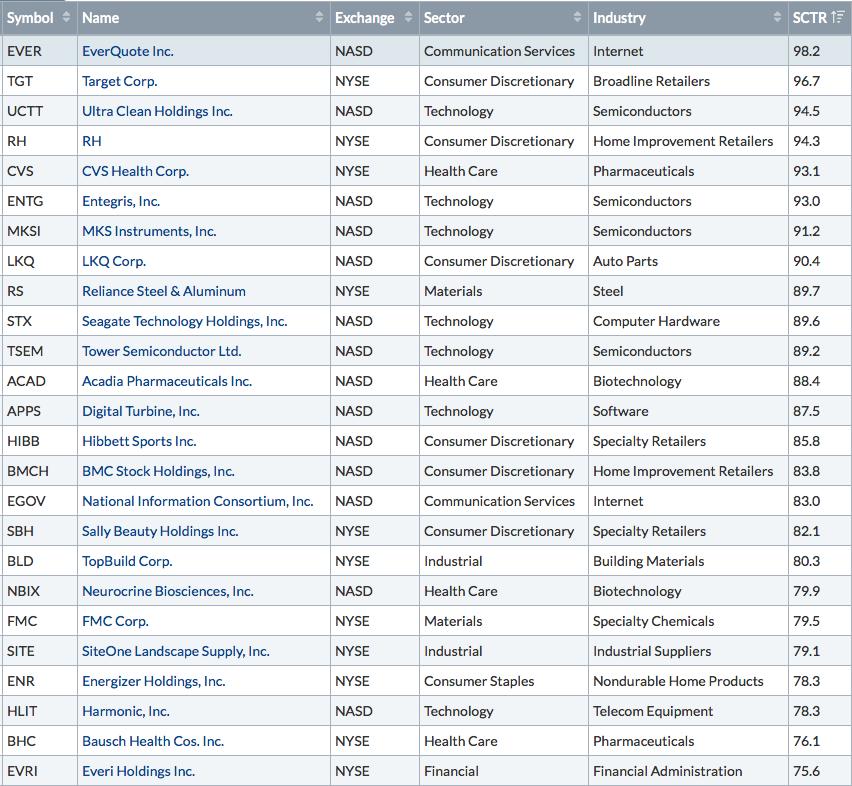
Here are three worth considering for a short-term trade:
EVER:
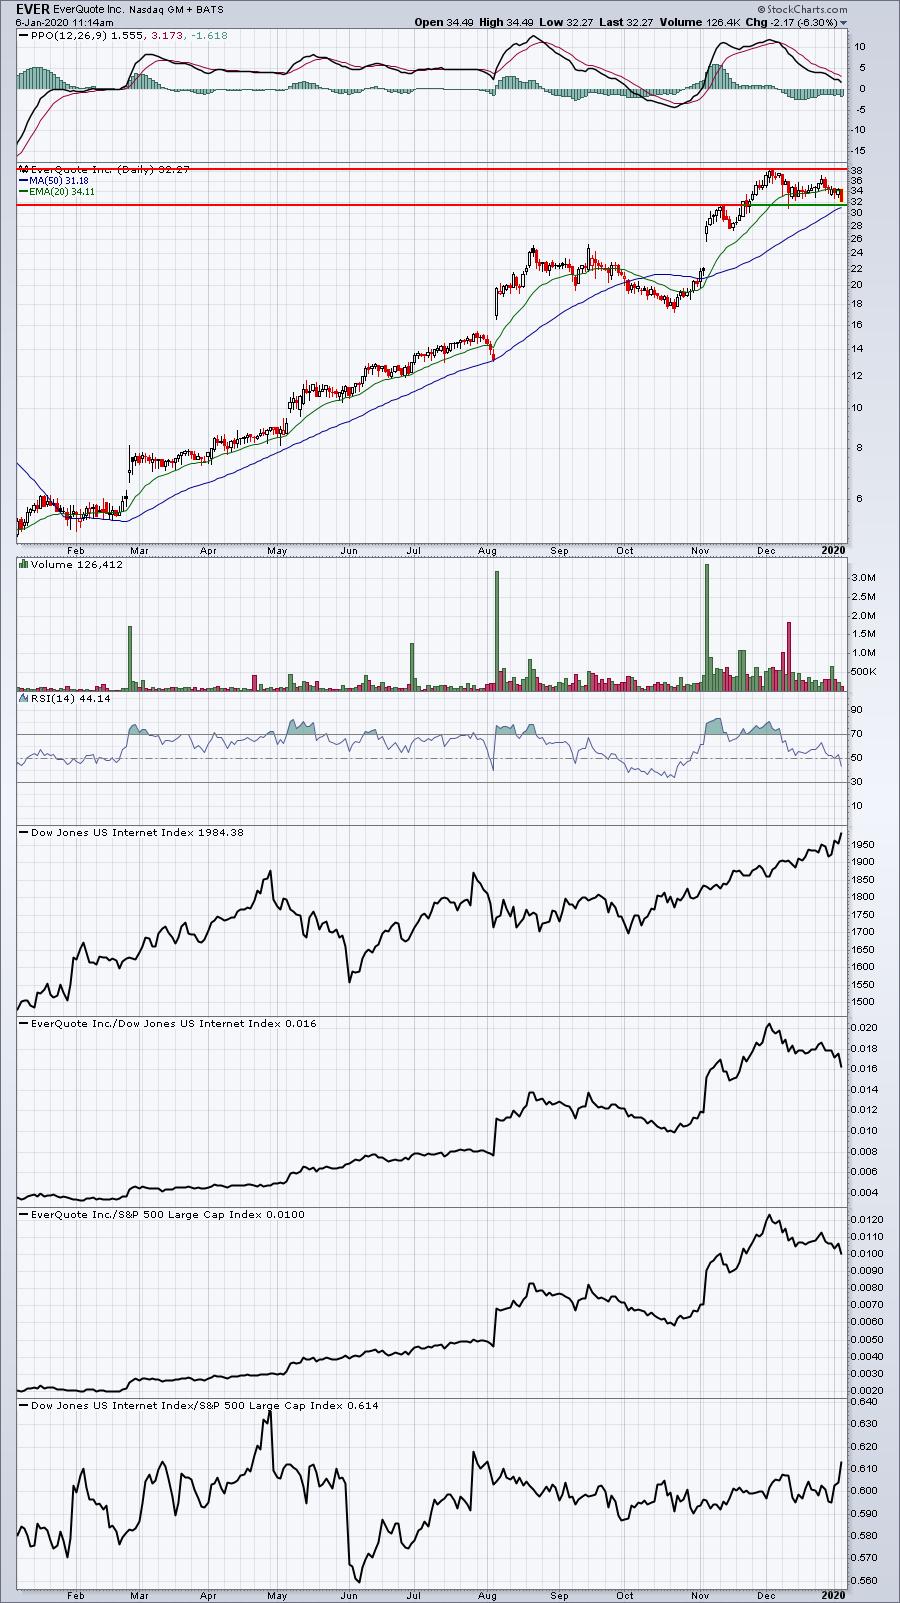
EVER is a Model portfolio stock and it's quite volatile, but recent price support falls in the 31-32 area with its price target at the recent price high just above 38. (I wrote about this shortly after 11am today. By the time I was prepared to send out this DMR, EVER had fallen to 30.55. A reversing candle off this intraday selling would be very bullish, in my opinion.)
RH:
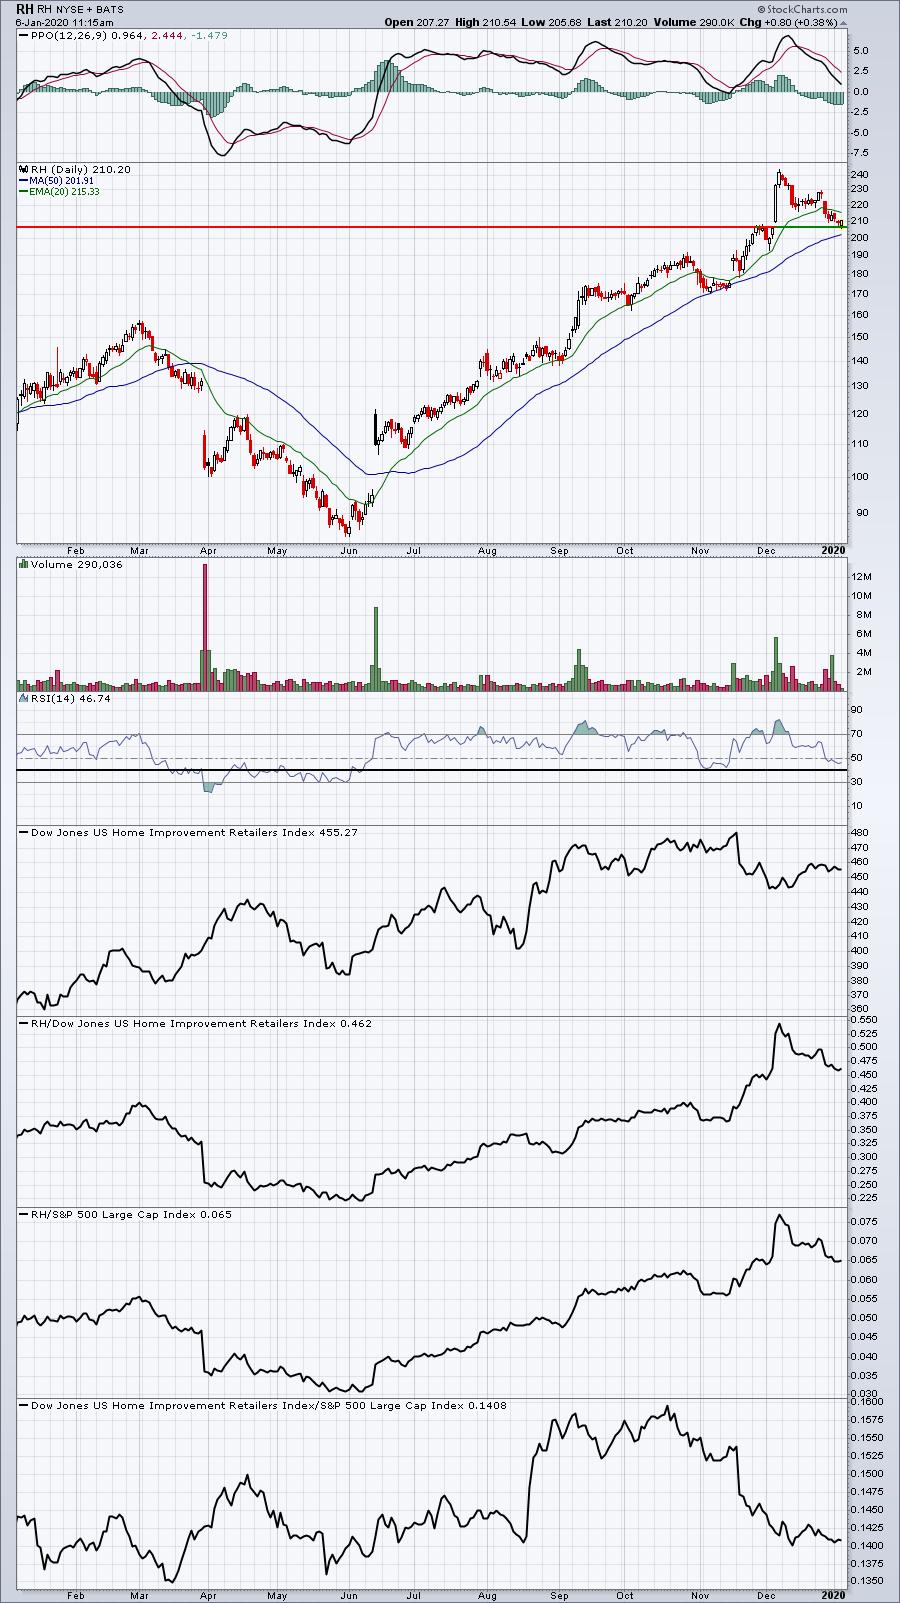
RH has been weak for a month, but volume seems to be dwindling as it's returned to a key price support level.
ENTG:
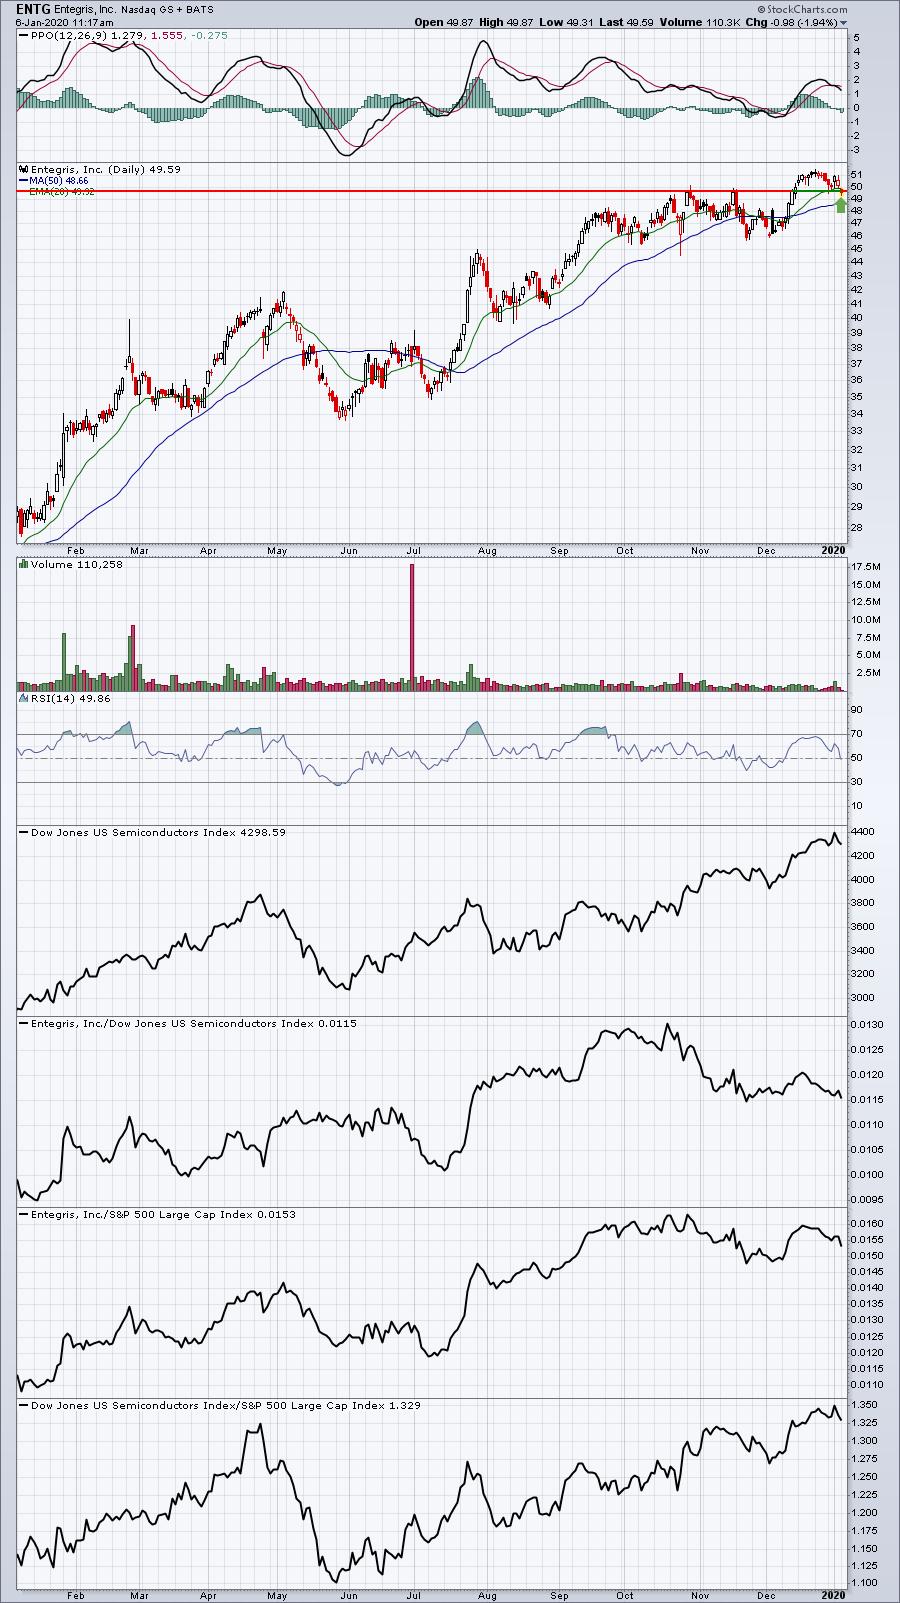
ENTG is only down roughly 3% since its recent high, but it's now testing support from the double top breakout from the first half of December.
Movers & Shakers
I ran a scan of all NYSE stocks, looking for companies that have already traded more than 1.5 times their normal average daily share volume. 49 were returned, but here are two that are technically significant:
CMC:
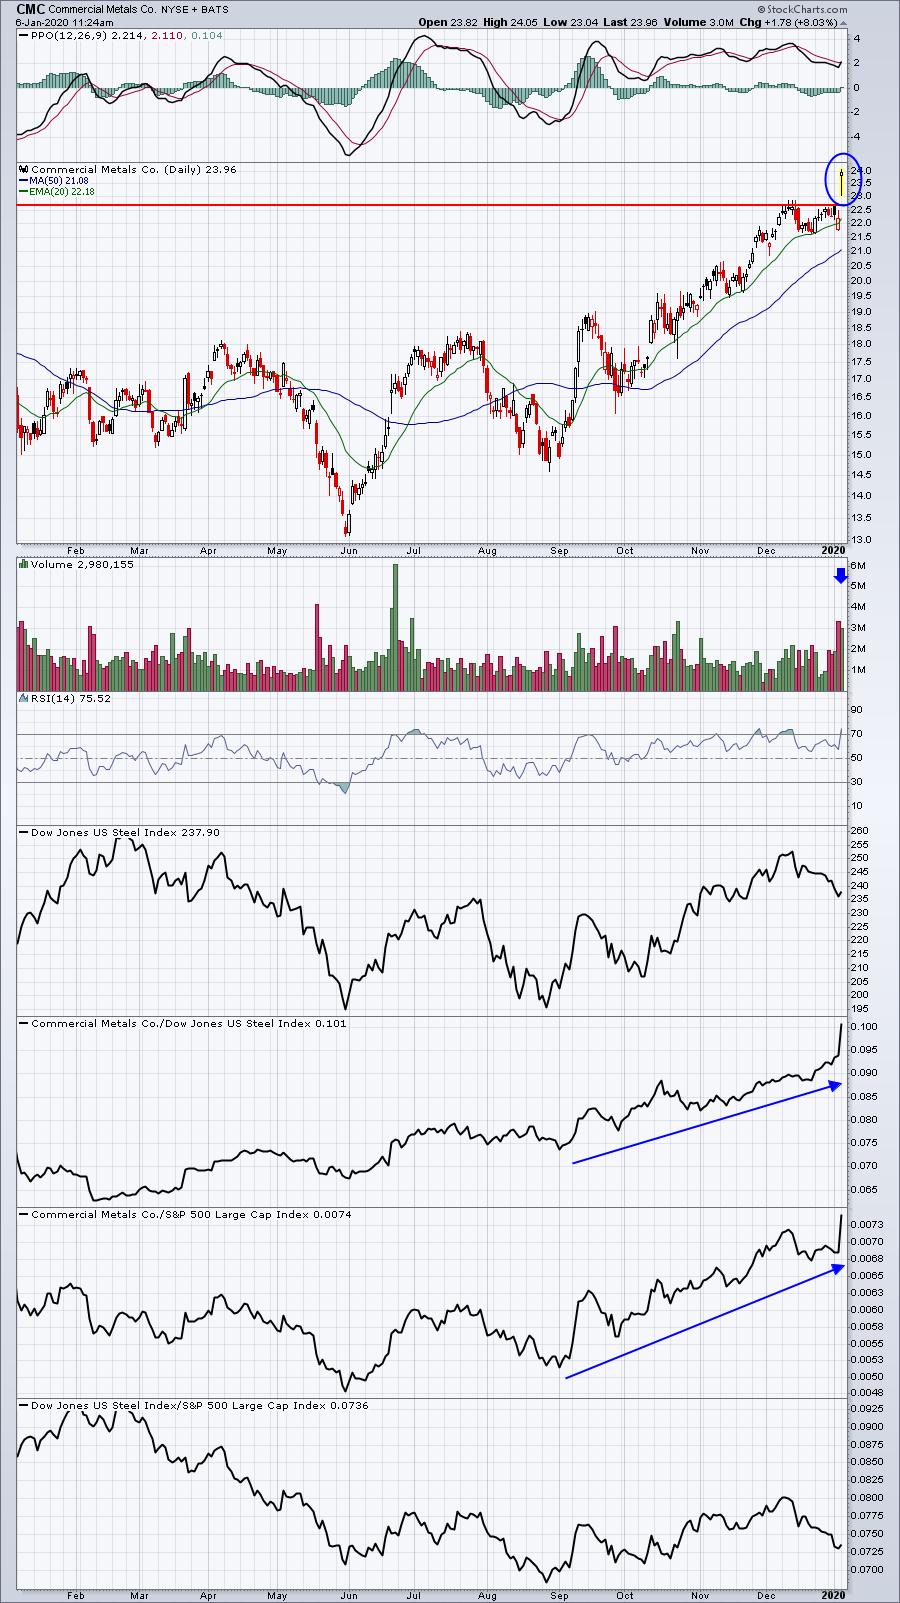
We're moving closer and closer to another earnings season and CMC is a GREAT example of what we should be looking for. Do you see both the absolute and relative strength before today's gap higher? That's a bullish sign that Wall Street has been accumulating heading into its earnings report. This morning, CMC reported its results, and here was the headline from briefing.com:

To be fair, CMC did miss its revenue estimate, so it's not a stock that will be on our SECL in the next quarter, but its EPS nonetheless trounced estimates, $.73 vs $.54. We need to follow the charts and relative strength to have a better idea of how companies might report.
CAE:
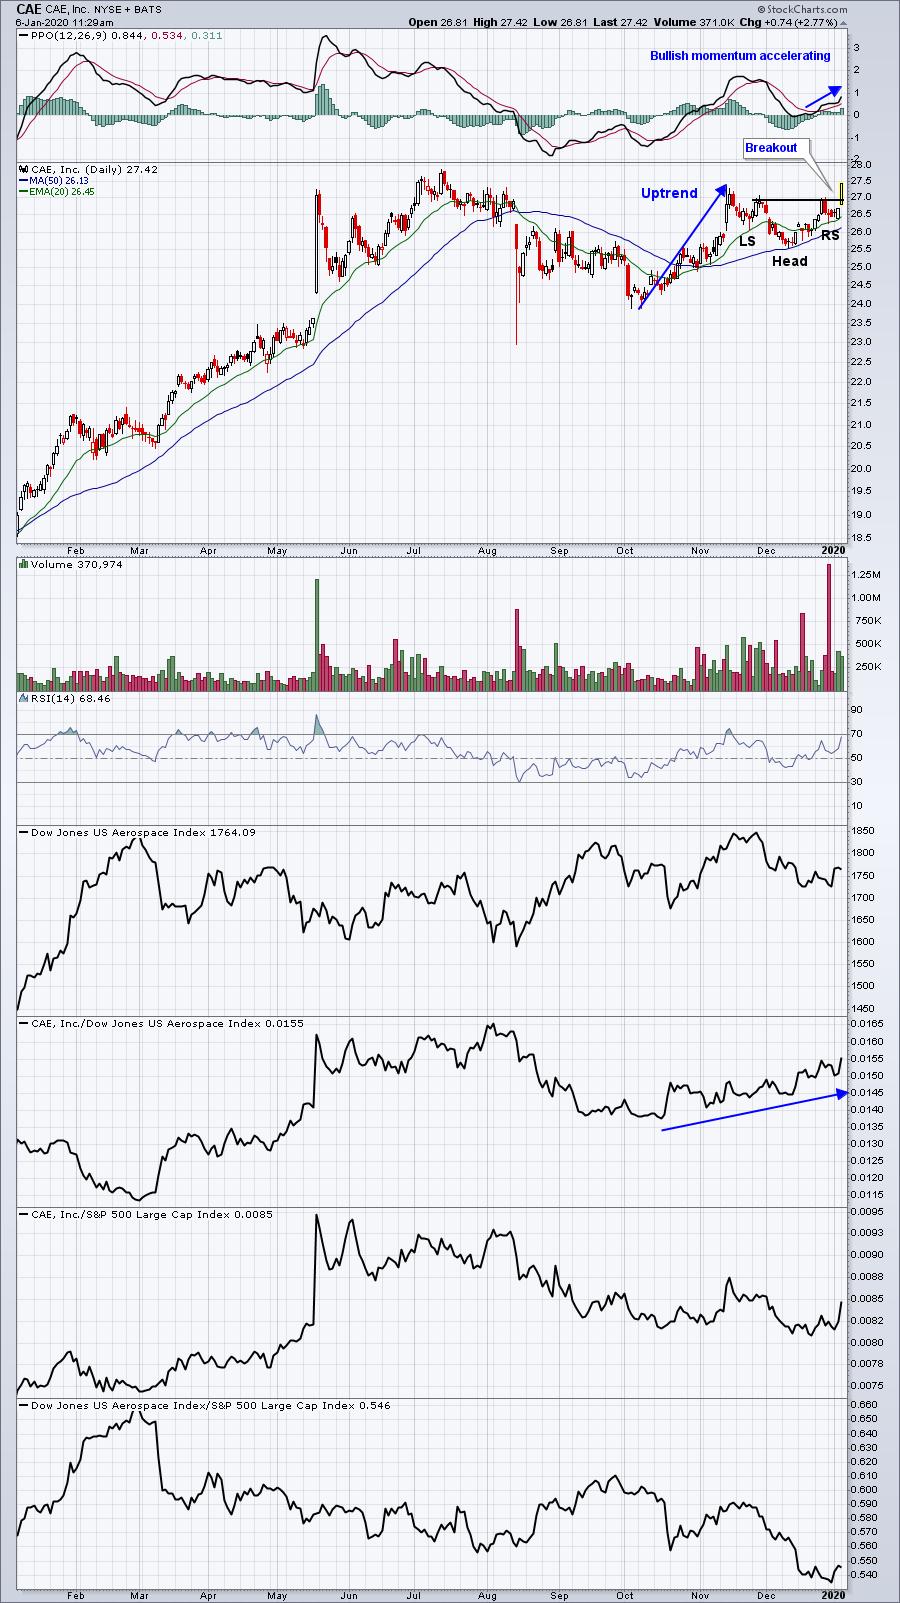
CAE is also showing relative strength in a weak aerospace group ($DJUSAS). Today's action is a confirming breakout of a bullish inverse head & shoulders continuation pattern. The volume is strong, which is bullish as well, and the measurement initially is to 28.50.
Earnings Reports
Here are the key earnings reports for this week, featuring stocks with market caps of more than $5 billion. I also include a few select companies with market caps below $5 billion. Finally, any portfolio stocks (or active trade alerts) that will be reporting results are highlighted in BOLD. Please make sure you check for earnings dates for any companies you own or are considering owning:
Tuesday, January 7:
None
Wednesday, January 8:
WBA, STZ, LEN, RPM. Others less than $5 bil: HELE, MSM, BBBY
Thursday, January 9:
SNX, AYI. Others less than $5 bil: KBH, SMPL
Friday, January 10:
INFY
Economic Reports
December PMI services: 52.8 (actual) vs. 52.2 (estimate)
Happy trading!
Tom