
EB Daily Market Report - Tuesday, January 7, 2020
Executive Market Summary
- Futures were mixed and Wall Street opened down; the NASDAQ is clinging to a fractional gain
- Communication services (XLC) and technology (XLK) are leading
- Energy (XLE) and real estate (XLRE) are performing poorly; the former is down in sympathy with oil prices
- The 10 year treasury yield ($TNX) is flat at 1.81%
- Semiconductors ($DJUSSC) are exhibiting leadership today with several semi names among the S&P 500's best performers today
- Our active trade alerts, VC and SBH, are both lower
Market Outlook
Historically, the 7th (today) through the 10th of calendar months tends to carry with it bearish tendencies. The stock market has a history of rising during the first week of calendar months, likely due to money flows from pension funds, 401(k) plans, etc. that arrive early in the month. The end of calendar months tends to be very strong as well, most likely due to the anticipation of those incoming funds. It's quite honestly a legal form of frontrunning (buying when you know others will be buying right after you do).
I know I'm very bullish, but I do try to keep it real when risks begin to grow. We know the historical tendency for the balance of this week, and there is a short-term topping structure in place on the S&P 500. Perhaps it will be negated, but we should all at least recognize that this structure is present:
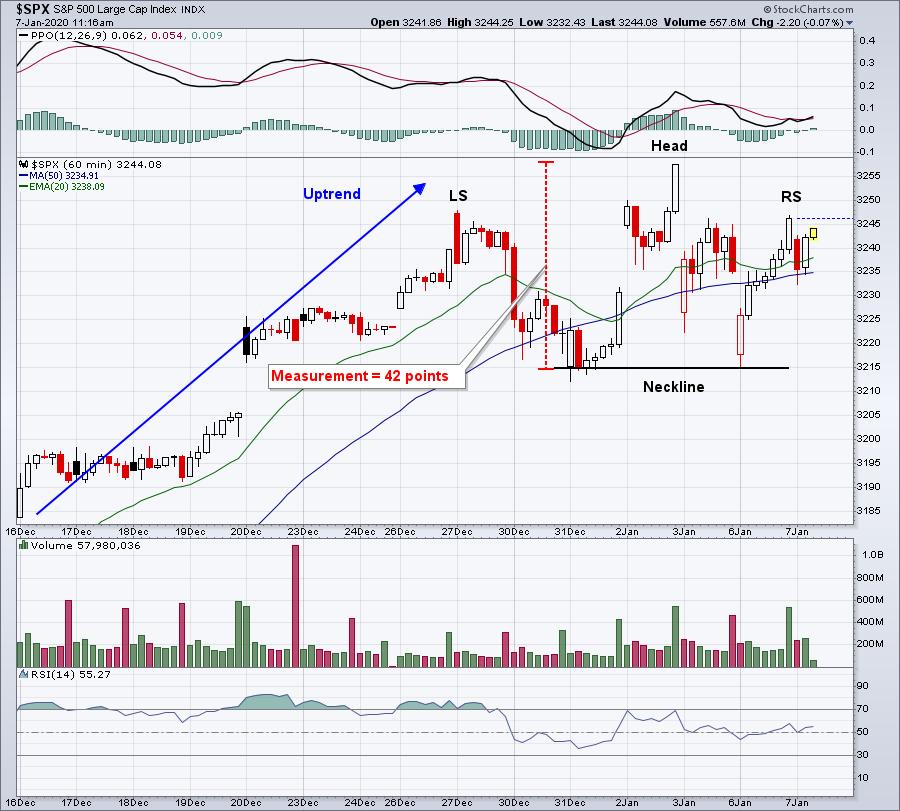
An eventual breakdown would lead to an initial target of roughly 3170-3175, not exactly a major pullback, but one we should at least be considering. A move back through 3257 would negate this pattern.
Sector/Industry Focus
Internet stocks ($DJUSNS) are strong and their recent breakout of a long-term bullish ascending triangle continuation pattern suggests that internet stocks will remain leaders in 2020. Stocks like Facebook (FB), Alphabet (GOOGL), Netflix (NFLX), and NetEase.com (NTES) would be likely beneficiaries of the following breakout:
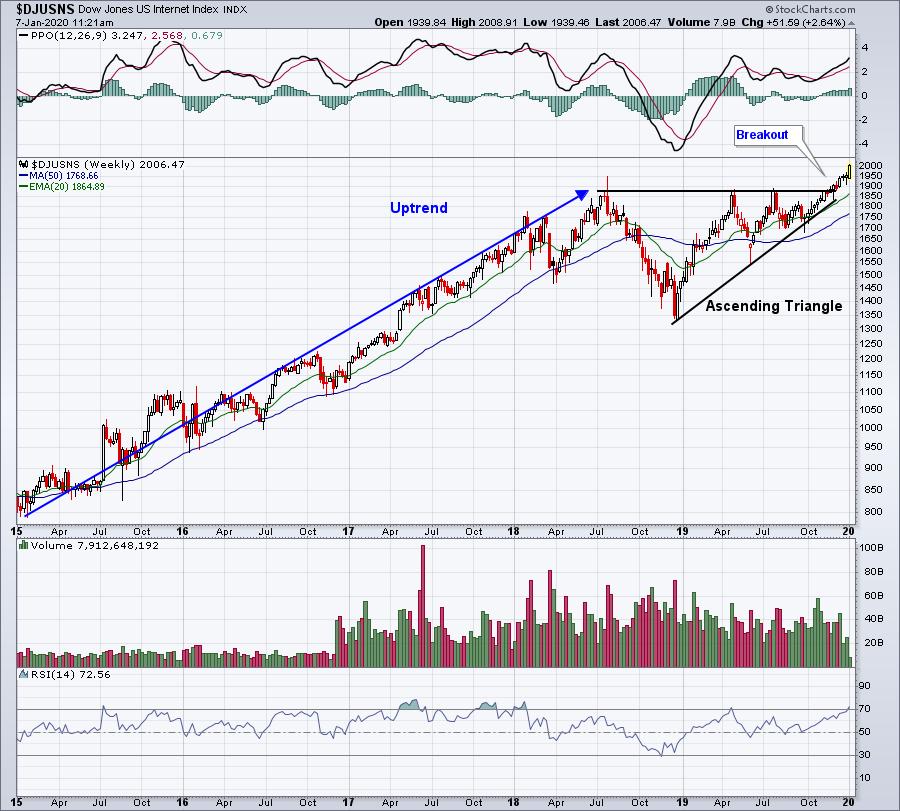
I didn't calculate the measurement on the above chart, but it would be roughly 550 points. Therefore, don't be surprised to see a rally to the 2400-2450 area in 2020.
Active Trade Alerts
It's really important that you understand the purpose of our Active Trade Alerts. For us, it's an educational process of how to use the Strong Earnings ChartList, which is essentially our revolving Watch List of trading candidates. We are not looking to provide 10 Active Trading Alerts to fill out a portfolio. It's designed to walk everyone through how I trade, from the start of the trade to either our target being hit (or other profit level being reached), or our stop being triggered. It's just as important to limit your losses as it is to profit from big gains. Every day in the DMR, i'll keep you fully up-to-date on our Active Trade Alerts so that you can sense what I'm feeling about these trades on a daily basis.
I want to be clear about one other thing. You don't have to agree with me. You may love the trades I feature here or you may hate them. If certain trades don't appeal to you, don't trade them. Again, I want to provide education on how I trade. You might want to follow my strategy or you may not. You might pick up one or two ideas and add them to your own personal trading strategy, which is great.
Given that backdrop....
We have two active alerts right now as follows:
VC (-0.34%) - reports earnings on February 19. VC had a rough day yesterday and has returned to recent lows. At this point, I'd still view it as consolidation. I'm looking for VC to make a pre-earnings run higher, but we'll keep our closing stop in place at 83.50 in the event it fails us.
SBH (-1.95%) - reports earnings on February 3. SBH has bounced back and forth since being alerted and currently trades at our 3rd entry (17.12) of our five entry points. We do still have two remaining entries that are open at 16.95 and 16.78. The first bullish step for SBH will be a confirmed close back above its declining 20 day EMA.
Strong Earnings ChartList (SECL)
Our SECL currently has 363 annotated charts on it, but we'll be deleting a number of stocks that will be reporting upcoming quarterly results in the 2nd half of January. Many stocks in our four portfolios will be deleted for SECL purposes because, from a trading perspective, we don't hold into earnings. Therefore, they're removed from the SECL, but unless otherwise noted, they will be held in their respective portfolios through their February 19th close. Portfolio stocks are treated differently as they're generally held (unless we specify a stop like we did with KMX) for a full three month period to include one earnings report. We encourage our members to do whatever is most comfortable for each of you. If you don't mind taking the risk of holding stocks into earnings, then by all means please do so. The philosophy with our portfolios is that each portfolio will be holding 10 stocks through earnings reports, so the risk of one company reporting a disaster is offset by another that reports blowout earnings. I mention this because we will begin to see portfolio stocks reporting earnings in the second half of January.
I ran a scan of SECL stocks hitting fresh 52 week highs today with at least 300,000 shares thus far. Here's the scan code for this:

Here were the results:
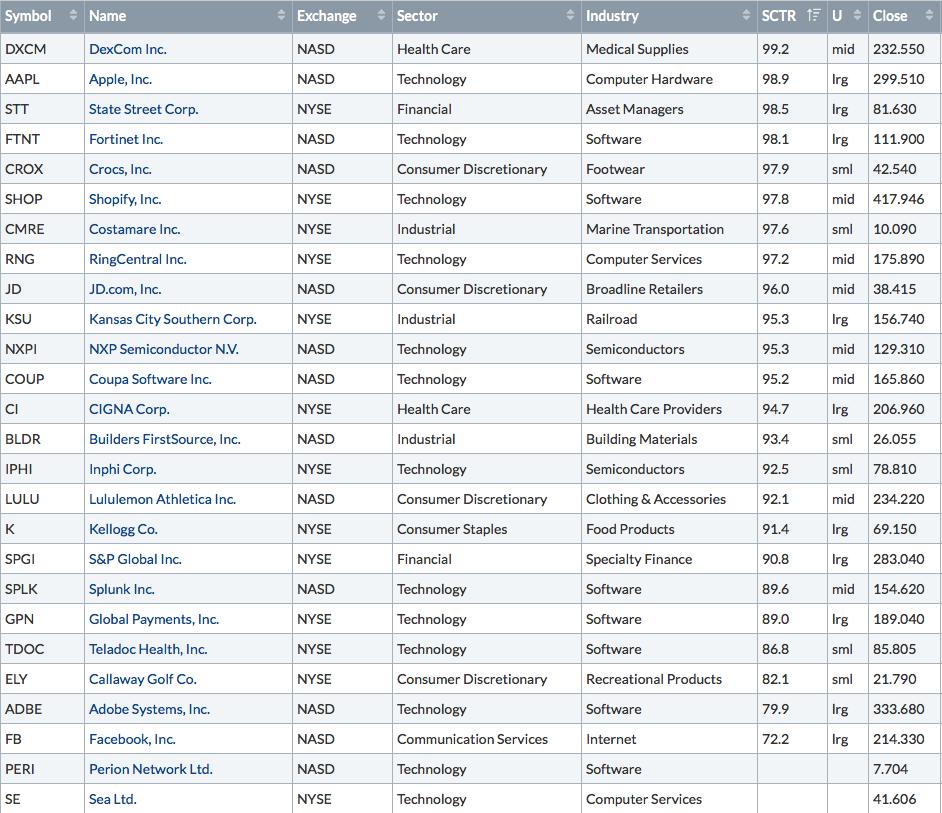
Technically, here are several that I find interesting:
DXCM:
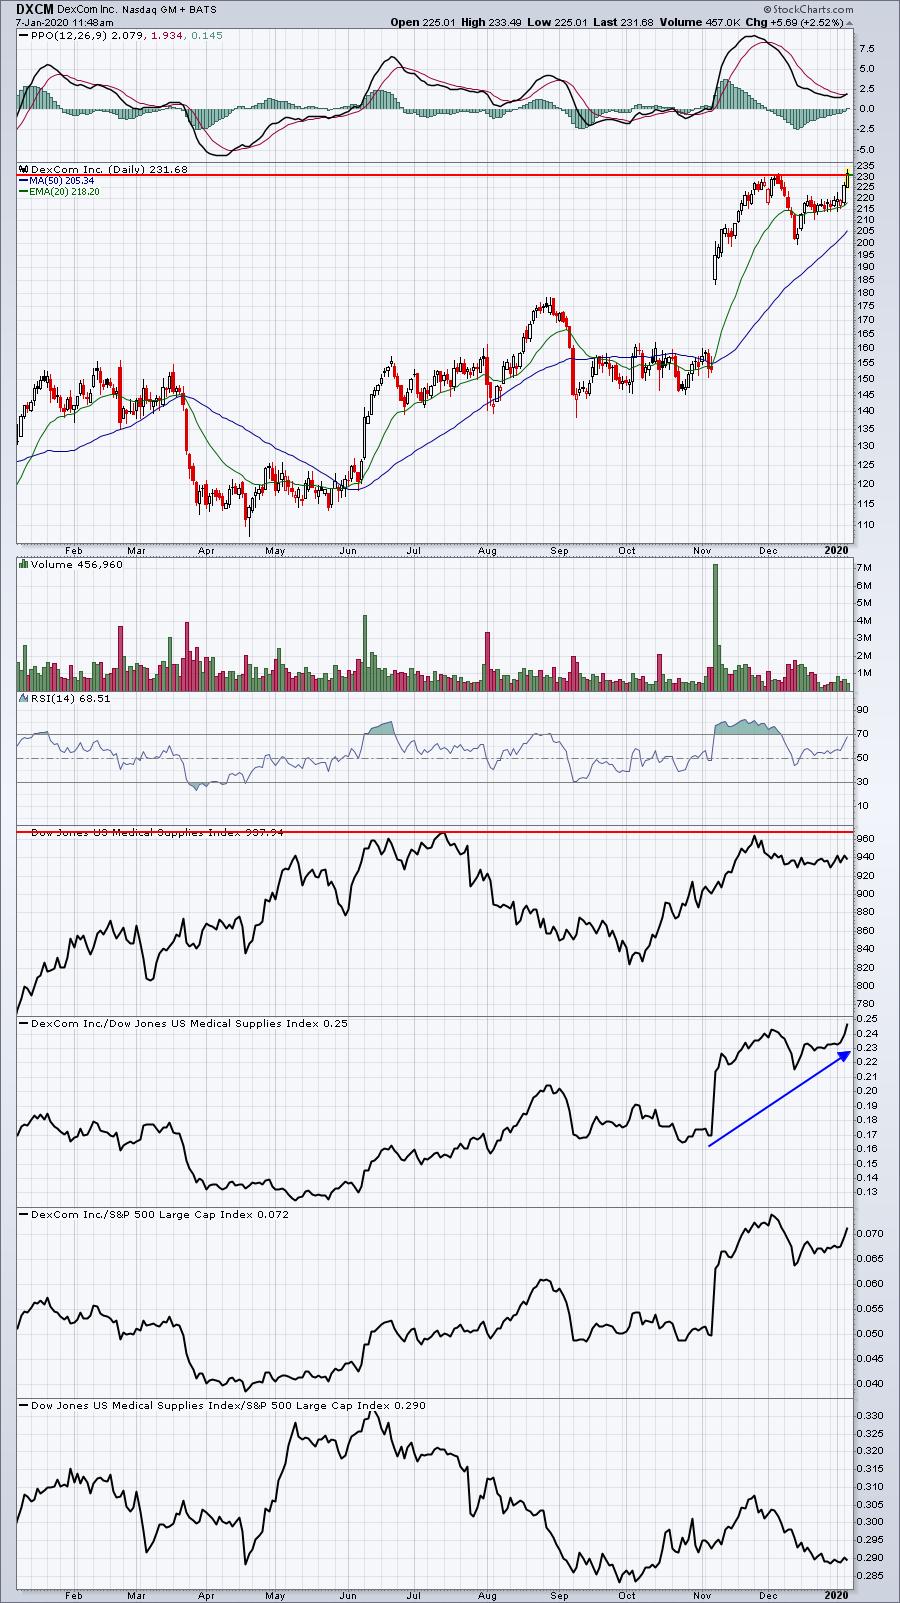
DXCM is clearly a medical supplies ($DJUSMS) leader. Does it break out today? Does the volume pick up into the close? While I'm a big fan of DXCM over the next few months, the short-term direction will be heavily influenced by the answers to those two questions.
SHOP:
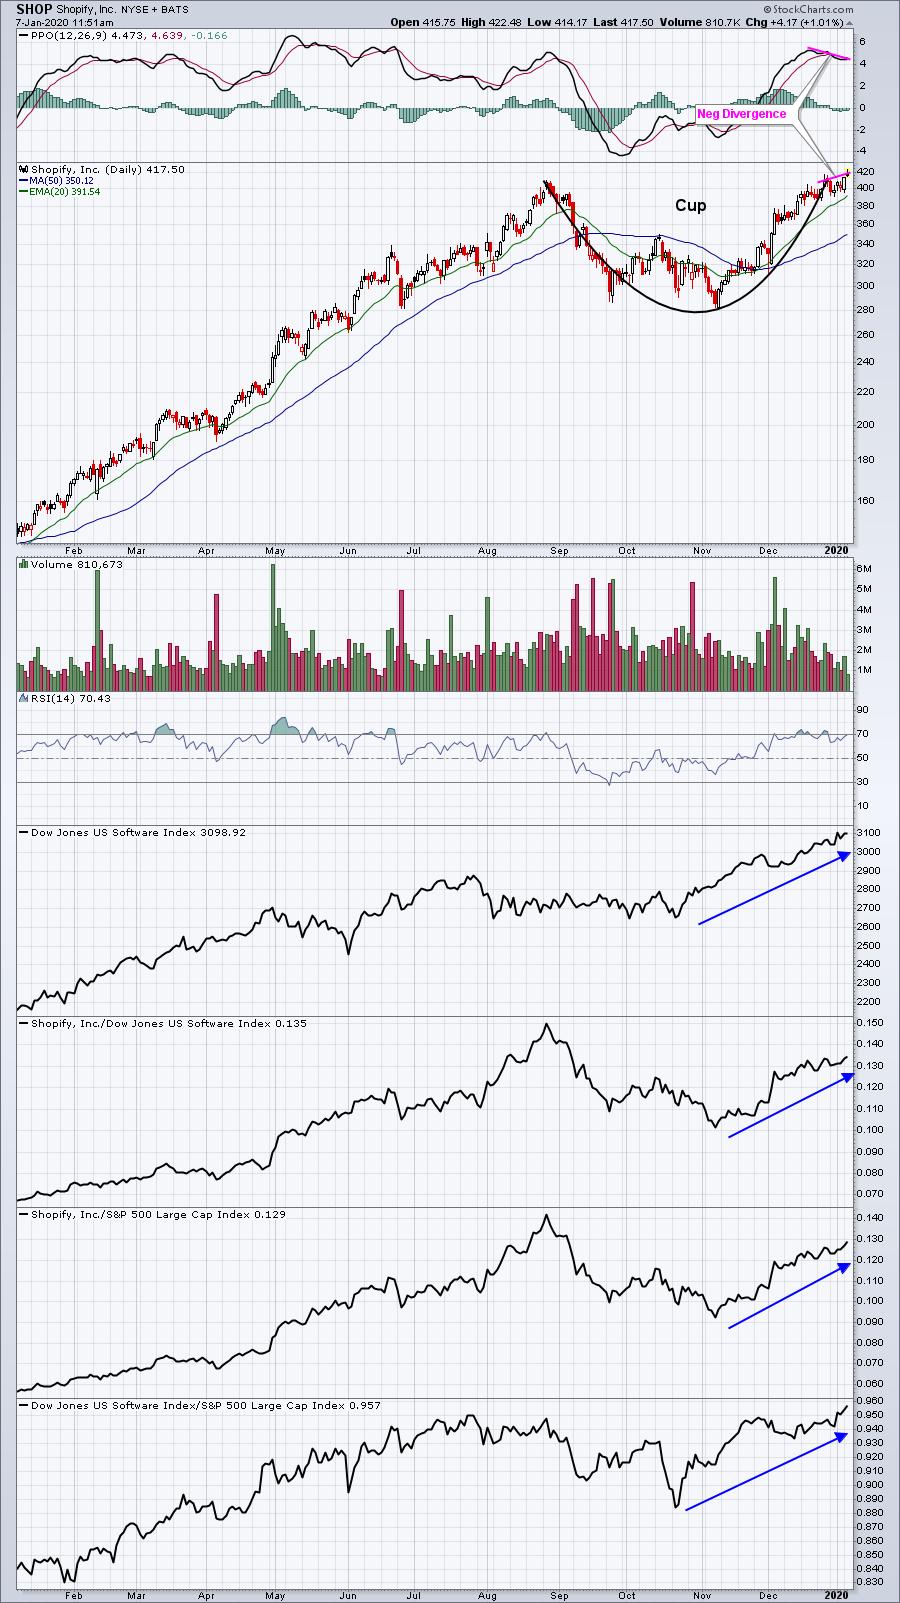
SHOP has been an awesome performer, but volume is light today and probably won't confirm this breakout. Furthermore, the PPO is rolling over despite higher prices. Relative strength is strong here so it's probably just a matter of time before we see another leg higher, but if the market rolls over short-term, don't be shocked if SHOP falls back to at least its 20 day EMA. A drop beneath 380 would likely trigger a 50 day SMA test. Again, I'm bullish, but we need to approach SHOP with caution for now.
RNG:
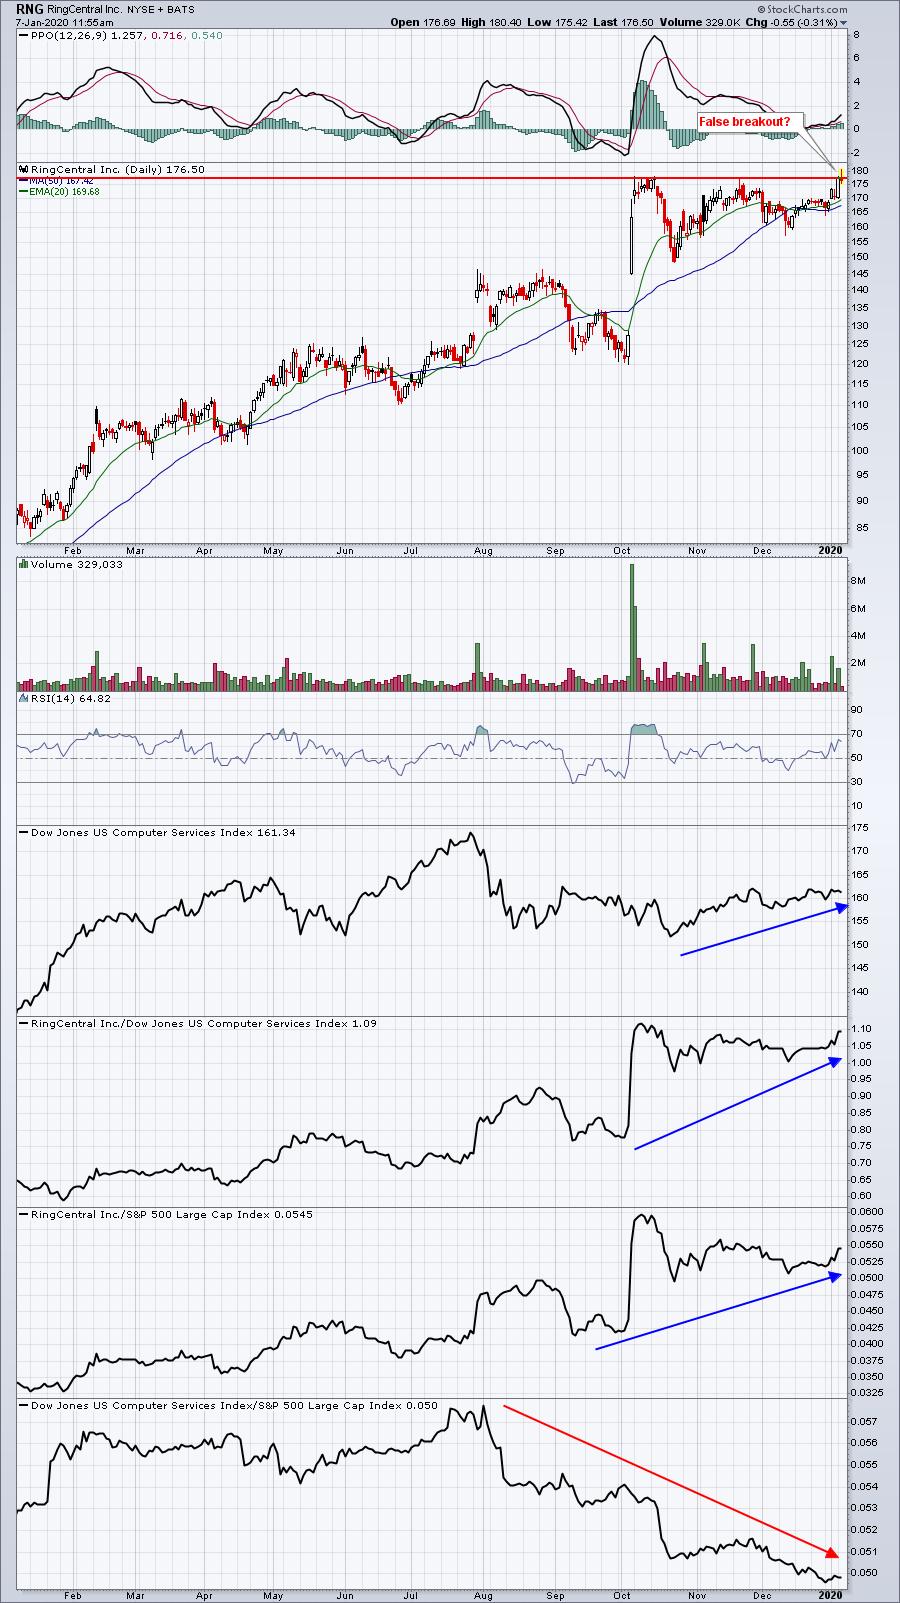
False breakout? I receive a LOT of questions about "when to sell". If I owned RNG right now, I'd likely take profits and take no chances. My favorite sell signal is a move above key price resistance intraday only for that breakout to fail. It could be a sign from market makers that they need to accumulate more shares before a confirmed breakout occurs.
IPHI:
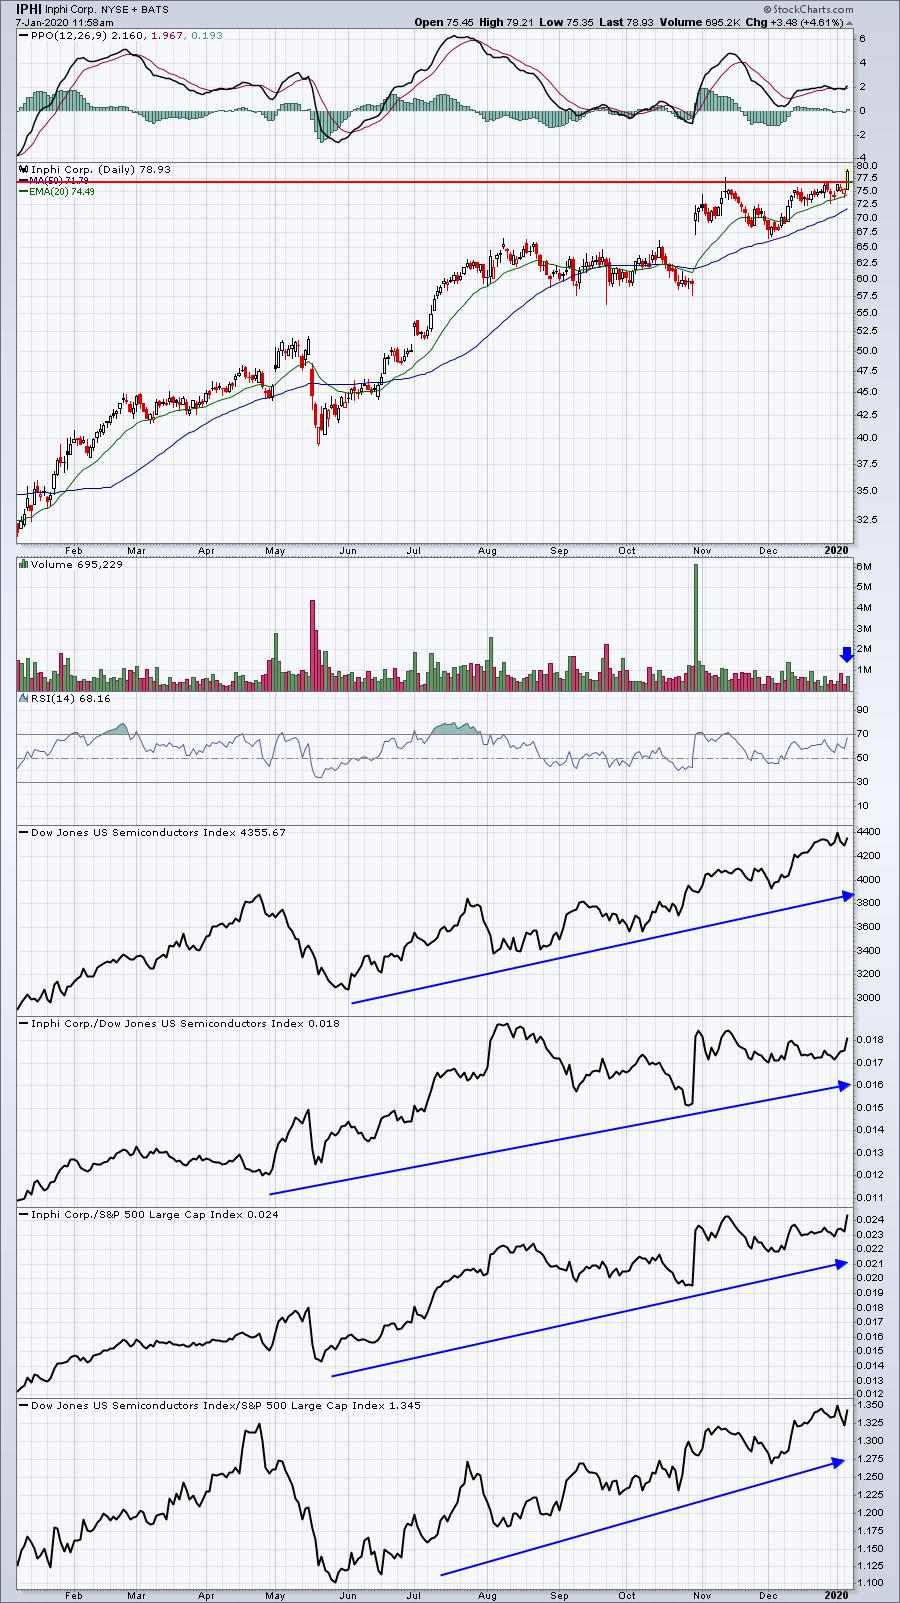
This breakout looks better to me. IPHI has consolidated a bit and the PPO is now beginning to strengthen, showing improving momentum. Relative strength is very strong as well.
ELY:
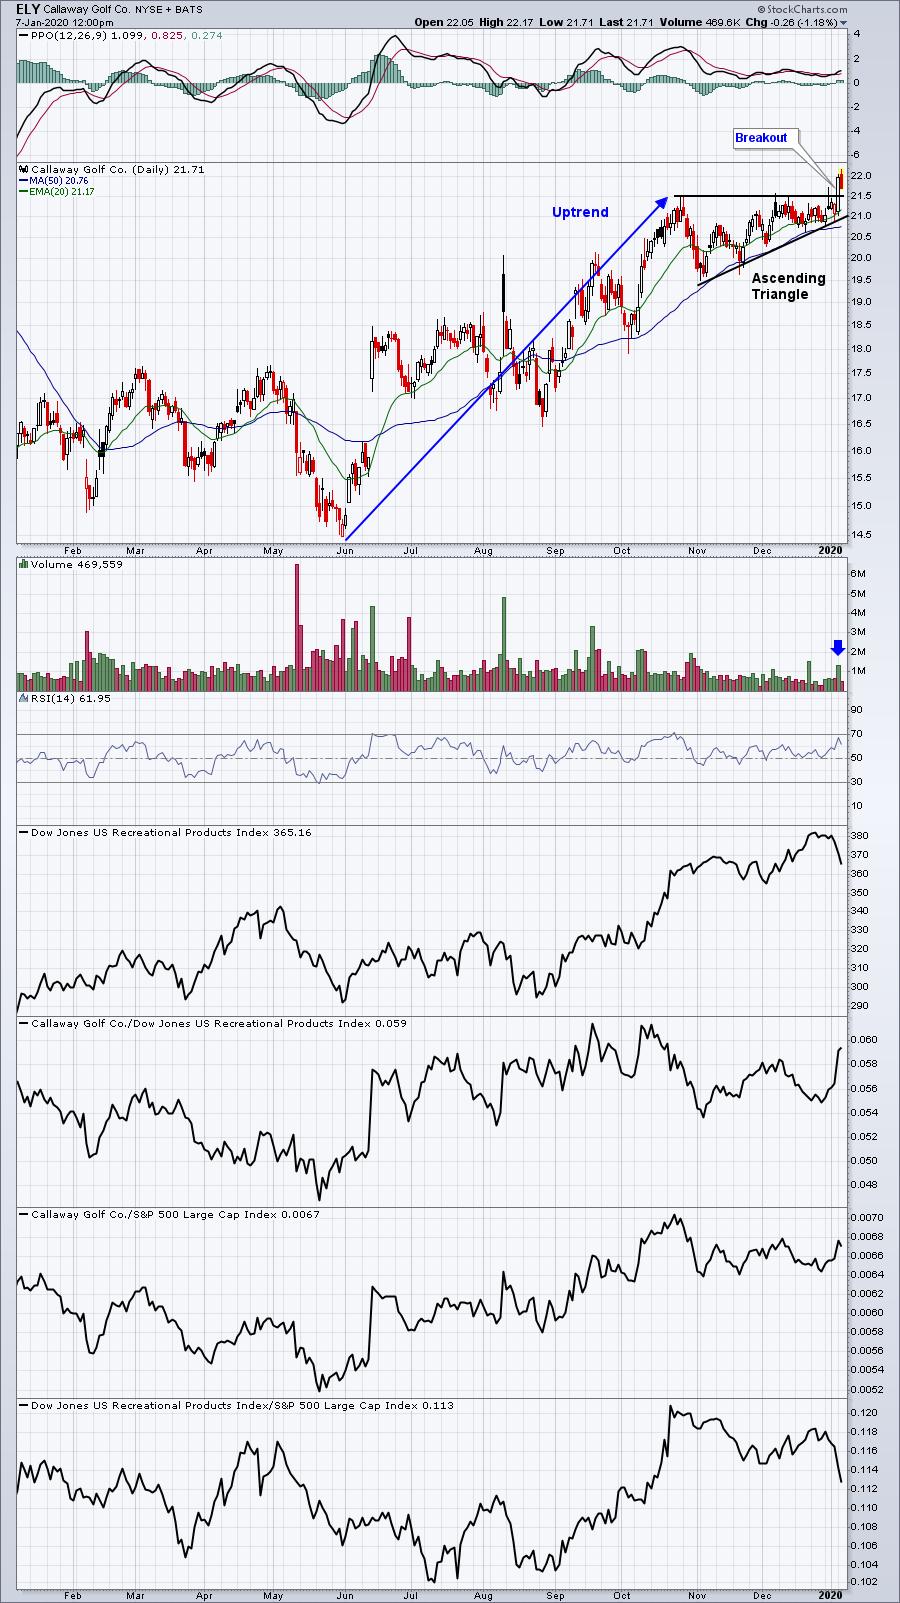
Great pattern. Great chart. Solid breakout on increasing volume. ELY is also a strong stock in an improving recreational products group ($DJUSRP). This is what I'd be looking for to trade a stock on a breakout.
FB:
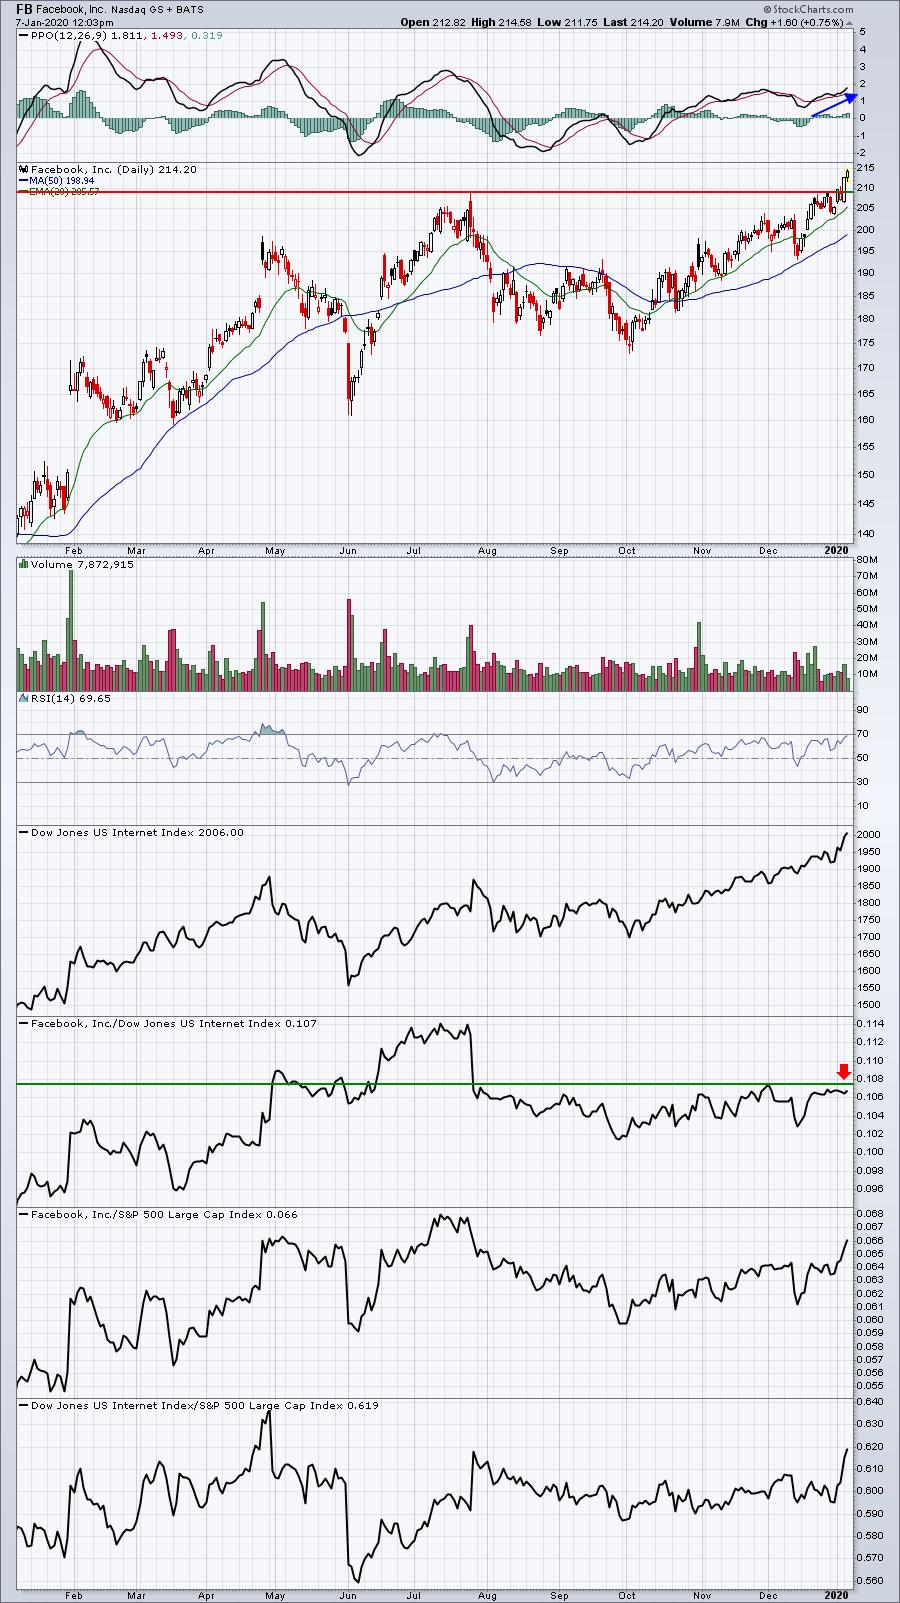
After breaking out yesterday, FB is adding to its recent strength today. The only concern I have currently is that FB hasn't broken out on a relative basis yet. I want FB to lead so watch that red arrow above. Can FB clear relative resistance? If so, I expect an explosive move here.
Movers & Shakers
Of the S&P 500 stocks, here are a couple of the most actives and their current technical outlook:
MU:
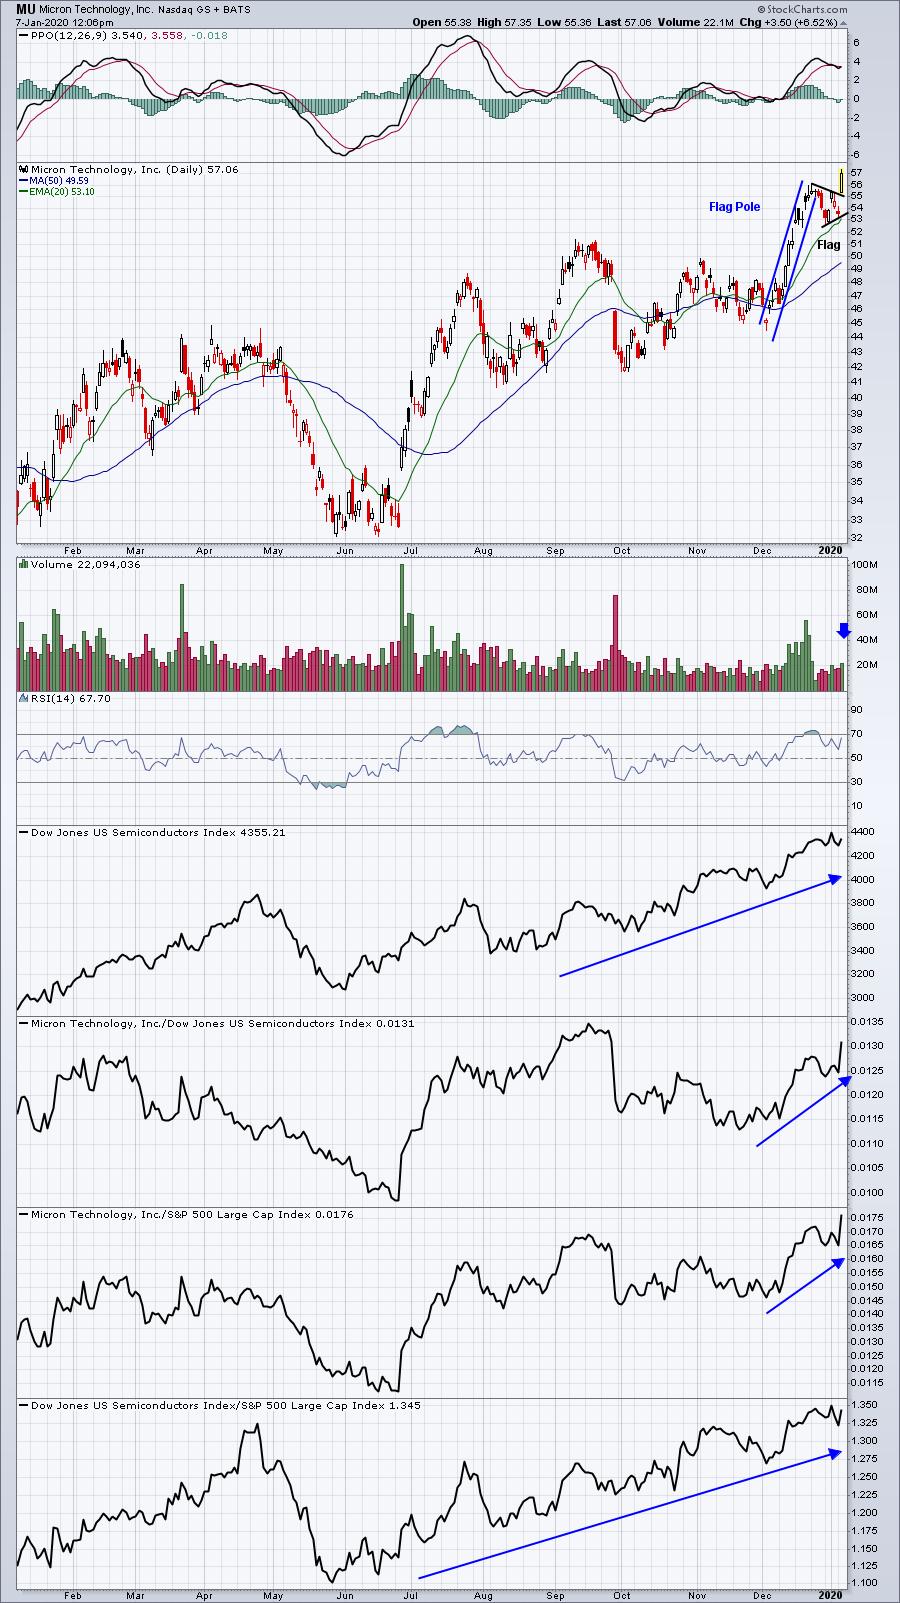
It's always bullish to see a bull flag confirmed by a breakout. Note the increase in volume today as well. MU was upgraded by Cowen and they raised MU's price target from 50 to 70. I would agree with this upgrade and also believe 70 is likely, possibly even as soon as this quarter.
APA:
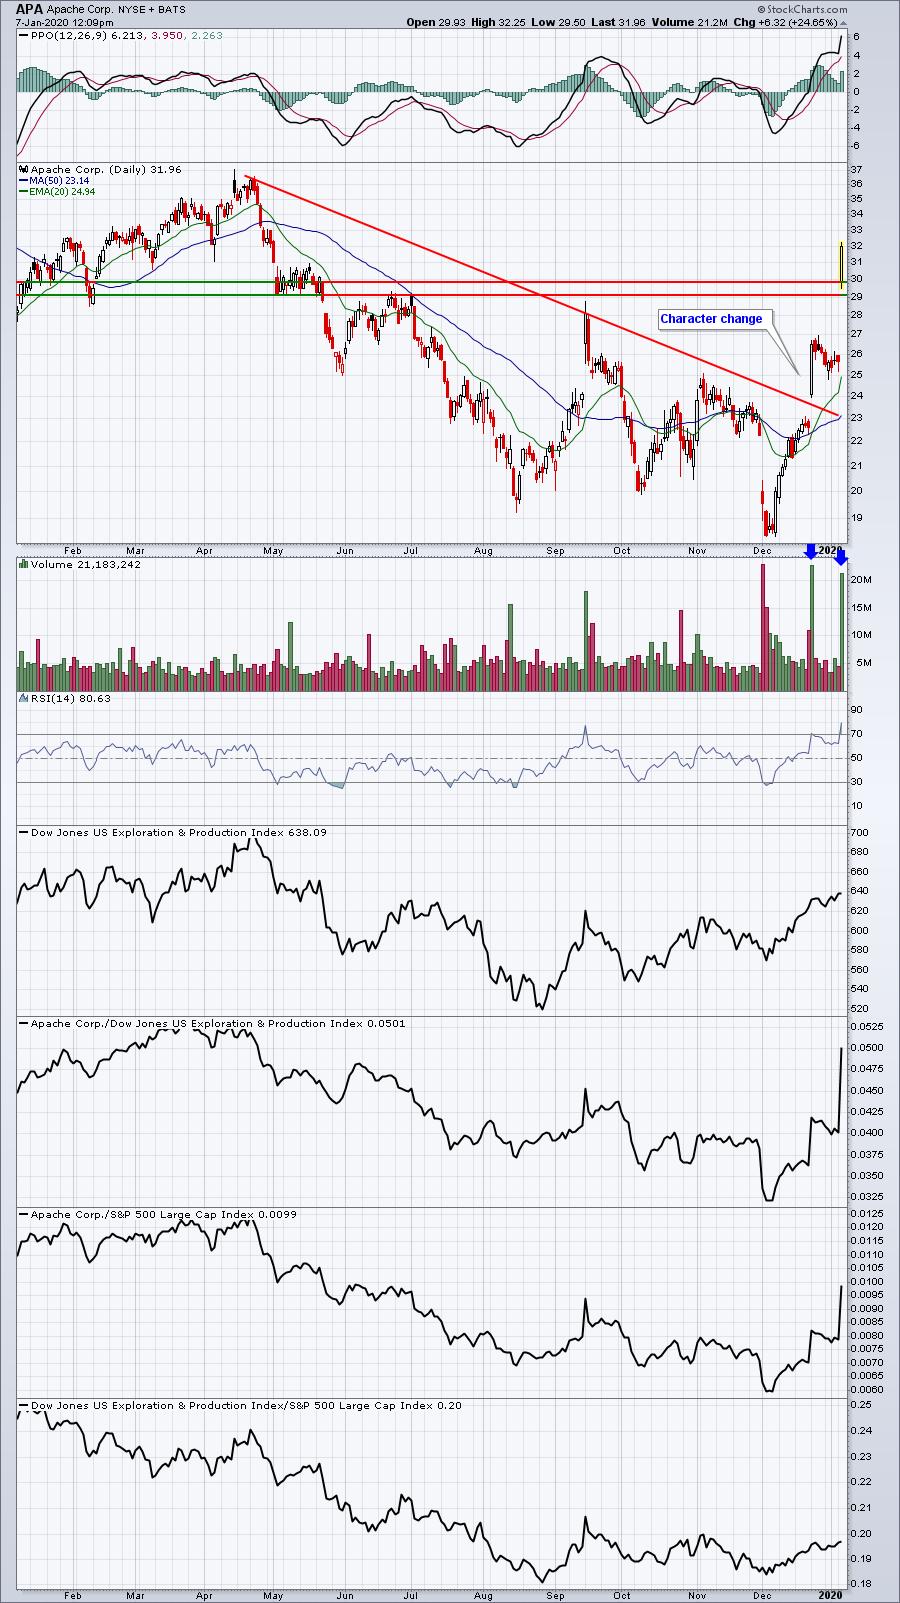
It's very difficult to chase a stock like APA after it's already made such a huge advance. However, adding it to a Technical Watch List would certainly make sense, while awaiting a bout of profit taking. The top of gap support and price support are provided with those two horizontal lines. APA could become quite interesting at that level, if we see some selling near-term.
Earnings Reports
Here are the key earnings reports for this week, featuring stocks with market caps of more than $5 billion. I also include a few select companies with market caps below $5 billion. Finally, any portfolio stocks (or active trade alerts) that will be reporting results are highlighted in BOLD. Please make sure you check for earnings dates for any companies you own or are considering owning:
Wednesday, January 8:
WBA, STZ, LEN, RPM. Others less than $5 bil: HELE, MSM, BBBY
Thursday, January 9:
SNX, AYI. Others less than $5 bil: KBH, SMPL
Friday, January 10:
INFY
Economic Reports
November factor orders: -0.7% (actual) vs. -0.7% (estimate)
December ISM non-manufacturing index: 55.0 (actual) vs. 54.5 (estimate)
Happy trading!
Tom