
EB Daily Market Report - Thursday, January 9, 2020
Executive Market Summary
- Initial jobless claims came in better than expected
- The 10 year treasury yield ($TNX) continued its week-long advance, hitting 1.90% earlier before pulling back
- Our major indices are strong again as the Dow Jones inched closer to a first-ever test of 29,000
- Technology (XLK) and financials (XLF), two aggressive sectors, are pacing today's rally
- Restaurants ($DJUSRU) are starting to show a bit of relative strength, led by Starbucks (SBUX)
- Our active trade alert SBH stopped out on Wednesday's close; VC is lower today
Special Event
Mark your calendar for Monday, January 13, 2020 at 4:30pm for a webinar, "The January Effect and Top 15 Stocks for 2020". It will be an educational event where I'll share the strong correlation between U.S. stock market performance in January and subsequent performance during the balance of the year. It's quite remarkable and held perfectly true in 2019. Get a leg up on others by watching January 2020 performance to see what it's suggesting we might see during the balance of 2020.
Also, at Market Vision 2020, I unveiled my Top 15 Stocks for 2020. They were based solely on the fact that these companies have based for very long periods and have either (1) just broken out, or (2) are on the verge of breaking out. I'd like for all EarningsBeats.com members to have this information, so here are the ticker symbols of the 15 stocks (in alphabetical order):
BKNG, CERN, DIS, HOLX, KSU, LEG, PCAR, PPG, QRVO, RCL, SWKS, VRTX, XLNX, XRX, ZBH
I'll review these 15 charts during the Monday webinar. As always, we'll record the webinar for those who cannot attend the event live.
Market Outlook
The primary reason I don't pay attention to bearish topping patterns in a secular bull market is that they rarely work. Topping structures in a secular bear market work with a much higher degree of success. I cannot begin to tell you how many times I've heard really bright technicians try to point to tops because of bearish patterns. And then those bearish patterns never confirm and are completely irrelevant. It's only an hourly chart of the S&P 500, but take my example from a couple days ago:
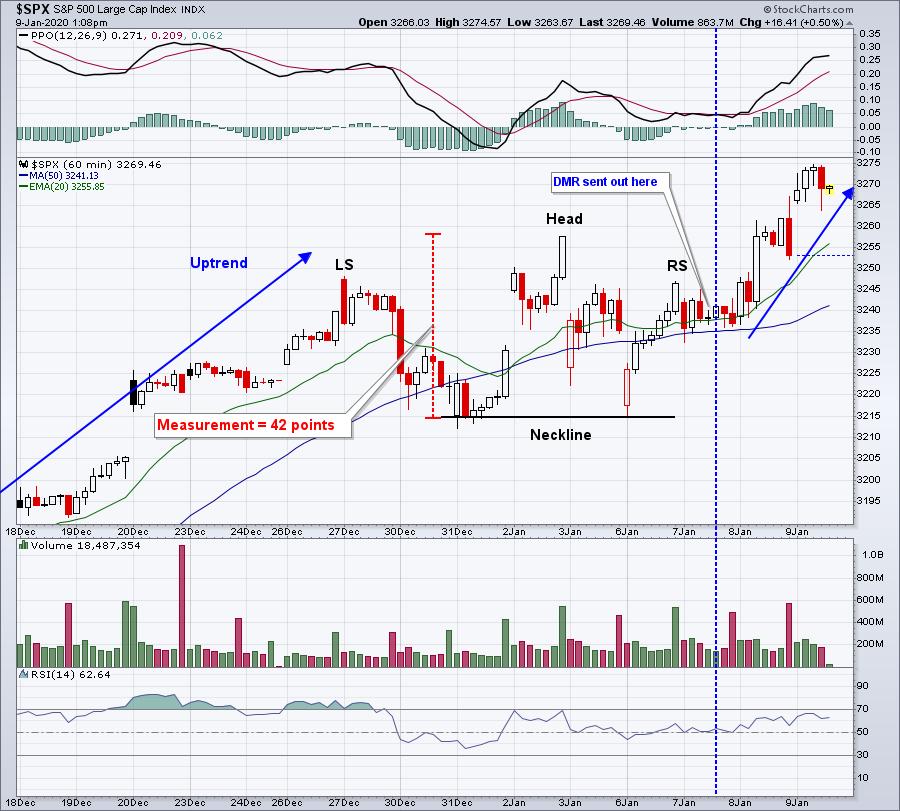
The blue-dotted vertical line represents roughly the time I sent out the DMR on Tuesday, pointing out the potential topping pattern. That was a beautiful, symmetrical bearish pattern....and it didn't work. It's generally a good idea to be aware of possible short-term and intermediate-term tops, but I wouldn't consider adjusting my trading strategy until we get confirmation of a breakdown. In the case above, that would be a higher volume breakdown beneath the neckline, which never occurred.
Now that we've moved back above the prior "head", the bearish pattern has been negated. The PPO is pointing higher, which now suggests selling will likely be contained at the rising 20 hour EMA.
Sector/Industry Focus
Transports ($TRAN) are in focus on the eve of our next nonfarm payrolls report, which is due out tomorrow morning at 8:30am EST. Keep in mind that a breakout in the TRAN would really add bullishness to the already strong U.S. stock market environment:
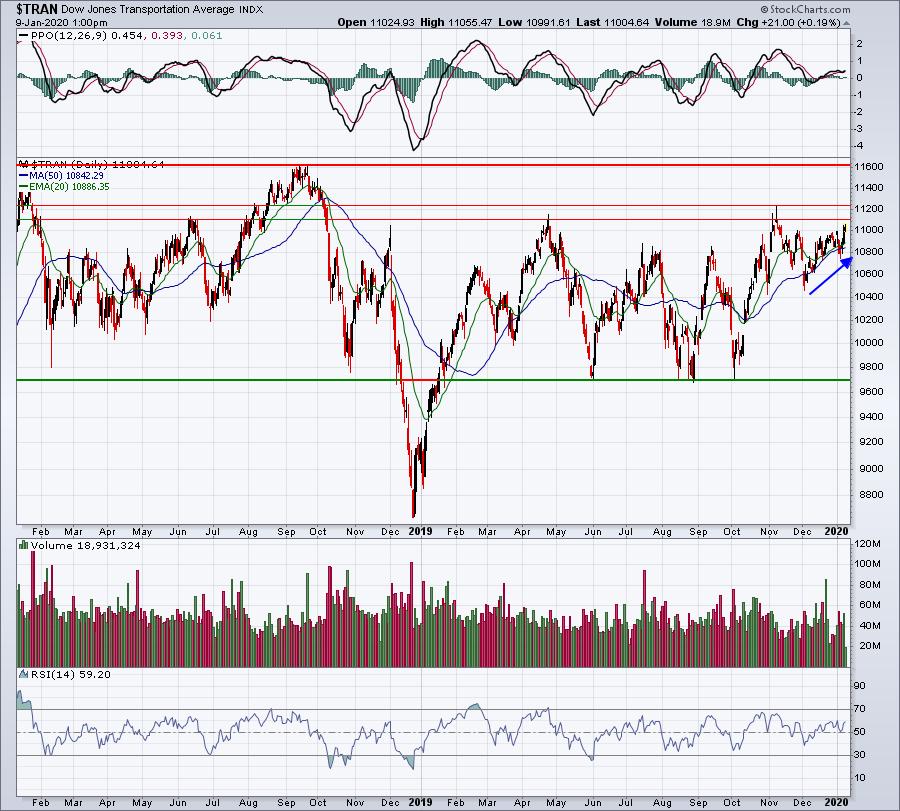
11100-11200 is a key short-term price resistance zone established throughout 2019. I believe we're going much higher, but to do so requires an initial breakout above this area. Tomorrow's nonfarm payrolls, if better than expected, could do the trick.
Active Trade Alerts
It's really important that you understand the purpose of our Active Trade Alerts. For us, it's an educational process of how to use the Strong Earnings ChartList, which is essentially our revolving Watch List of trading candidates. We are not looking to provide 10 Active Trading Alerts to fill out a portfolio. It's designed to walk everyone through how I trade, from the start of the trade to either our target being hit (or other profit level being reached), or our stop being triggered. It's just as important to limit your losses as it is to profit from big gains. Every day in the DMR, i'll keep you fully up-to-date on our Active Trade Alerts so that you can sense what I'm feeling about these trades on a daily basis.
I want to be clear about one other thing. You don't have to agree with me. You may love the trades I feature here or you may hate them. If certain trades don't appeal to you, don't trade them. Again, I want to provide education on how I trade. You might want to follow my strategy or you may not. You might pick up one or two ideas and add them to your own personal trading strategy, which is great.
Given that backdrop....
We have two active alerts right now as follows:
VC (-1.20%) - reports earnings on February 19. VC remains in its downtrend, not helped by the fact that auto parts ($DJUSAT) is down roughly 5% over the past few weeks. Our 5th and final entry at 84.00 is a bit more than 1% away and then we'll want to see gap support at 83.92 hold. We have a closing stop a bit beneath that level at 83.50. A bullish development would be a confirmed close back above the 20 day EMA.
SBH (-0.66%) - reports earnings on February 3. SBH triggered our final entry and then stopped out at Thursday's close. We wanted gap support at 16.64 to hold and it didn't. The close at 16.56 wasn't far below that support, but we simply do not want to take any chances. Keep losses small. SBH might bounce right back, but it could also easily see another 6-7% decline before the next support level near 15.50 is reached. Here's a quick summary of the chart, what we were looking for and why we exercised our closing stop:
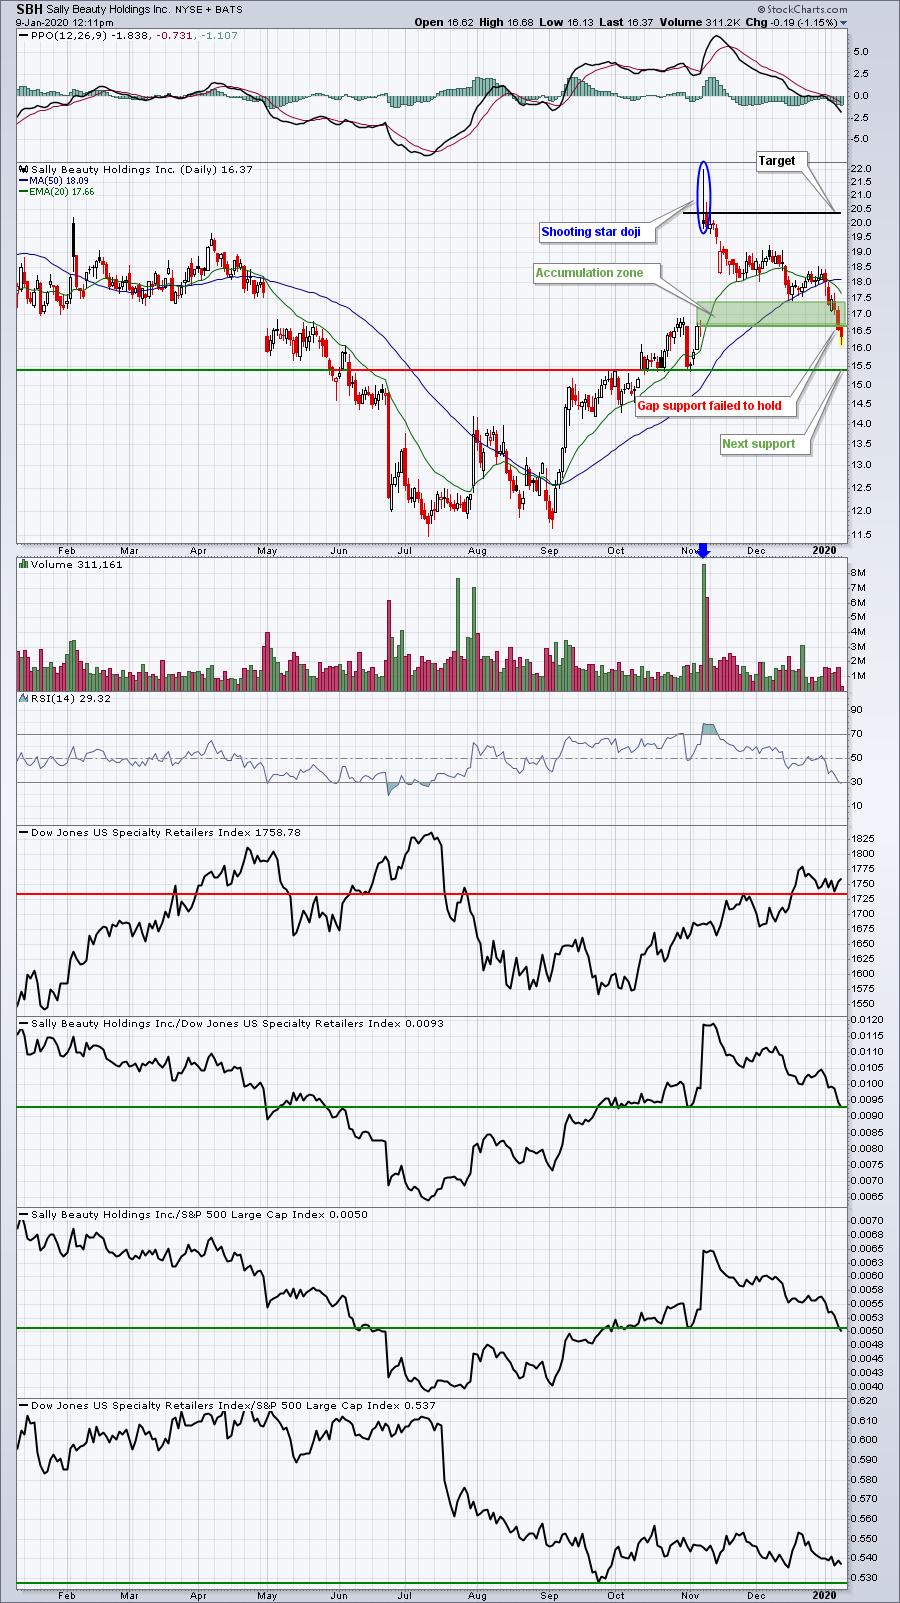
When we entered SBH, we did so for a few reasons. First, SBH posted better-than-expected revenues and EPS. The technical price reaction was rather bullish. SBH had closed at 16.64 before its earnings report and hit 22.00 the next day. I review the price action after the gap to gain a better understanding of what I believe the stock price will do. In the case of SBH, we saw a huge gap higher and an intraday high that continued the buying effort. However, by day's end, SBH had fallen all the way back to its open, leaving a long tail off the top. That's an indication to me that market makers were able to gain control of the action and were likely on the short side. Remember, my trading style is to try to attempt to be on the market maker's side on a trade. When I see a candle like that shooting star on massive volume, I look for further selling. And I hold off on buying. As we moved closer and closer to the green shaded area, the potential reward looked solid compared to the risk of gap support at 16.64 not holding. That's when SBH was provided as an active trade alert with multiple entries. Since we no longer need to worry about commissions, entering at several prices makes great sense to further reduce our risk. There's no added cost for multiple purchases.
In addition to setting a target, I set a max pain level where I will exit. I do this on every trade. Sometimes I get stopped out just before a big reversal. But sometimes I save a BUNDLE by allowing my stop to execute just before a massive selloff in a stock. I can handle small losses, but the big losses are very difficult to overcome and still outperform the benchmark S&P 500 index over time.
When I look at SBH, I don't view it as a bad trade. It simply didn't work.
If you're still holding SBH, today's low really needs to be the bottom. You want to see a big reversal today, with a close back above the open. Those stopped out at yesterday's close could even re-open their position, but if you choose that route, I'd absolutely keep an intraday stop beneath today's low of 16.13.
Strong Earnings ChartList (SECL)
We have updated our SECL and here is the link (you must enter the password provided just below the link):
You'll be prompted to enter a password. Here it is: Earnings123 (exactly like this)
Also, make sure you're signed into your StockCharts.com account. I have tested it and it worked perfectly for me.
You will have the choice to add a "new list", "merge with list", and "replace list". I'd suggest using "replace list", which simply erases the prior list and adds the new list to an EXISTING ChartList. Then scroll down to the ChartList that contains all of the SECL stocks and click on it. An "Include ChartStyles" box should be checked (default) to ensure that my ChartStyles and annotations are included.
The above applies IF you're a StockCharts.com Extra member or above. If you have a membership at StockCharts that's lower than Extra, you'll be able to view the charts one at a time and download them to your account one at a time, but you'll need to upgrade in order to be able to download the entire ChartList into your account.
If you're not a paying member of StockCharts, you'll only be able to view the ChartList, one stock at a time. I'd strongly encourage you to begin a 30 day free trial at StockCharts.com to experience the true value of an EarningsBeats.com member. The reason is simple. I use StockCharts and have been a member for nearly two decades. It's a big part of my trading strategy and style. In order to get the most out of your EarningsBeats.com membership, you really need to be an Extra member or above at StockCharts.com.
Once you download this ChartList, if you have any questions, please submit your question(s) to [email protected]. PLEASE do not send your questions to support at StockCharts.com. We should be able to help resolve any issues that you might encounter.
After we ensure that everything is working for everyone, we'll provide you links to our four portfolios: Model, Aggressive, Income, and Value.
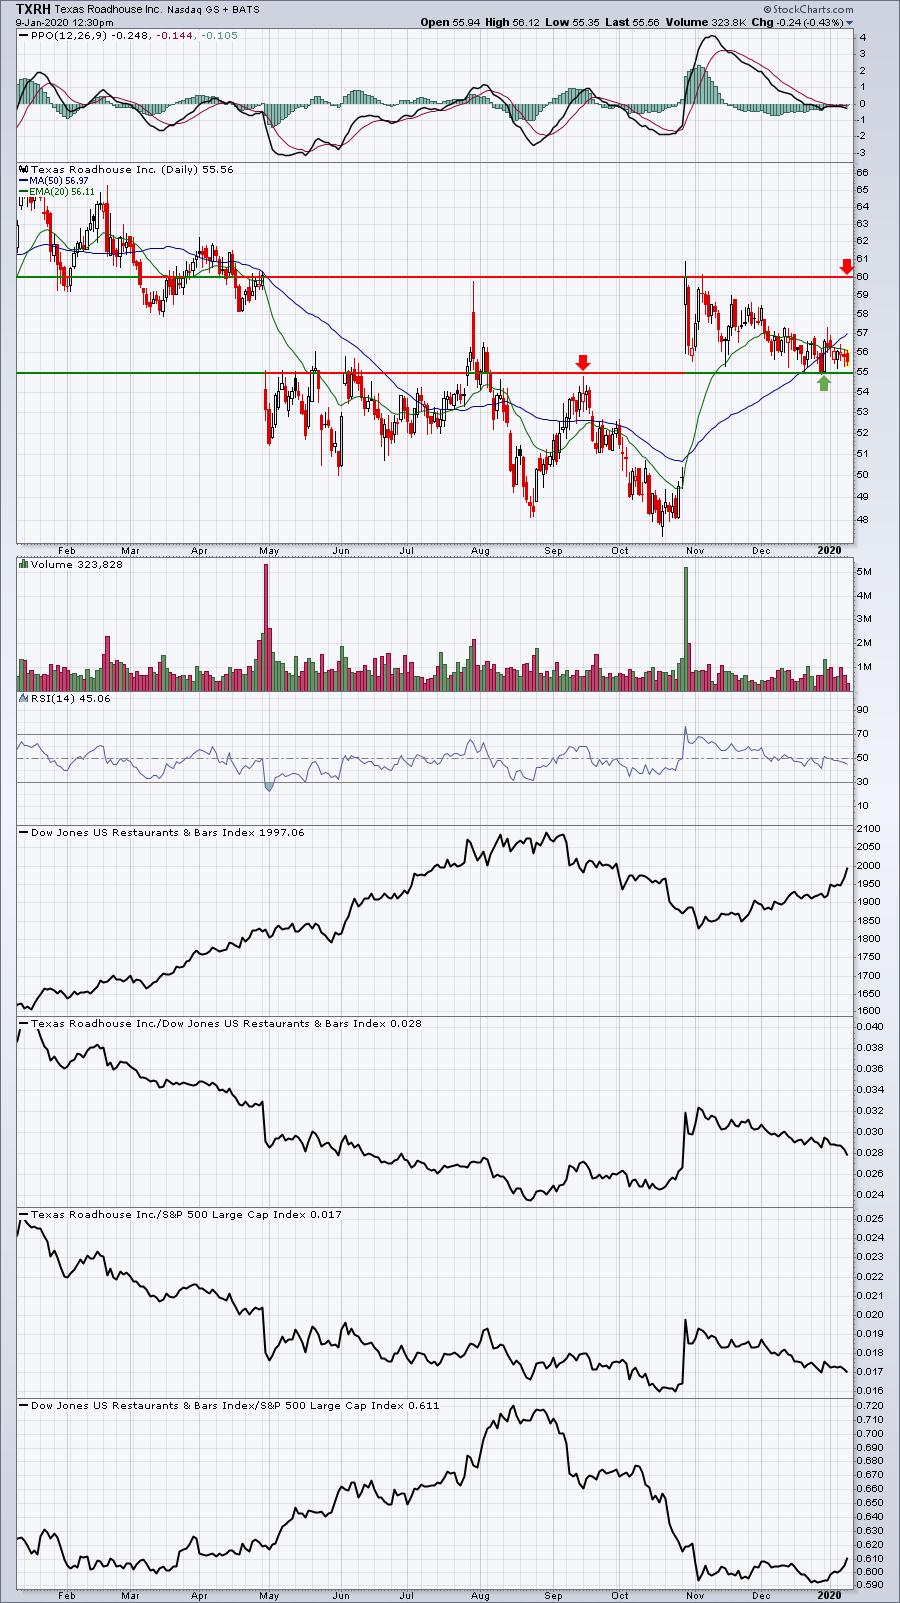
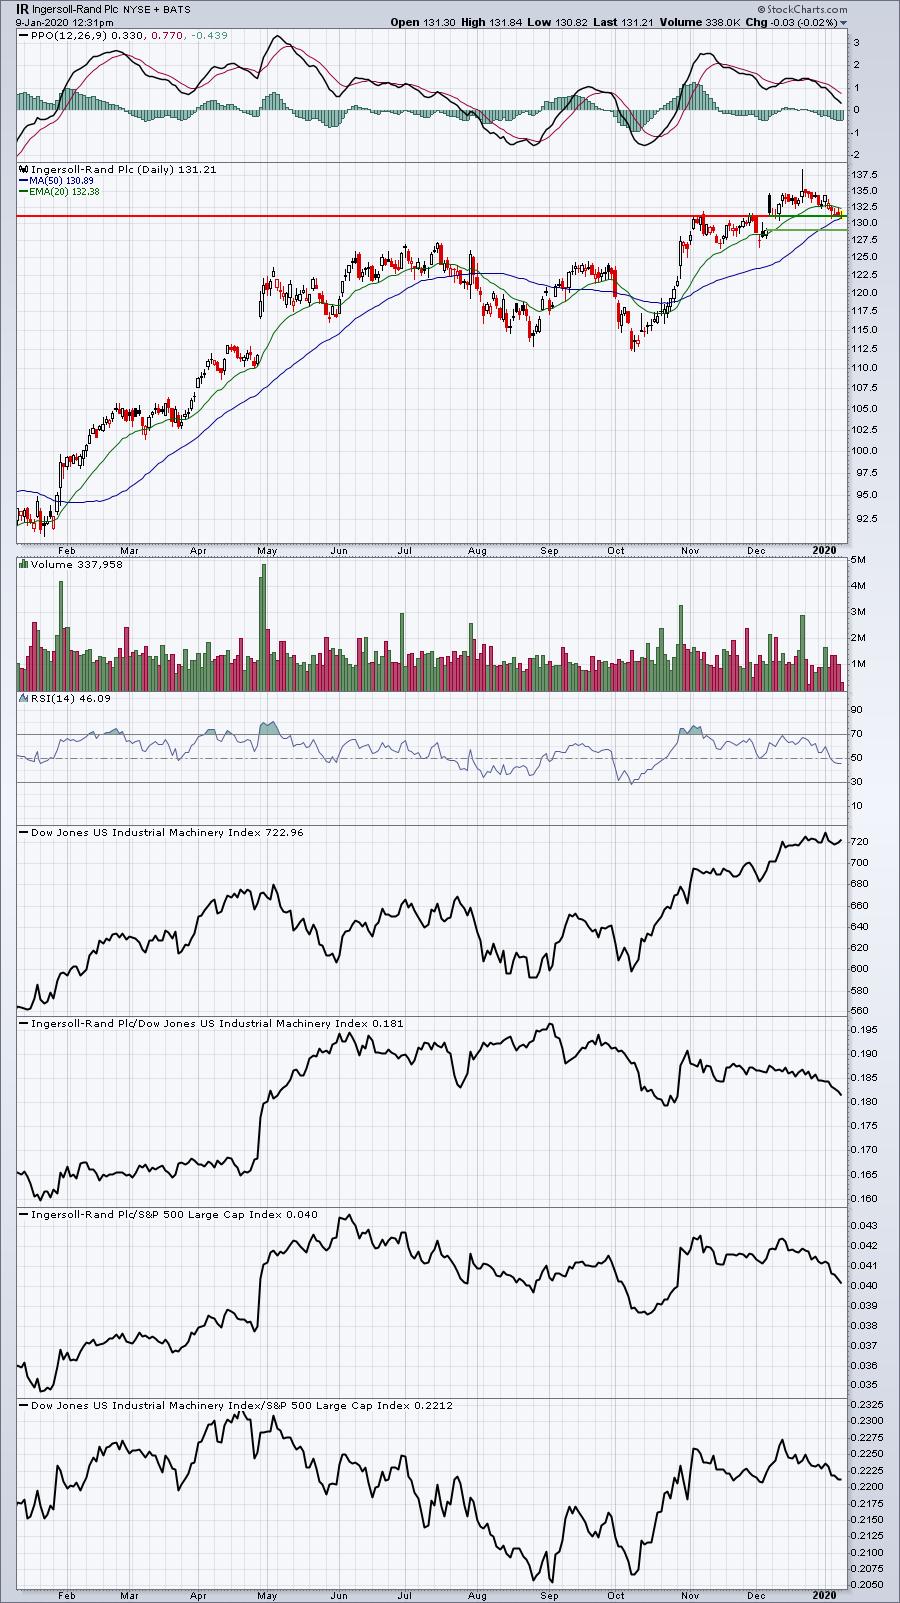
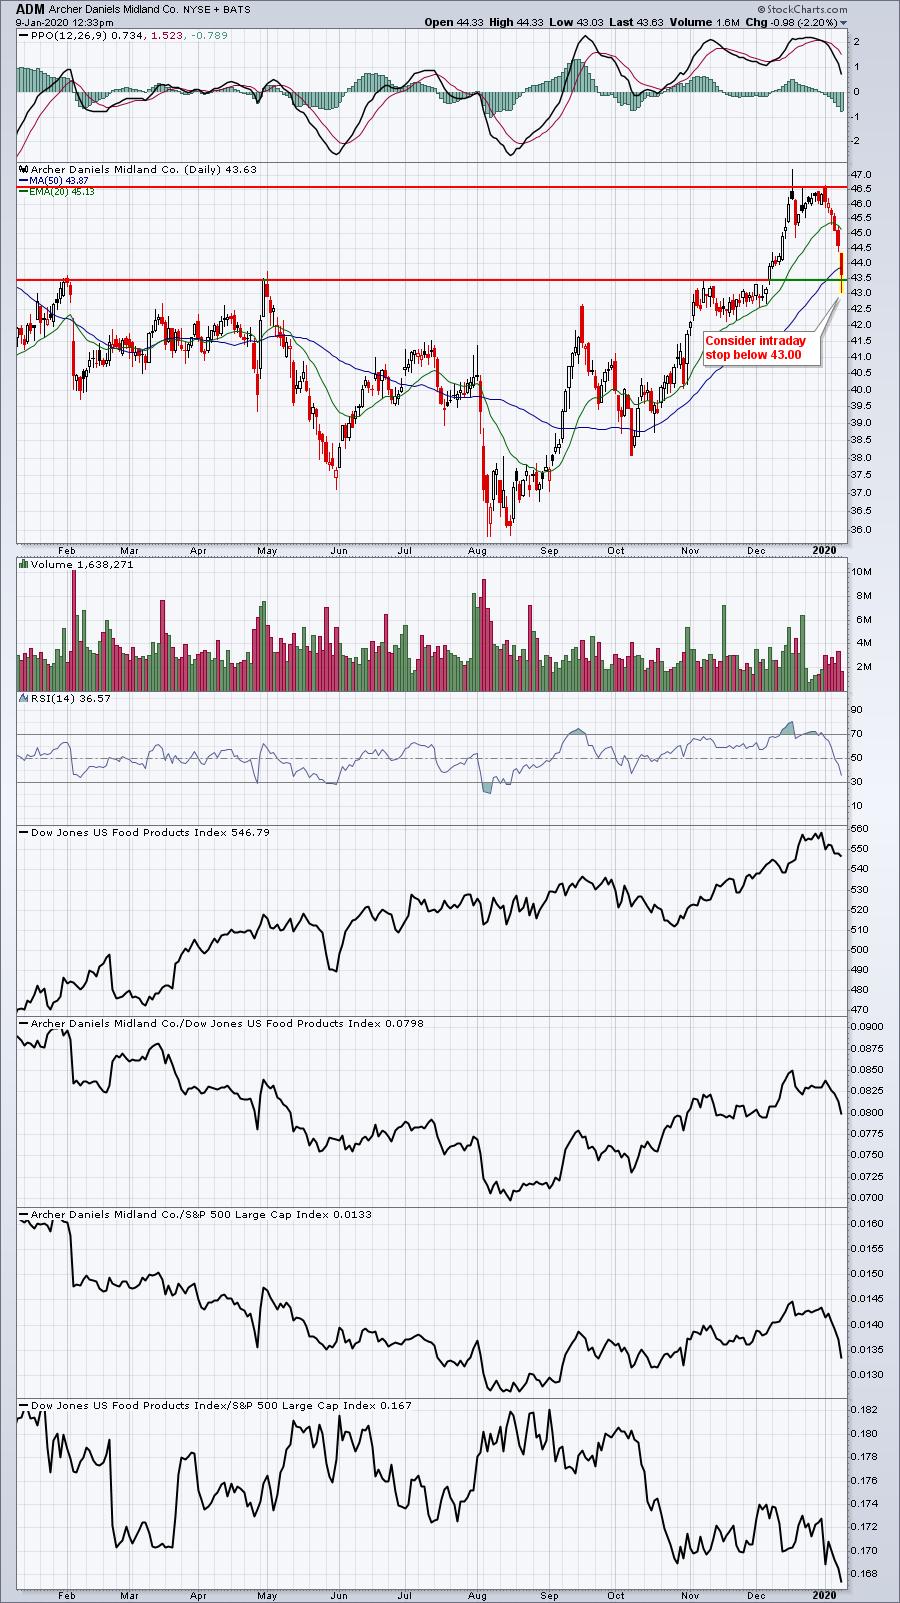
For today, there was an SECL stock that looked very solid, testing key support:
TXRH:
IR:
ADM:
VCEL:
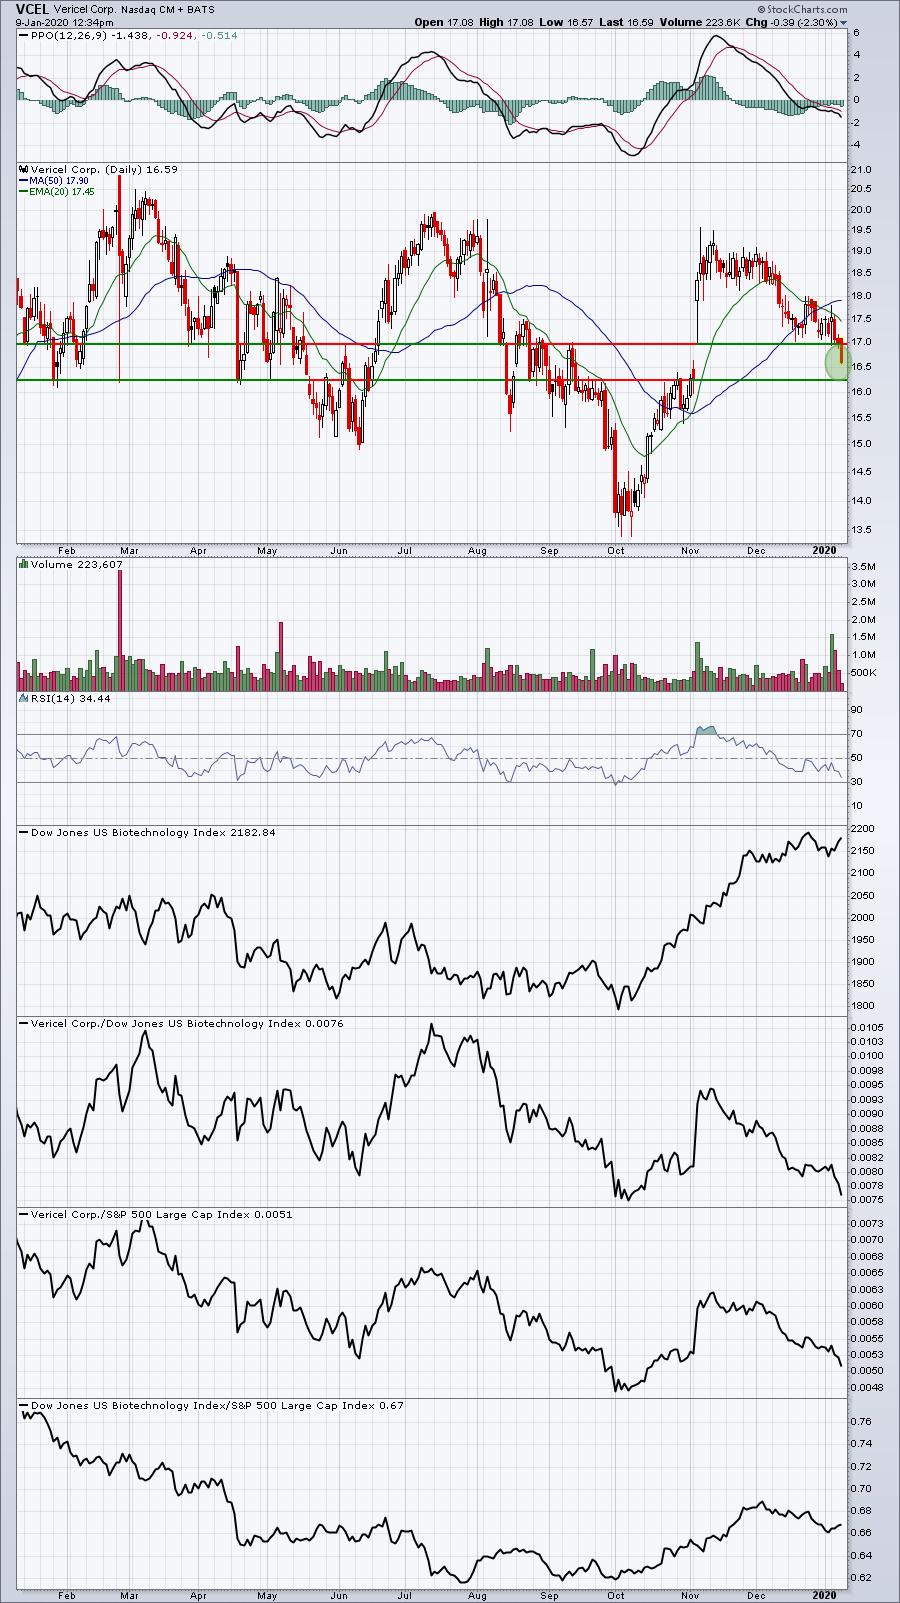
Stocks like these that have been trending lower and are at or approaching key support, I look for reversing candles - hammers, dojis, bullish engulfing candles, etc. The beauty of these candles is that their intraday lows can be used as intraday stops. Some traders prefer intraday stops over closing stops. I feel better about using intraday stops when I have a major low supported by a reversing candle. I wouldn't want that intraday low to be violated.
Movers & Shakers
Here are a few stocks that I picked up off the SCTR mover lists:
JEF:
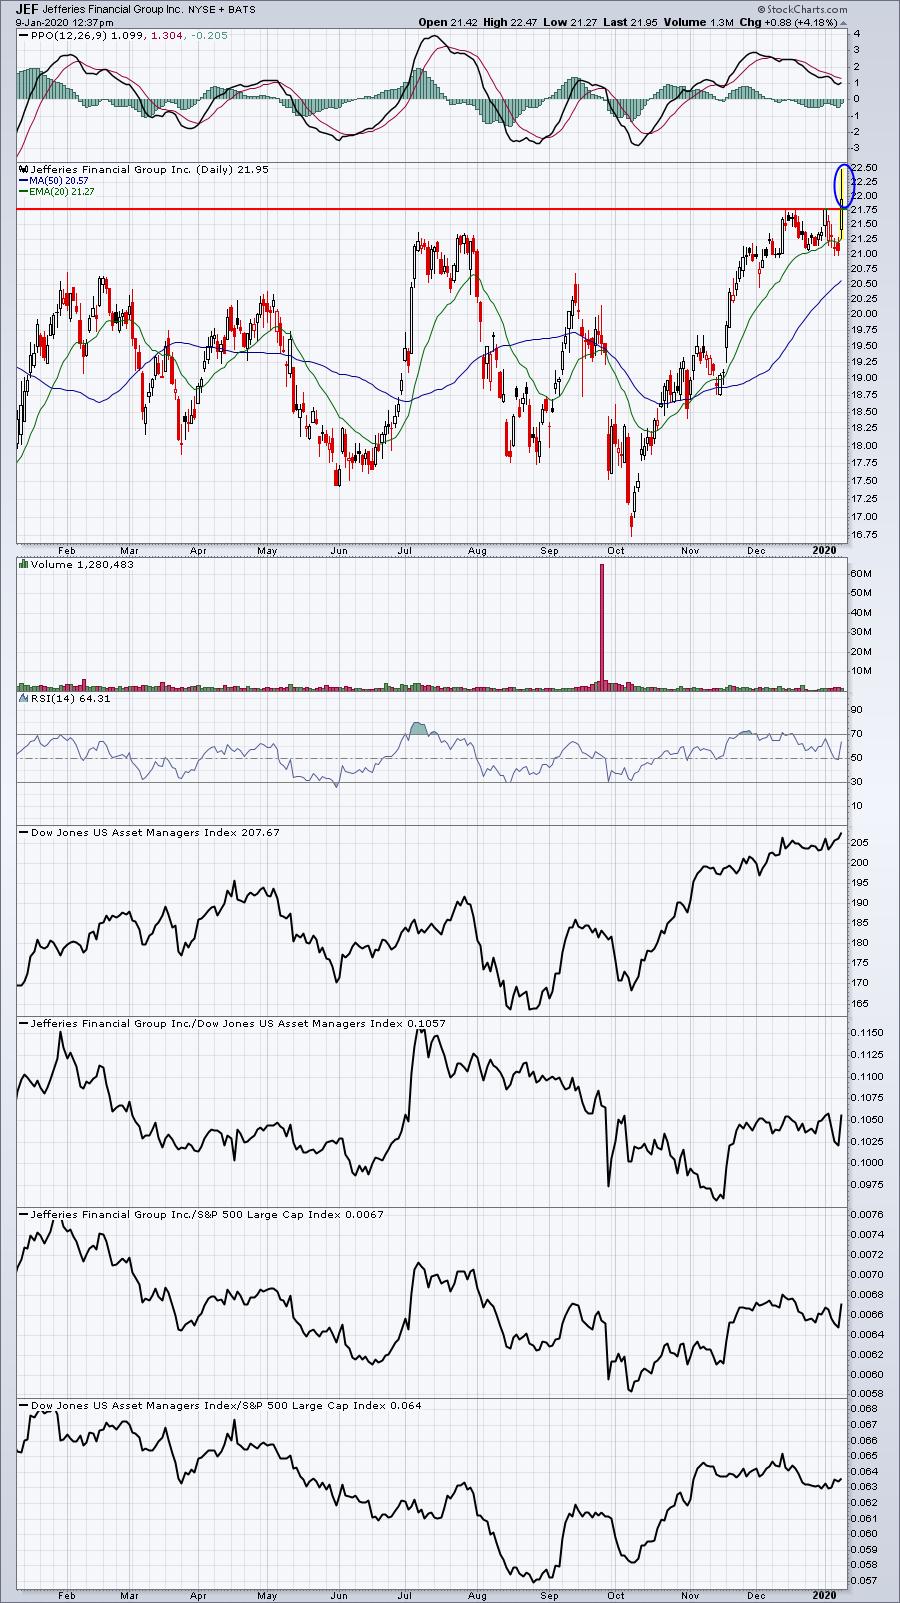
Can JEF confirm its breakout on the close? A rally accompanied by stronger volume would make me feel better about the continuation of this advance.
SBUX:
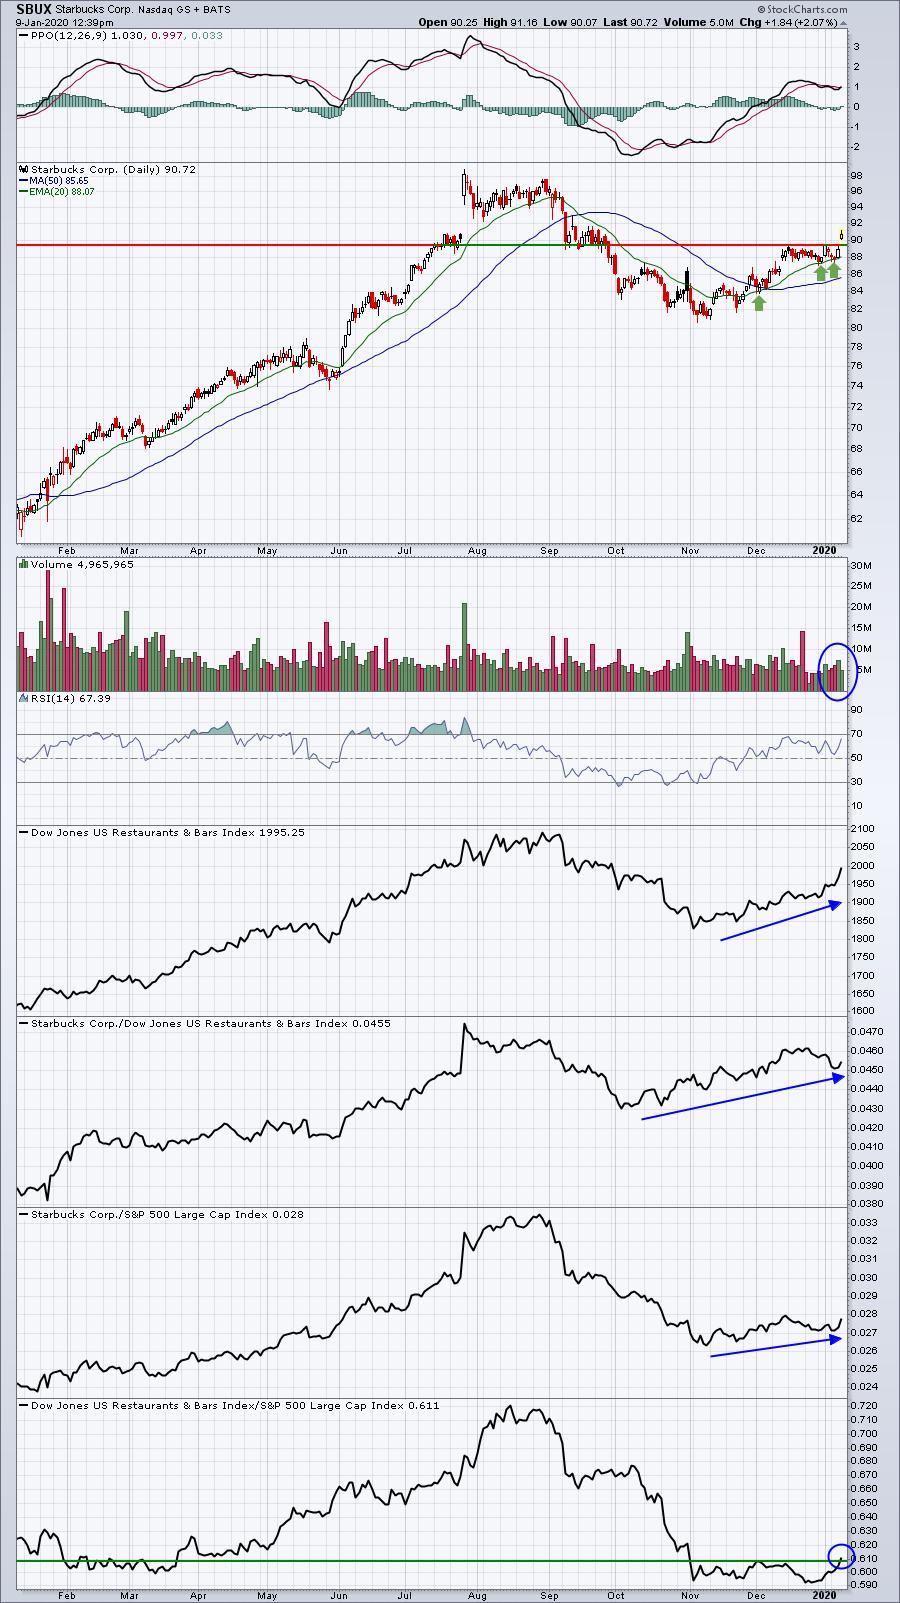
This is beginning to look like a pre-earnings run higher. Restaurants ($DJUSRU) are finally coming to life on a relative basis and SBUX is showing relative strength among its peers. Throw in the successful 20 day EMA tests and today's move to a 3 month high on increasing volume and it appears Wall Street is looking for a big upcoming earnings report.
AMRX:
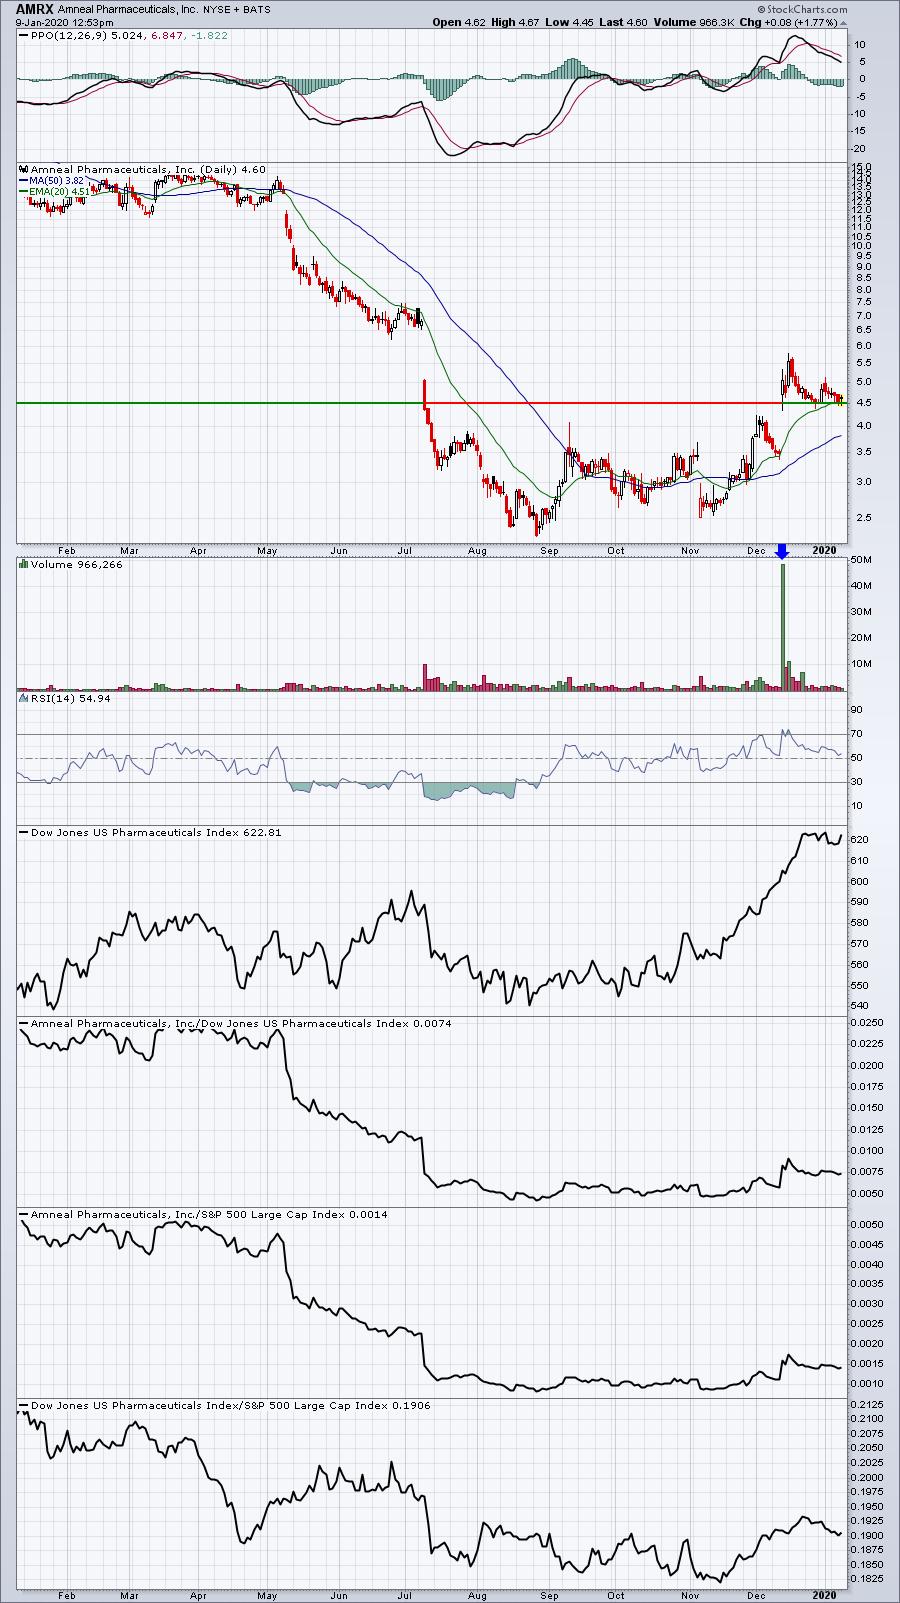
AMRX seems to be reversing its prior trend, but it's extremely volatile as those huge gaps in both directions should remind us. Pharmas ($DJUSPR) are strong and AMRX has shown relative strength of late. Still, there's big risk in trading a stock like this one.
Earnings Reports
Here are the key earnings reports for this week, featuring stocks with market caps of more than $5 billion. I also include a few select companies with market caps below $5 billion. Finally, any portfolio stocks (or active trade alerts) that will be reporting results are highlighted in BOLD. Please make sure you check for earnings dates for any companies you own or are considering owning:
Thursday, January 9:
SNX, AYI. Others less than $5 bil: KBH, SMPL
Friday, January 10:
INFY
Economic Reports
Initial jobless claims: 214,000 (actual) vs. 219,000 (estimate)
Happy trading!
Tom