
EB Daily Market Report - Friday, January 10, 2020
Note
I sent an SECL link to everyone yesterday in the DMR and I know many of you had issues downloading the ChartList. I contacted StockCharts and they assured me that the error had nothing to do with our new tool. Instead, there was a separate technical issue that they were working on and it should be fixed now. This morning, I was able to download the ChartList from that link into my account with no issues. I also tried it while signed out of my StockCharts.com account and I was able to view the charts. So for those of you that are non-members of StockCharts.com, you should still be able to view the charts. Hopefully, you won't have any issues today.
CLICK HERE to start the SECL viewing and/or download process.
You'll be prompted to enter a password. Here it is: Earnings123 (exactly like this)
Also, make sure you're signed into your StockCharts.com account (if you're a member).
You will have the choice to add a "new list", "merge with list", and "replace list". I'd suggest using "replace list", which simply erases the prior list and adds the new list to an EXISTING ChartList. Then scroll down to the your ChartList that contains all of the SECL stocks and click on it. An "Include ChartStyles" box should be checked (default) to ensure that my ChartStyles and annotations are included.
The above applies IF you're a StockCharts.com Extra member or above. If you have a membership at StockCharts that's lower than Extra, you'll be able to view the charts one at a time and download them to your account one at a time, but you'll need to upgrade in order to be able to download the entire ChartList into your account.
If you're not a paying member of StockCharts, you'll only be able to view the ChartList, one stock at a time. I'd strongly encourage you to begin a 30 day free trial at StockCharts.com to experience the true value of an EarningsBeats.com member. The reason is simple. I use StockCharts and have been a member for nearly two decades. It's a big part of my trading strategy and style. In order to get the most out of your EarningsBeats.com membership, you really need to be an Extra member or above at StockCharts.com.
Once you download this ChartList, if you have any questions, please submit your question(s) to [email protected]. PLEASE do not send your questions to support at StockCharts.com. We should be able to help resolve any issues that you might encounter.
After we ensure that everything is working for everyone, we'll provide you links to our four portfolios: Model, Aggressive, Income, and Value.
Executive Market Summary
- Nonfarm payrolls came in slightly below expectations, but that's ok
- The 10 year treasury yield ($TNX) is down 3 basis points to 1.83% at last check
- Real estate (XLRE) is leading in early action, while financials (XLF) lag with the lower TNX
- Homebuilders ($DJUSHB) and gold-related stocks are leading
- Our only active trade alert VC is lower today and has triggered our final entry at 84.00
Special Event
Mark your calendar for Monday, January 13, 2020 at 4:30pm for a webinar, "The January Effect and Top 15 Stocks for 2020". It will be an educational event where I'll share the strong correlation between U.S. stock market performance in January and subsequent performance during the balance of the year. It's quite remarkable and held perfectly true in 2019. Get a leg up on others by watching January 2020 performance to see what it's suggesting we might see during the balance of 2020.
Also, at Market Vision 2020, I unveiled my Top 15 Stocks for 2020. They were based solely on the fact that these companies have based for very long periods and have either (1) just broken out, or (2) are on the verge of breaking out. I'd like for all EarningsBeats.com members to have this information, so here are the ticker symbols of the 15 stocks (in alphabetical order):
BKNG, CERN, DIS, HOLX, KSU, LEG, PCAR, PPG, QRVO, RCL, SWKS, VRTX, XLNX, XRX, ZBH
I'll review these 15 charts during the Monday webinar. As always, we'll record the webinar for those who cannot attend the event live.
Market Outlook
I don't expect any major issues near-term technically. I'm looking for a solid earnings season, which will help to explain why we've been seeing gains day after day in U.S. stocks. I'd simply keep a close eye on 20 period EMAs - first the hourly, then the daily, then the weekly.
Thus far, the S&P 500 is up roughly 1.5% in January. At Monday's event, I'll share the level that the S&P 500 will need to reach by January 31st for January 2020 to move into the top quadrant of all Januarys since 1950. It's significant because there's a very strong correlation between being in that top 25% of Januarys and having a very solid balance of the year from February 1 through December 31.
Sector/Industry Focus
We've been in an environment of more U.S. economic improvement than in foreign countries. I believe that could be changing. I believe the U.S. economy is stronger, but the improvement may be greater in other areas of the world, like Germany for instance. Bond markets are economic proxies. When we begin to see economic strength ahead, bonds are sold and yields rise. Currently, the U.S. 10 year treasury yield ($UST10Y), which had been rising much faster than the German 10 year treasury yield ($DET10Y), is now moving lower on a relative basis:
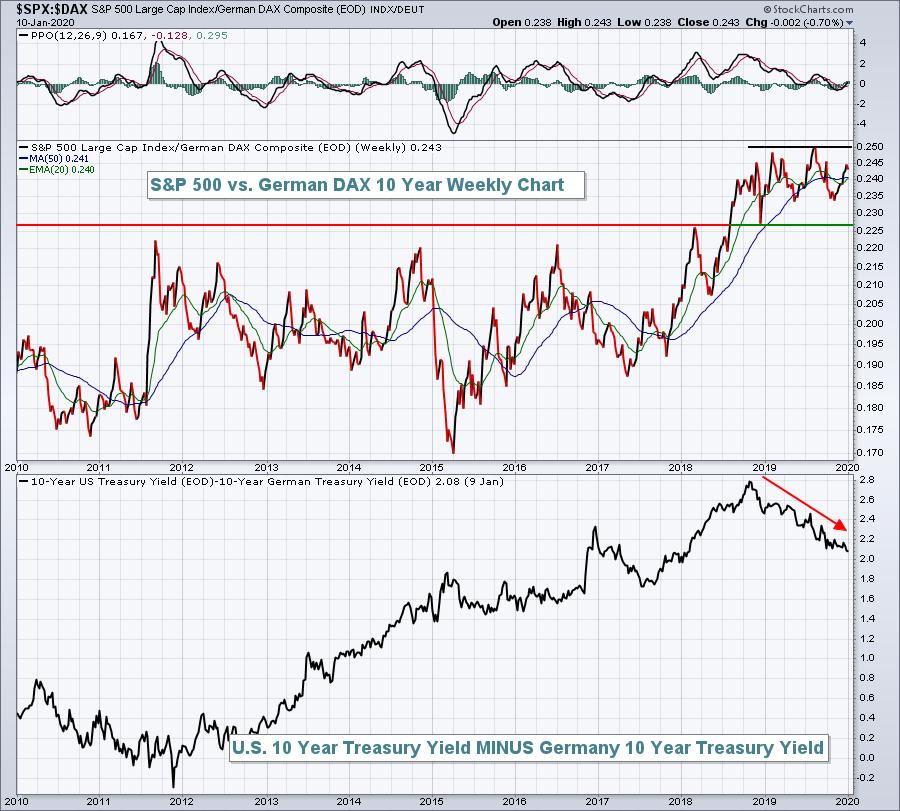
This combined with the weakening U.S. Dollar ($USD) suggests that the ETF that tracks German stocks (EWG) is likely to be an outperformer in 2020. The better stock market performance in Germany would be further aided by a weakening dollar. The EWG outperforms the $DAX when the dollar falls vs. its local currency.
Active Trade Alerts
We have just one active alert right now:
VC (-0.17%) - reports earnings on February 19. VC continues to struggle with the auto parts group ($DJUSAT), but it's resulted in all 5 of our entry points being triggered now. Our final entry of 84.00 hit this morning and our average entry price is 86.05. We have a very tight closing stop of 83.50 that we'll honor. That gives VC just a bit of room beneath gap support at 83.92, which was filled earlier this morning. If you prefer to give a bit more room, maybe consider 1% closer to 83.00. We prefer tight stops to limit losses. Here's a chart showing the filling of the gap:
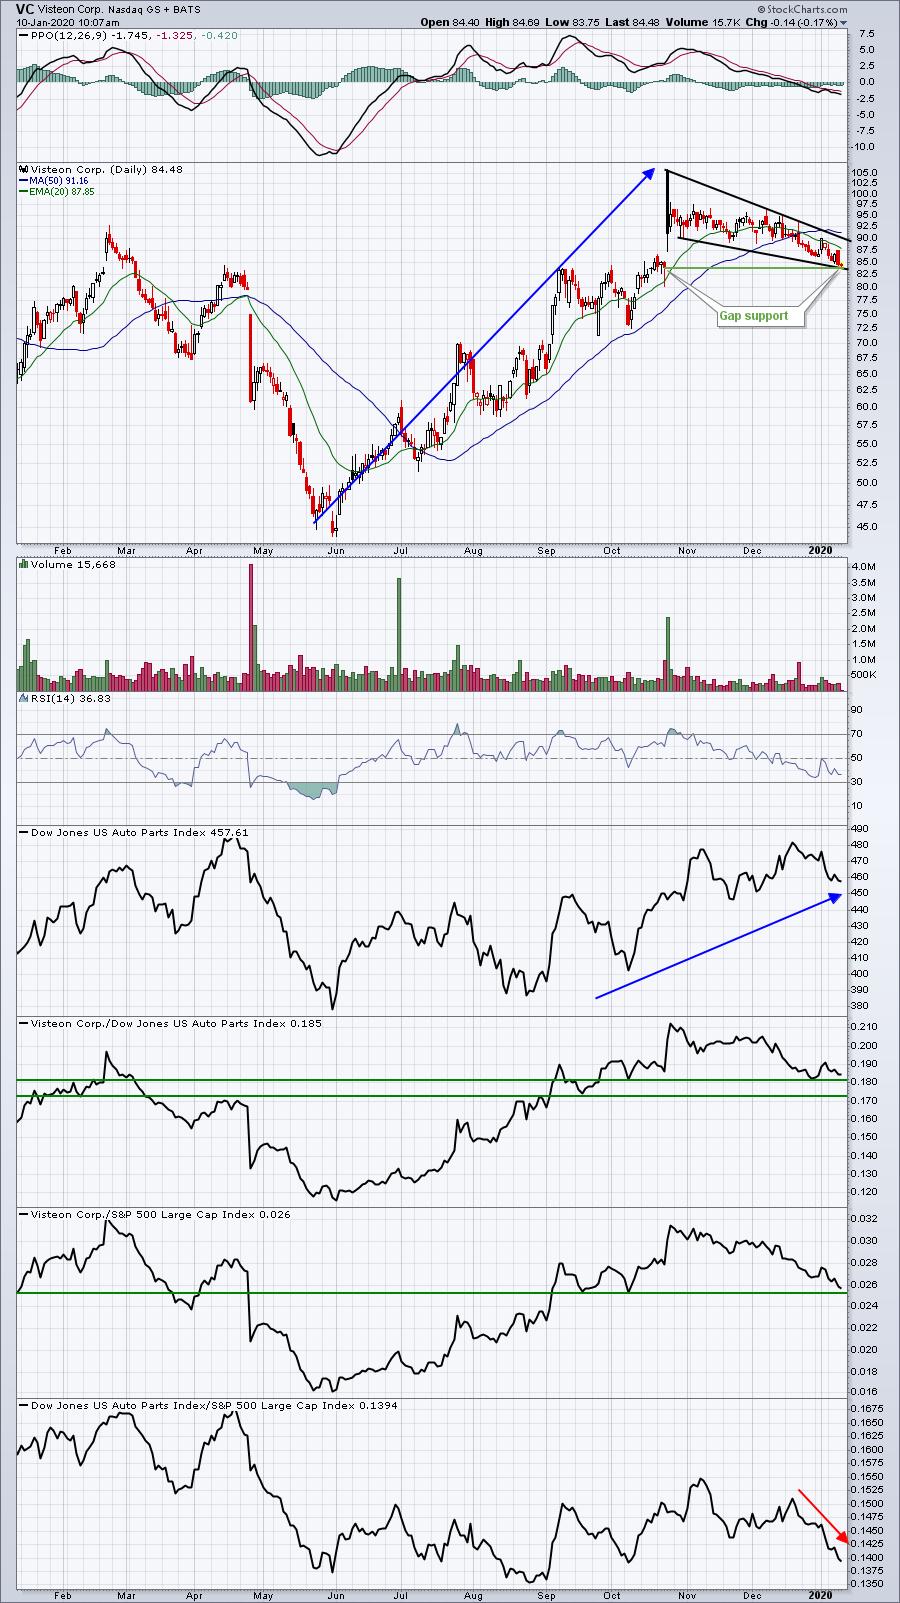
The red directional line in the bottom panel really summarizes this trade thus far. Auto parts ($DJUSAT) have been a relative laggard and that's allowed VC to return to gap support. We want it to hold here or we'll exit.
Strong Earnings ChartList (SECL)
We provided the SECL link above so that each of you can view the list or download it.
For today, I ran a quick scan looking for SECL stocks showing unusually high volume --- .5 times normal daily volume as of 10:11am EST. Here are the stocks in SCTR order (highest to lowest):
FLXN, RH, ZG, BYND, BGG, LK (no SCTR). Here are three that looked interesting:
FLXN:
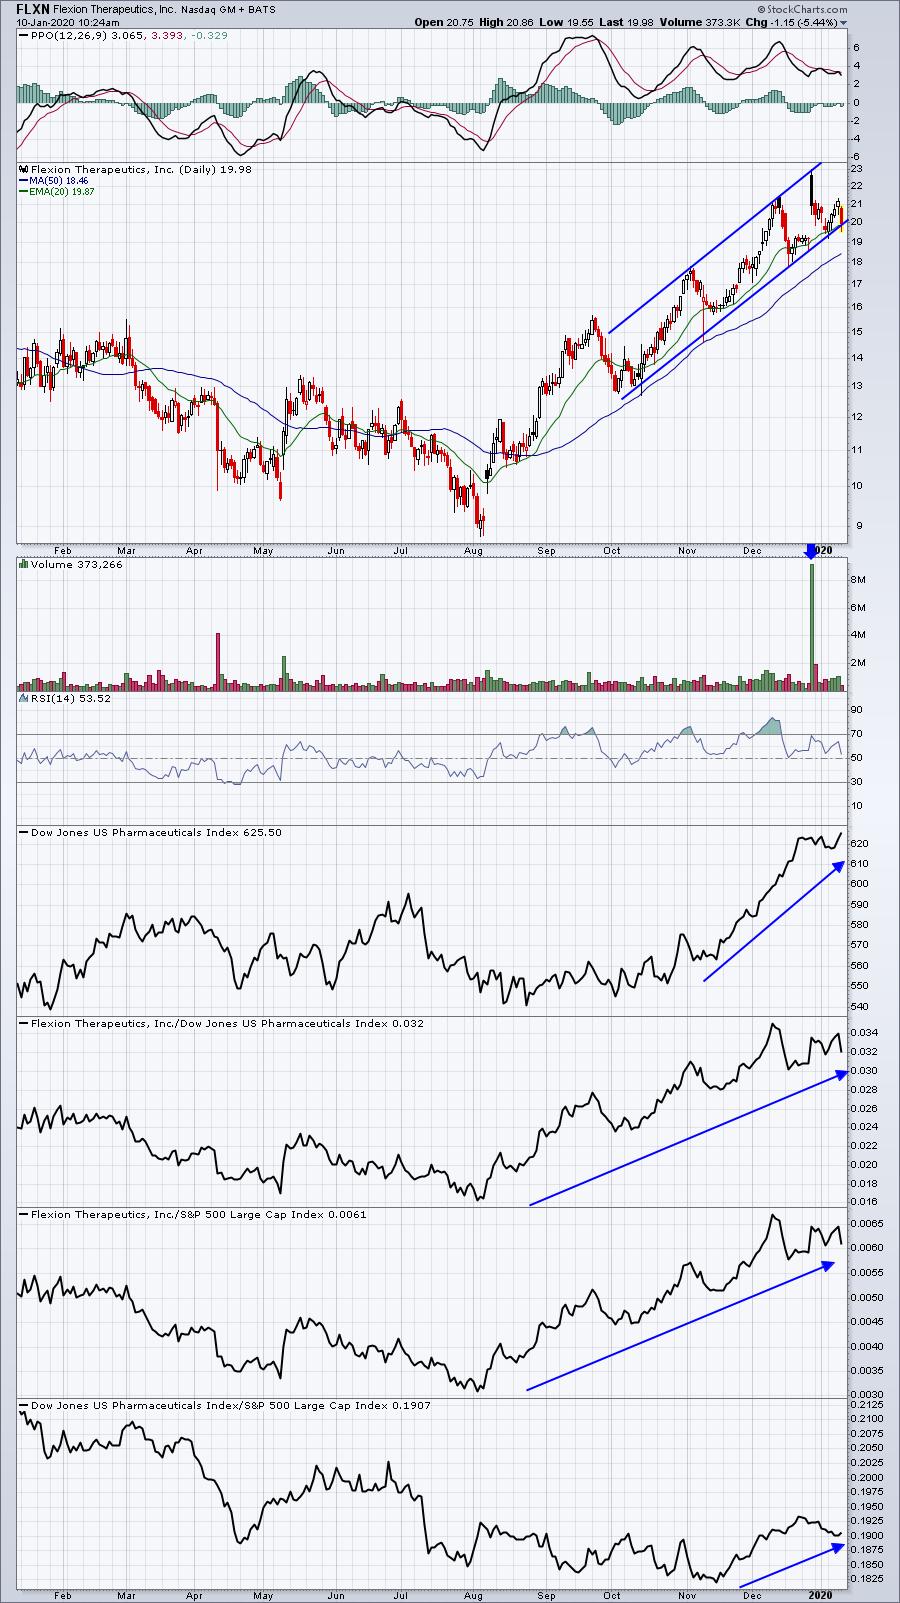
FLXN has been in a very tight channel the past few months. It needs to reverse today off its 20 day EMA test or I'd be looking for a 50 day SMA test.
BYND:
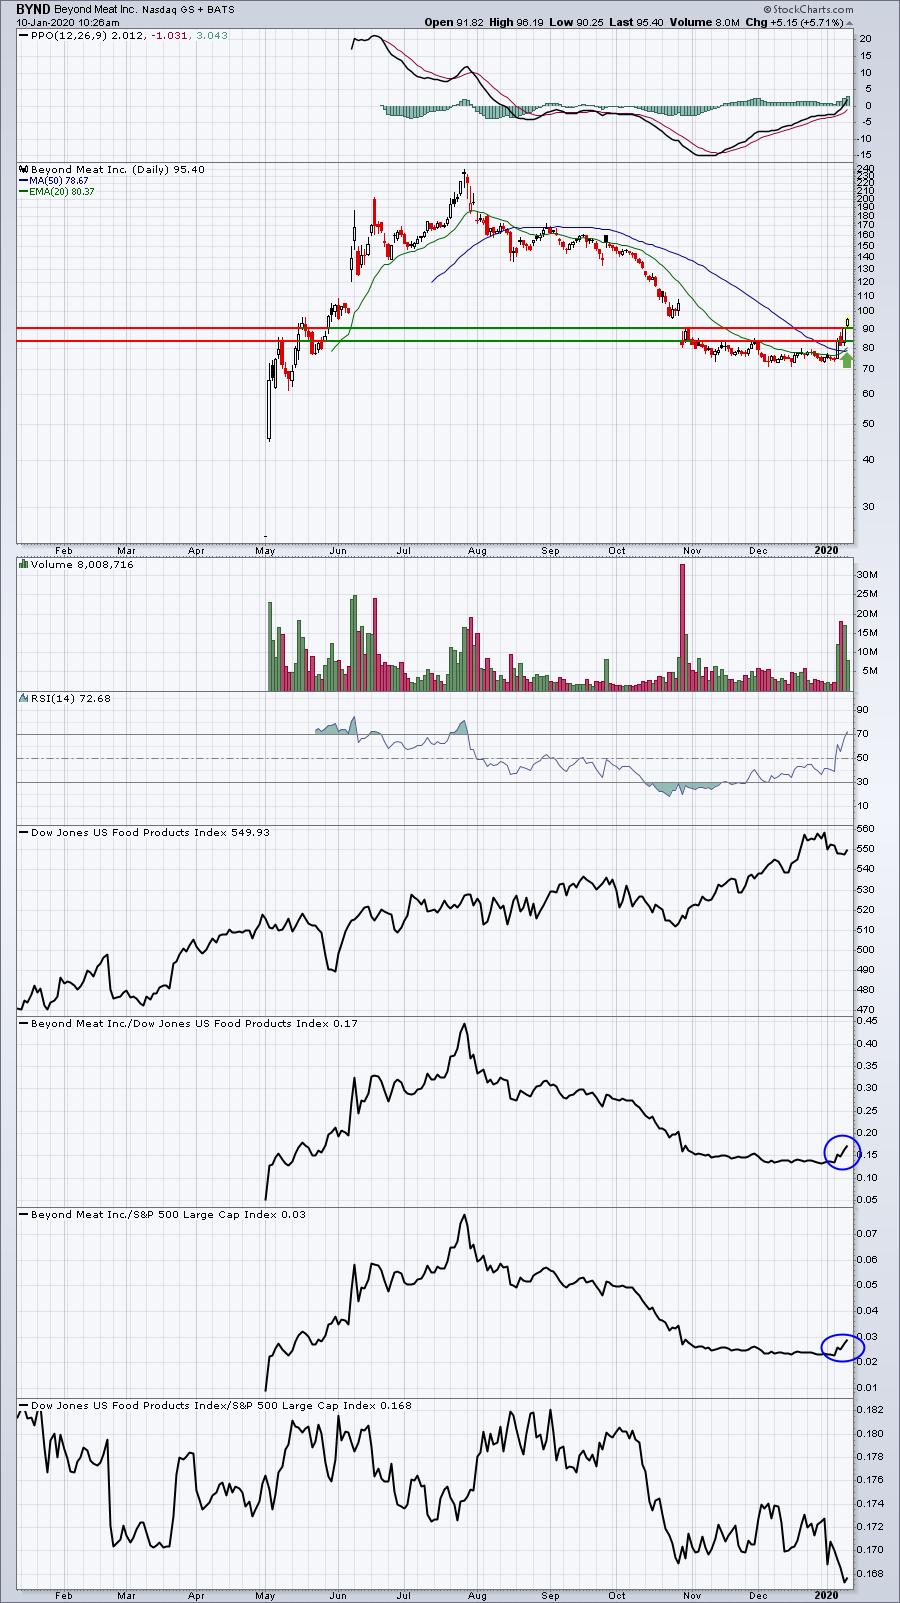
It's been awhile, but BYND is finally showing technical life again. There's a golden cross (green arrow) in place as the 20 day EMA has moved back above the 50 day SMA, a necessary ingredient to reverse a downtrend.
BGG:
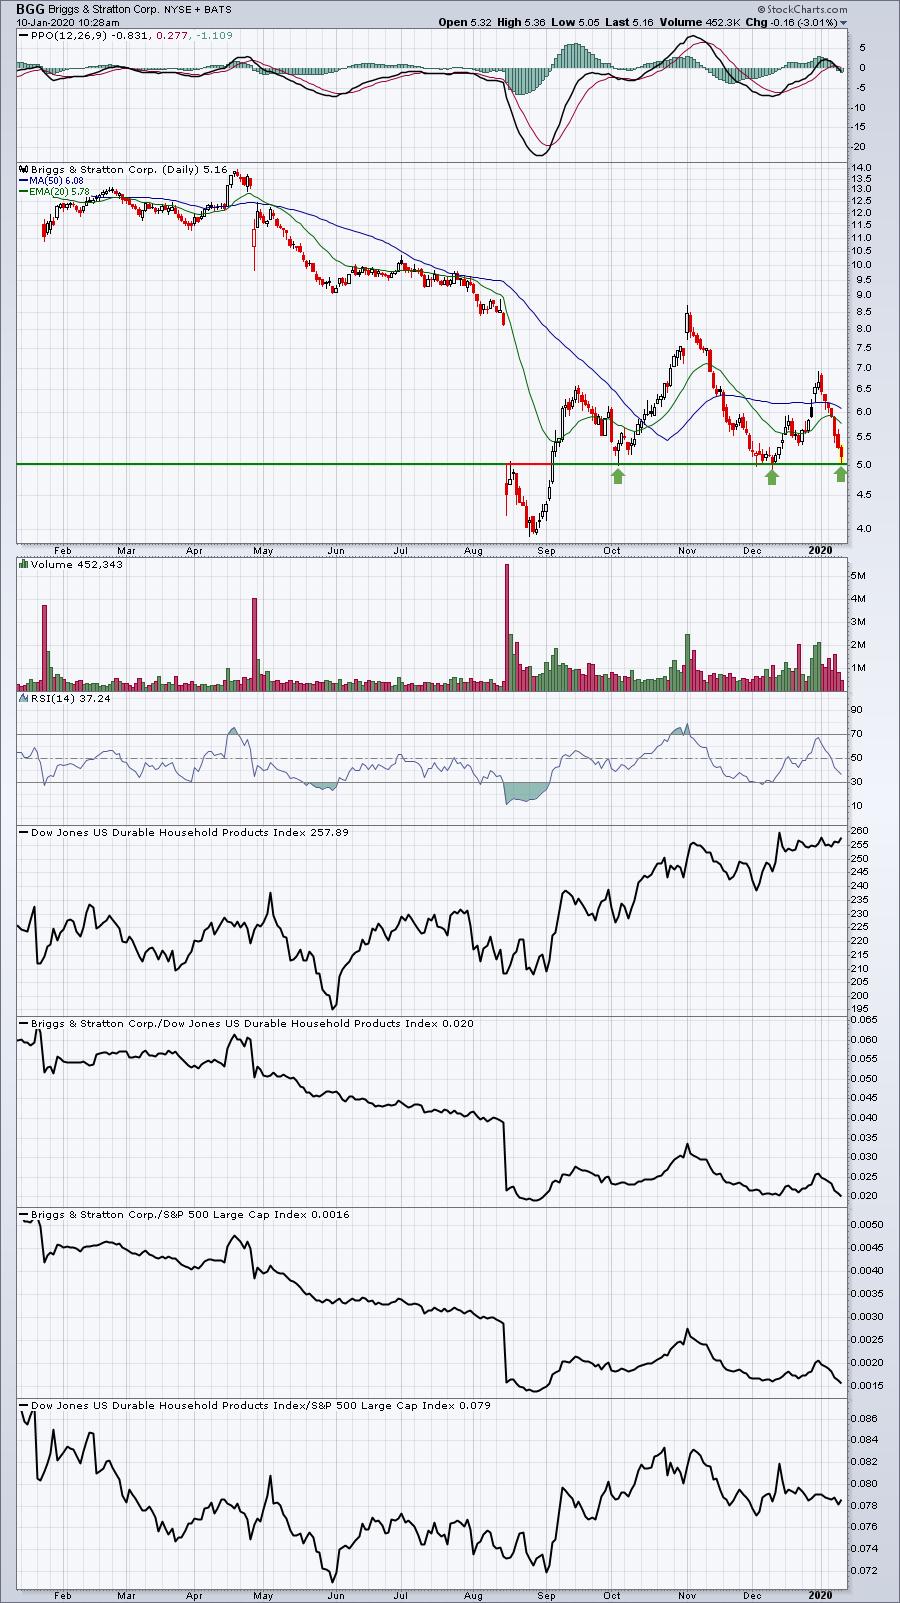
BGG had been trying to find a bottom, but it's returned to the 5.00 level for a third time. It once again needs to hold. A close below, especially on increasing volume, would suggest a test of the August low.
Movers & Shakers
Here are two stocks among the S&P 500 leaders today:
ISRG:
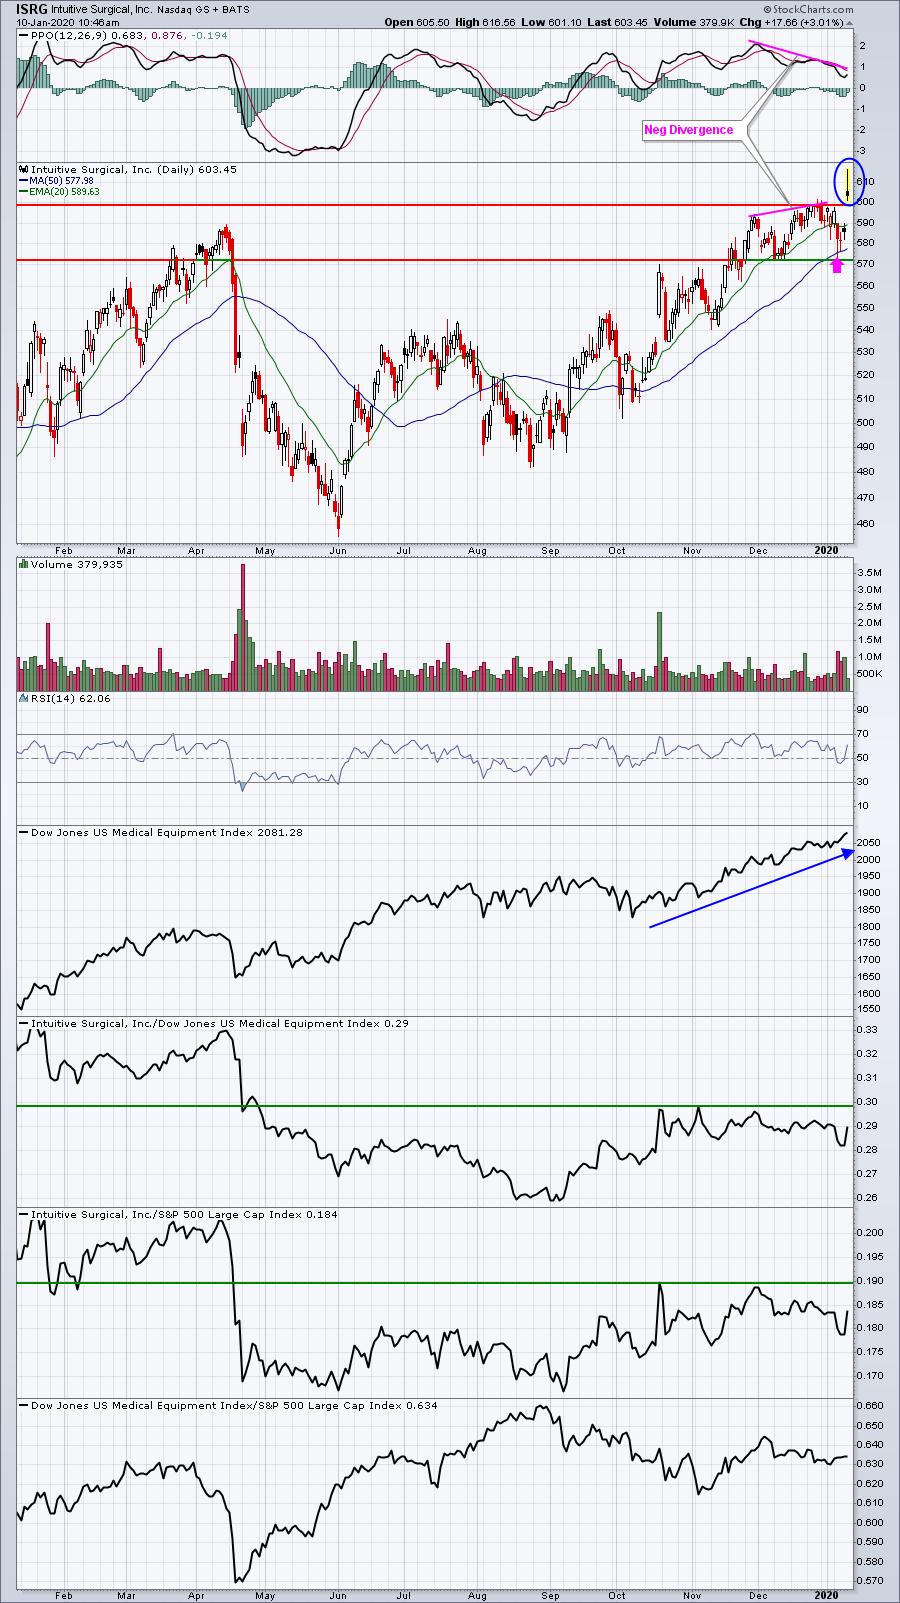
ISRG had momentum issues as highlighted by the negative divergence. It fell to test its 50 day SMA, which is what I look for after negative divergences print. Today, it's getting a breakout, but a strong finish would be more bullish than the alternative.
MNST:
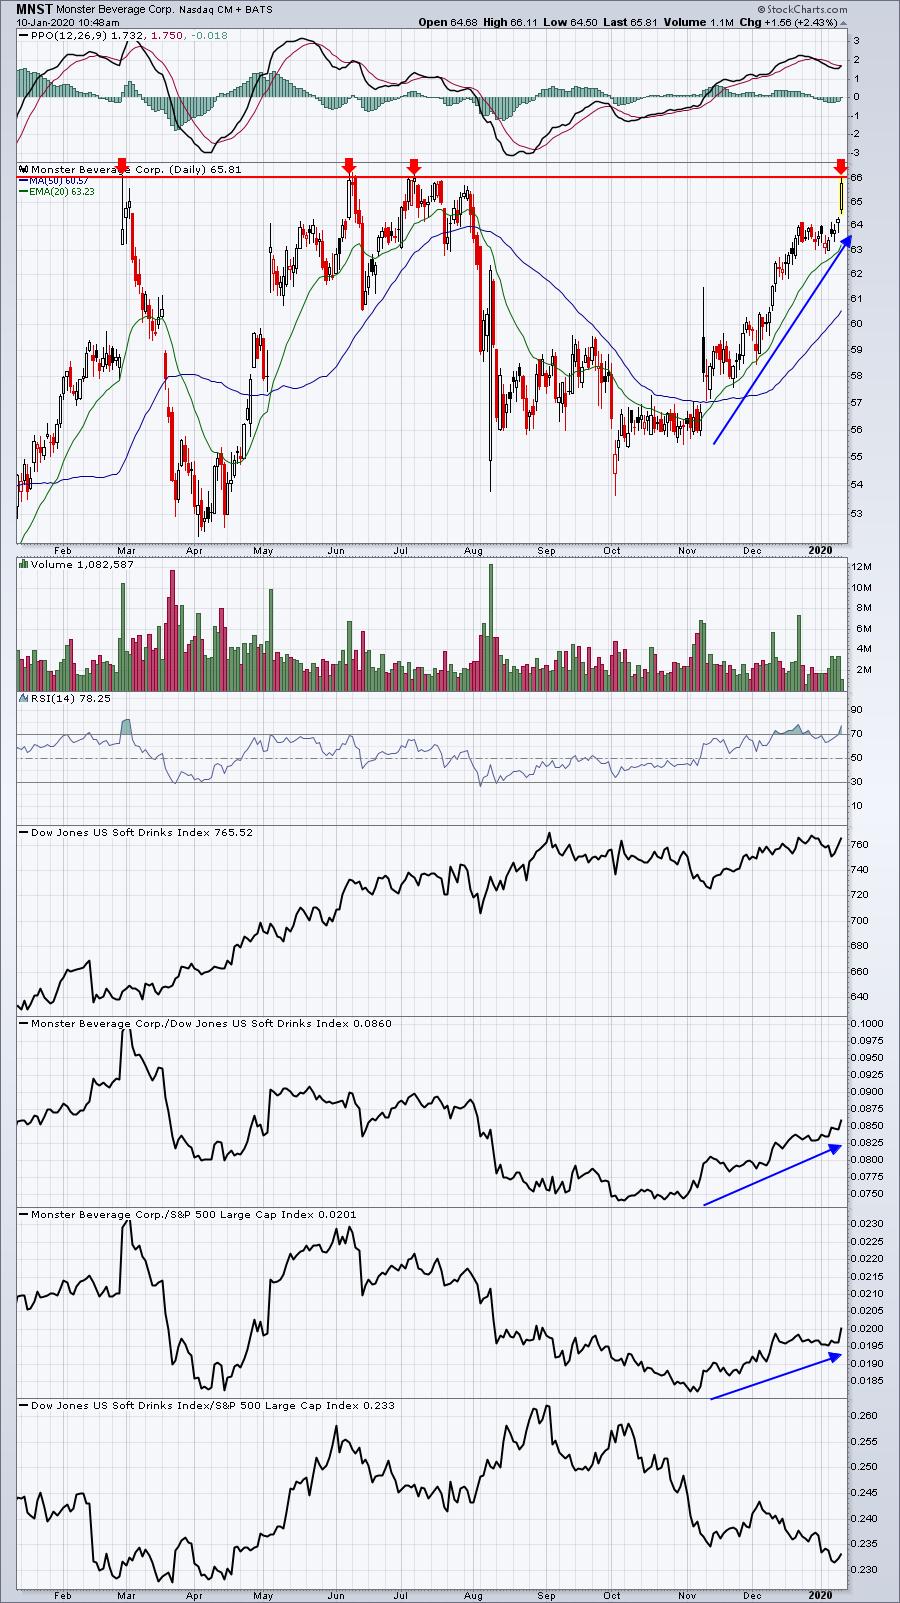
MNST has faced an uphill battle as the soft drink group ($DJUSSD) has been poor on a relative basis. Nonetheless, MNST has risen to test a very key overhead price resistance level. I like MNST on either a breakout or on a pullback to test its rising 20 day EMA.
Earnings Reports
Here are the key earnings reports for this week, featuring stocks with market caps of more than $5 billion. I also include a few select companies with market caps below $5 billion. Finally, any portfolio stocks (or active trade alerts) that will be reporting results are highlighted in BOLD. Please make sure you check for earnings dates for any companies you own or are considering owning:
Friday, January 10:
INFY
Monday, January 13:
SJR
Economic Reports
December nonfarm payrolls: 145,000 (actual) vs. 158,000 (estimate)
December private payrolls: 139,000 (actual) vs. 150,000 (estimate)
December unemployment rate: 3.5% (actual) vs. 3.5% (estimate)
December average hourly earnings: +0.1% (actual) vs. +0.3% (estimate)
November wholesale inventories: -0.1% (actual) vs. +0.0% (estimate)
Happy trading!
Tom