
EB Daily Market Report - Tuesday, January 14, 2020
Executive Market Summary
- December CPI was released this morning and both the headline number and the Core number came in below expectations; low inflation keeps the Fed at bay, good news overall for equities
- The Dow Jones is leading our major indices today, up 100 and back over 29000
- Financials (XLF) and industrials (XLI) are leading today despite a drop in the 10 year treasury yield ($TNX)
- Defensive sectors are lagging as real estate (XLRE) is under pressure once again
- Big banks came through with earnings reports today; JPM and C are both higher on strong results
- Our only active trade alert VC is up nicely today and attempting to clear its 20 day EMA
Special Event
I decided earlier today that it would be helpful to have an impromptu webinar tomorrow afternoon to discuss some short-term warning signals for U.S. equities. It will begin tomorrow at 4:30pm EST and probably last 30-45 minutes. It will be recorded for those who cannot make it.
Market Outlook
I'm very bullish. Anyone who's followed me at StockCharts.com or EarningsBeats.com knows how bullish I've been. I was bullish in the face of all the volatility in 2019 and I'm bullish now that we're in a stealth upside rally. But....
Sentiment is suggesting that we be careful in the very near-term (1-2 weeks). Before I show you the chart that concerns me, "caution" can mean different things to different traders/investors. For some, it might mean booking profits or partial profits and simply raising more cash in the event we see a quick bout of selling. For others, it could mean buying put insurance or selling calls against positions (premium farming). Those strategies will lessen the blow if we do see selling, but they'll also cut profits if this rally continues. Think of it as insurance.
So what's changing? Well, there's a combination of two sentiment readings that has me feeling a bit less bullish in the very near-term. Understand that sentiment signals work better for calling bottoms than calling tops, at least in my opinion they do. So please keep this in mind. I'm very bullish long-term, so those who don't care about short-term selling and are focused on where stocks are in a year, two years, or ten years likely shouldn't be bothered.
The Volatility Index ($VIX) is beginning to show positive correlation with the S&P 500, which is typically not a great thing. It means that traders are growing more nervous as prices rise. Typically, the exact opposite occurs - the VIX falls as equity prices rise. That's one problem. The other problem is that the 5 day moving average of the Equity Only Put Call ratio ($CPCE) has moved below .50 for the first time since mid-2014. Everyone is jumping on board and buying calls now. The CPCE is a contrarian indicator. When everyone decides it's time to buy, we should be thinking about selling.
Here's the chart to illustrate:
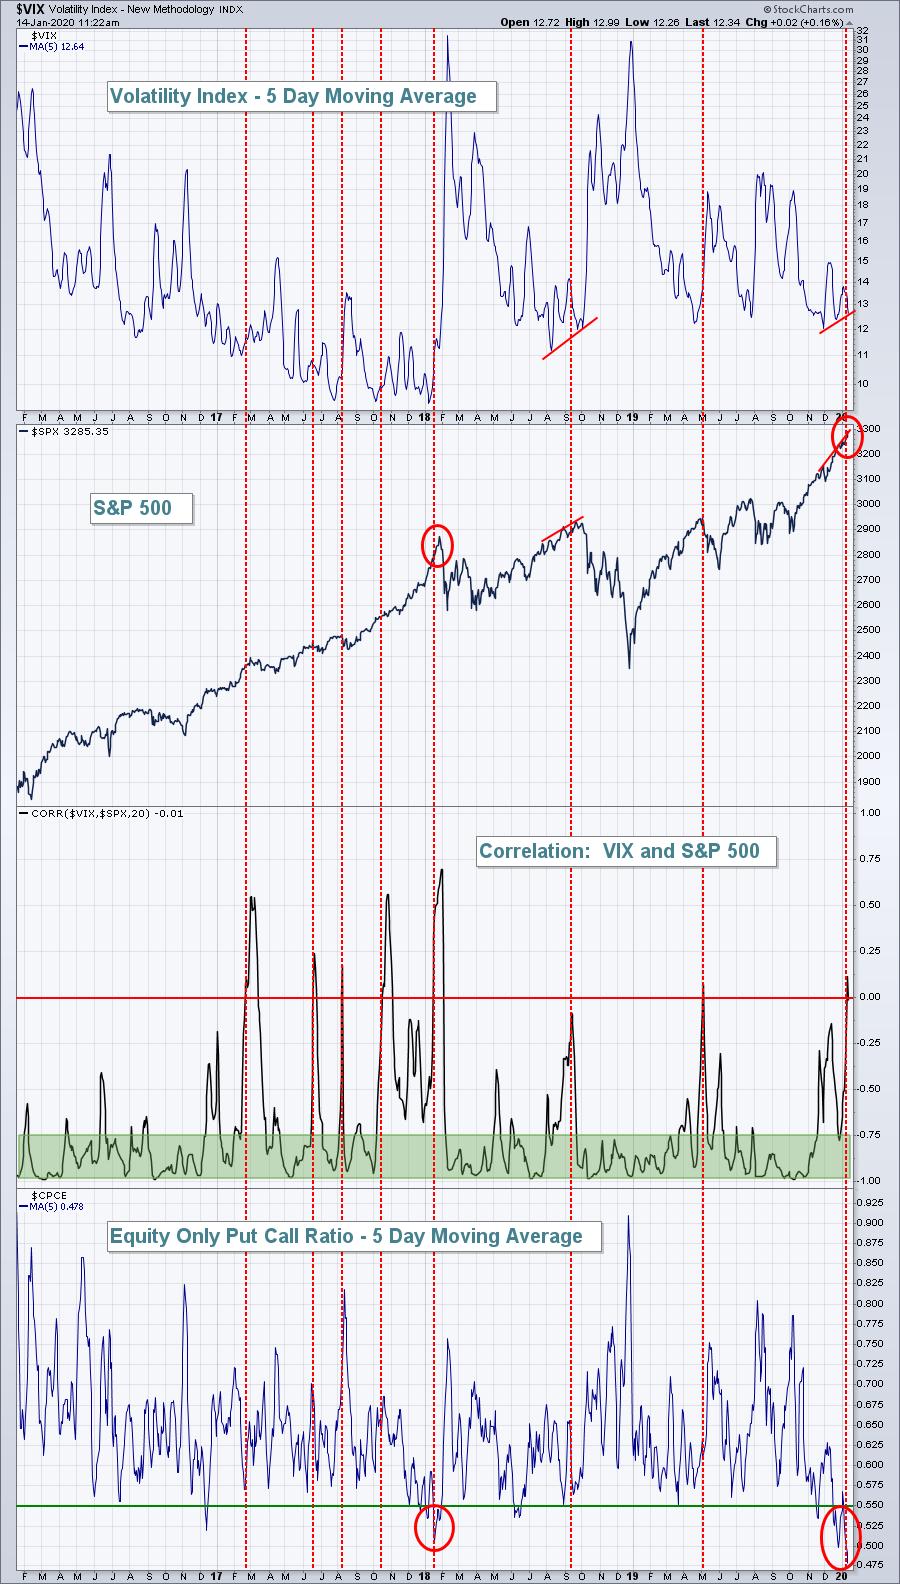
The last time the CPCE was this low, we had a significant top in the market. I don't expect this to be a major top, but it could be a short- to intermediate-term top.
As a result of this development, I've decided to have an impromptu webinar (for EarningsBeats.com members only) tomorrow afternoon at 4:30pm EST, just after the market closes.
Sector/Industry Focus
Banks ($DJUSBK) are rallying off of a short-term price support test after a few big banks reported quarterly results. JP Morgan Chase (JPM) and Citigroup (C) both beat revenue and EPS estimates, while Wells Fargo (WFC), as usual, missed its estimates. Nonetheless, the overall group is having a solid day:
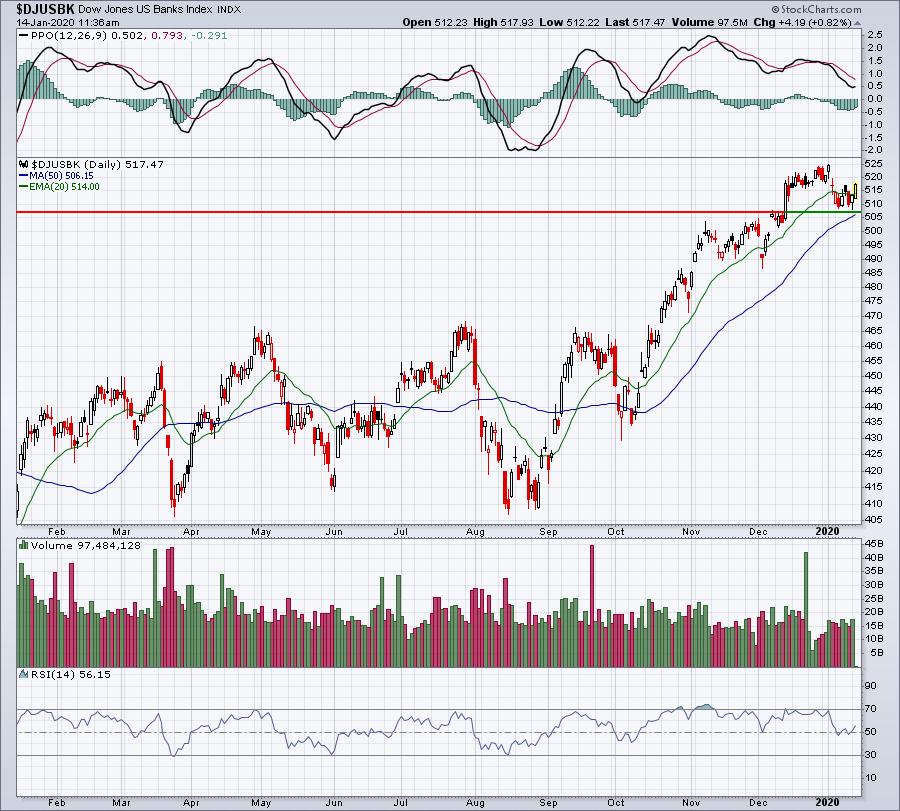
The group looks very solid and will likely set new highs throughout much of 2020, but they're not immune to short-term selling. If we don't get a breakout this week with many large banks reporting solid results, we may need a period of consolidation to force out weak hands before another leg up materializes.
Active Trade Alerts
We have just one active alert right now:
VC (+1.27%) - reports earnings on February 19. VC gapped higher this morning and is currently trading back near its 20 day EMA. Closing above the 20 day EMA and staying there is #1 on our wish list.
Strong Earnings ChartList (SECL)
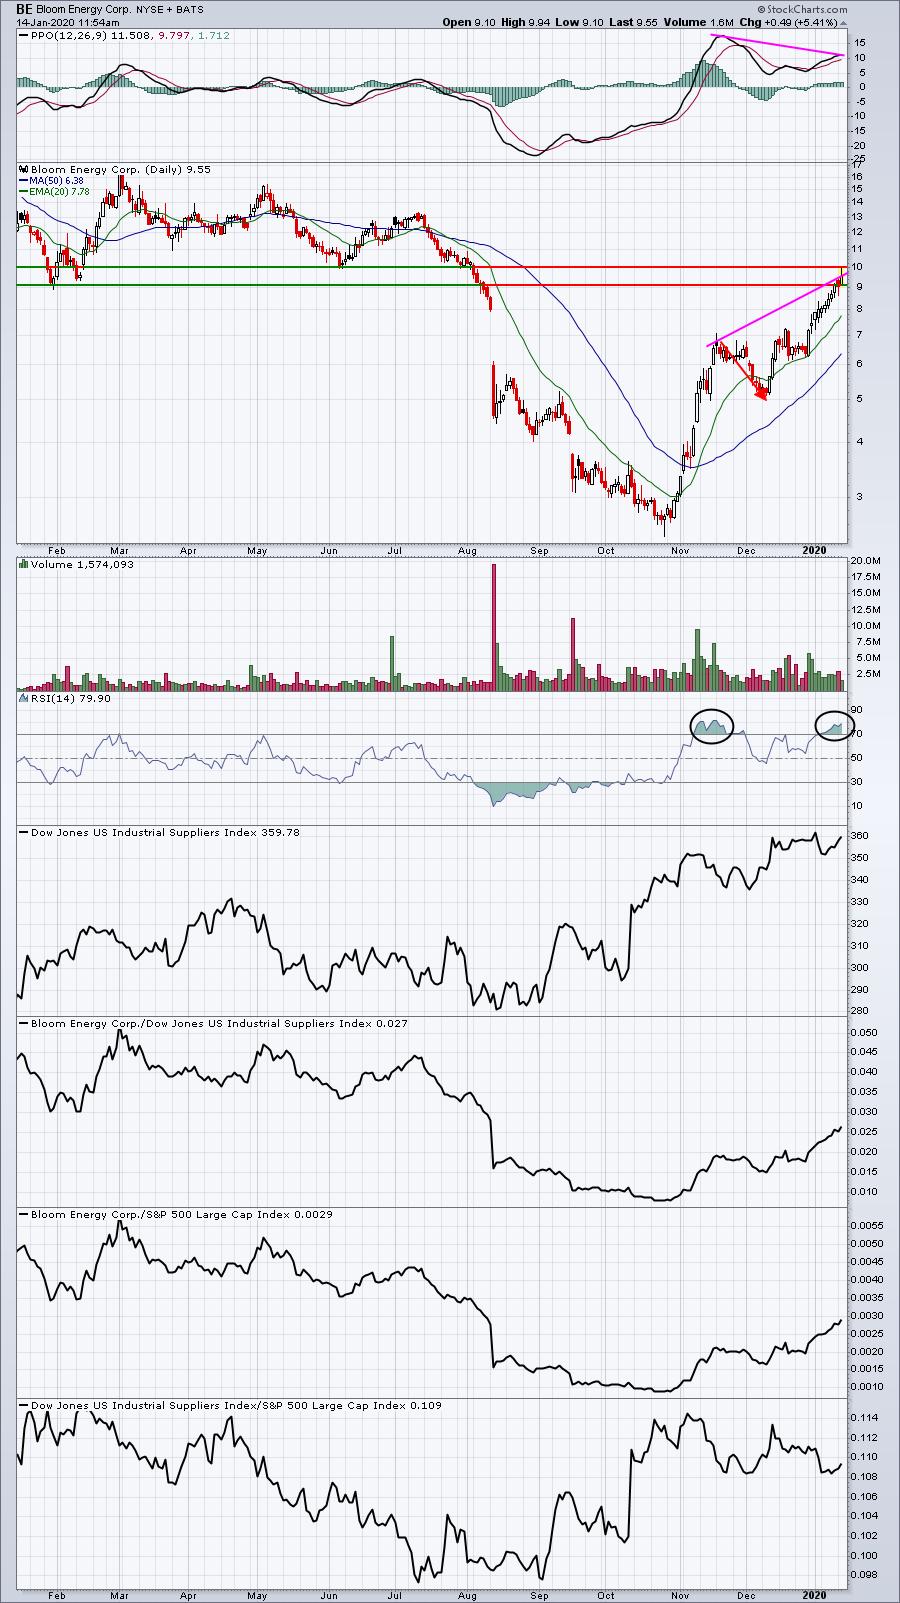
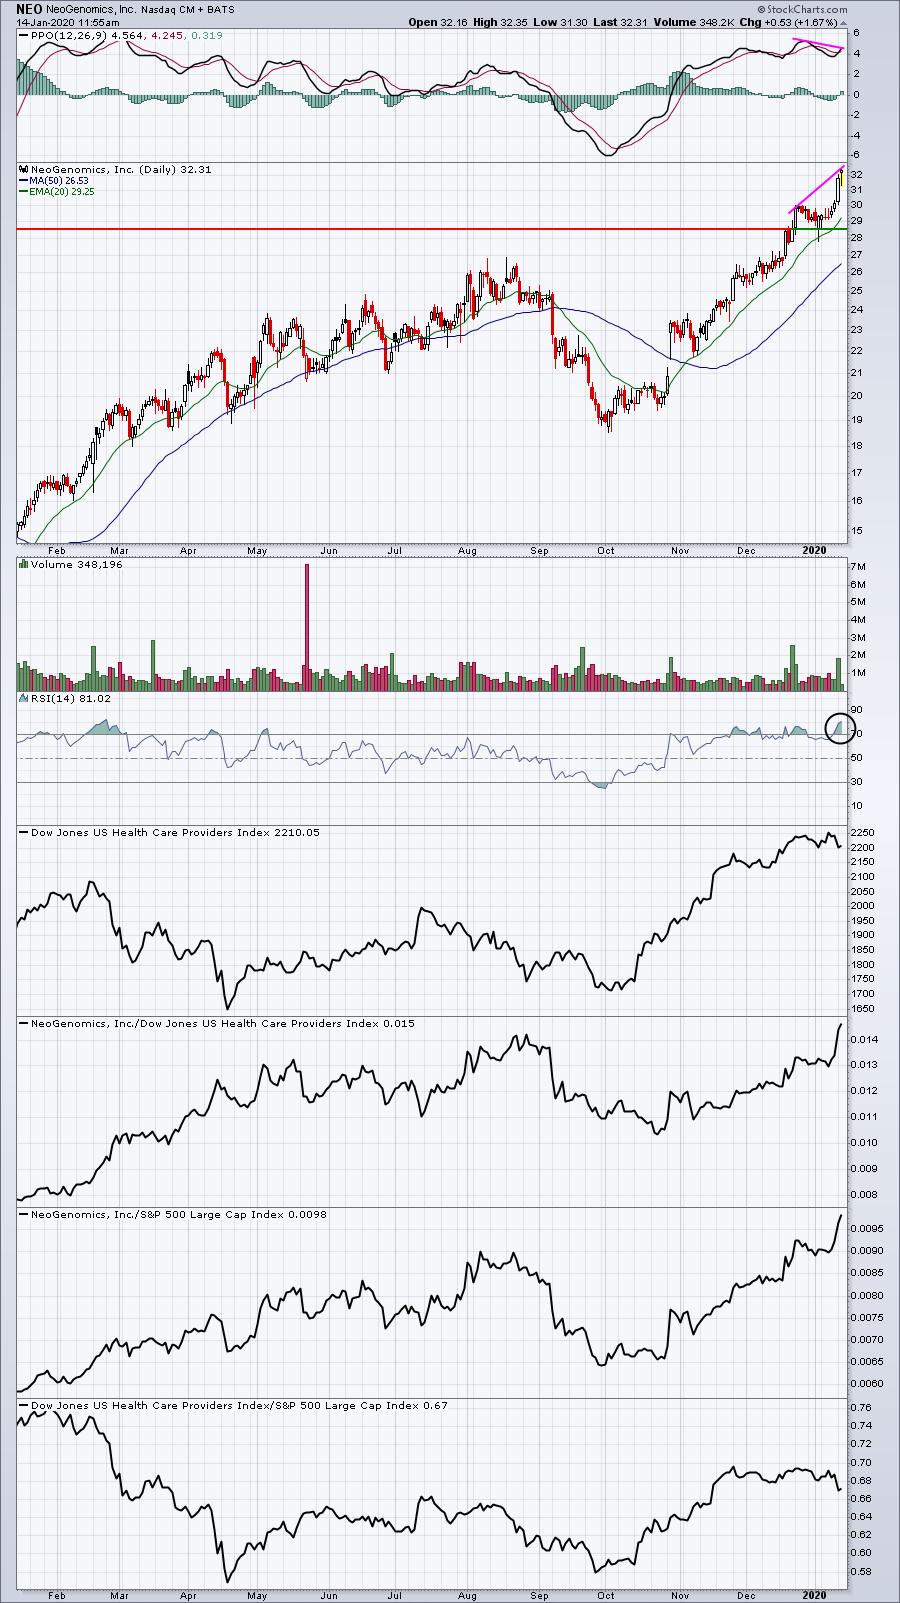
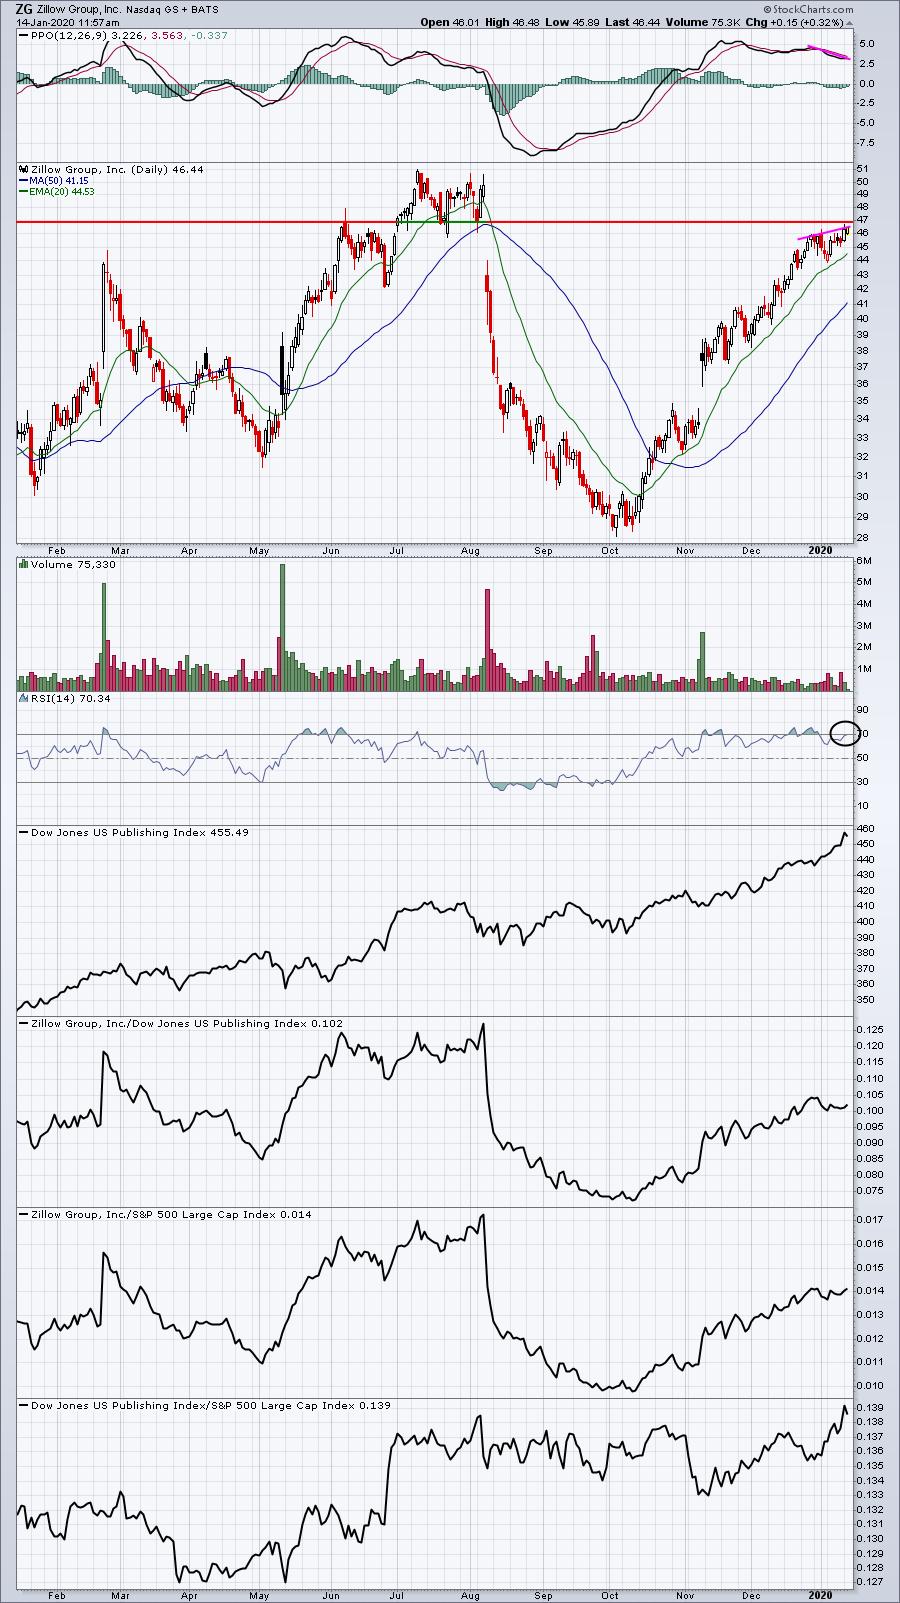
Given the cautious tone of today's DMR, I think it might be helpful to review stocks on the SECL that might be most prone to quick selling and profit taking. The biggest concerns would be those stocks that are overbought by just about any measure and particularly those showing negative divergences (higher recent price action with a lower PPO reading). Here are a few names:
BE:
NEO:
ZG:
SWKS:
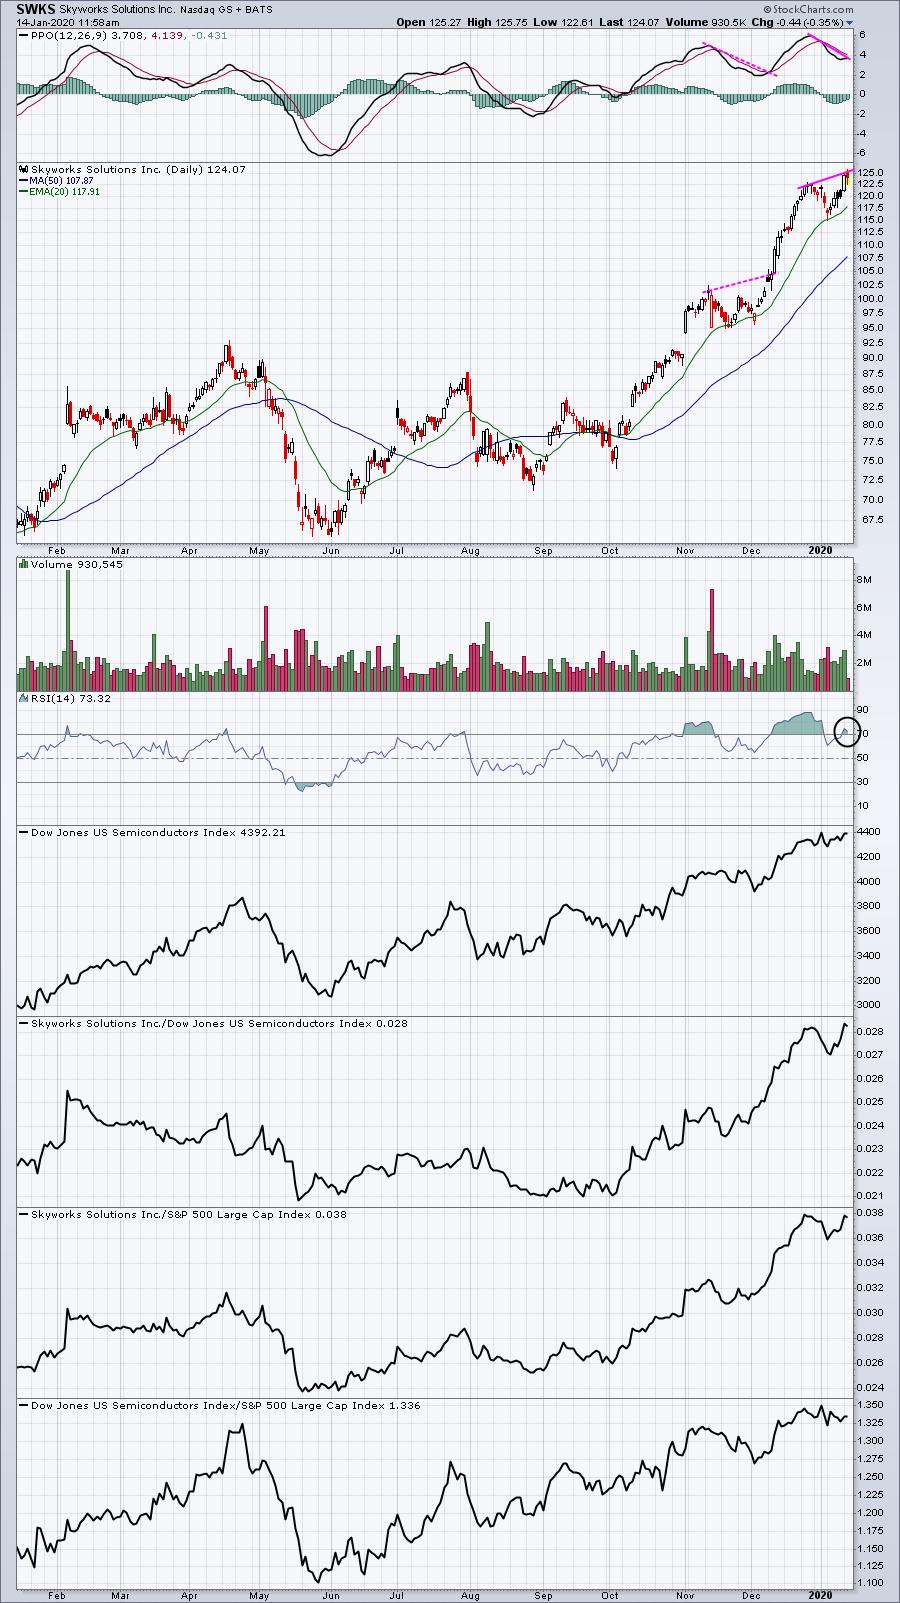
Let me be clear. These are strong charts. What I'm considering is a short-term pullback. In the case of SWKS, you can see a prior negative divergence (pink-dotted line) and overbought conditions didn't work. Heavy volume buying can negate the suggestion of slowing price momentum. It may very well do it again. One thing I'd look for when a stock becomes overbought and a negative divergence prints is a reversing candlestick. Bearish engulfing and shooting star candles are two of my favorite candles with other bearish technical conditions in place.
Movers & Shakers
I'm going to pass on looking for potential trade candidates today as the market appears to be a bit frothy. I definitely do not short a secular bull market, but I'd tend to use the strength right now to build a bit more cash and be better able to weather a short-term selling storm.
Earnings Reports
Here are the key earnings reports for this week, featuring stocks with market caps of more than $10 billion. I also include a few select companies with market caps below $10 billion. Finally, any portfolio stocks (or active trade alerts) that will be reporting results are highlighted in BOLD. Please make sure you check for earnings dates for any companies you own or are considering owning:
Tuesday, January 14:
JPM, WFC, C, DAL, INFO, WIT, FRC
Wednesday, January 15:
BAC, UNH, USB, GS, BLK, PNC, SCHW, KMI
Thursday, January 16:
TSM, MS, CSX, BK, PPG. Others less than $10 bil: OZK, PRGS
Friday, January 17:
HDB, SLB, STT, FAST, CFG, RF, KSU, JBHT
Economic Reports
December CPI: +0.2% (actual) vs. +0.3% (estimate)
December Core CPI: +0.1% (actual) vs. +0.2% (estimate)
Happy trading!
Tom