
EB Daily Market Report - Thursday, January 16, 2020
Executive Market Summary
- A number of economic reports were released, most of them supporting the recent advance in equities
- Solid retail sales were reported, along with lower-than-expected initial jobless claims
- The 10 year treasury yield ($TNX) is up 3 basis points to 1.82%
- Energy (XLE) and technology (XLK) are the leading sectors, while materials (XLB) lag on a relative basis
- All 11 sectors are higher today
- Morgan Stanley (MS, +7.13%) delivered blowout quarterly results, leading investment services ($DJUSSB) higher
- Our only active trade alert VC is up nicely today, remaining above its 20 day EMA - a bullish sign
Market Outlook
Ok, we have a few different story lines right now. There's a very bullish undertone taking place as transportation stocks ($TRAN), small cap stocks ($SML) and mid cap stocks ($MID) are all breaking out. These are the groups to focus on near-term as they're not subject to many of the warning signs that I discussed in last night's webinar. When transportation stocks ($TRAN) rise, ALWAYS take notice. Here's a chart illustrating what's going on:
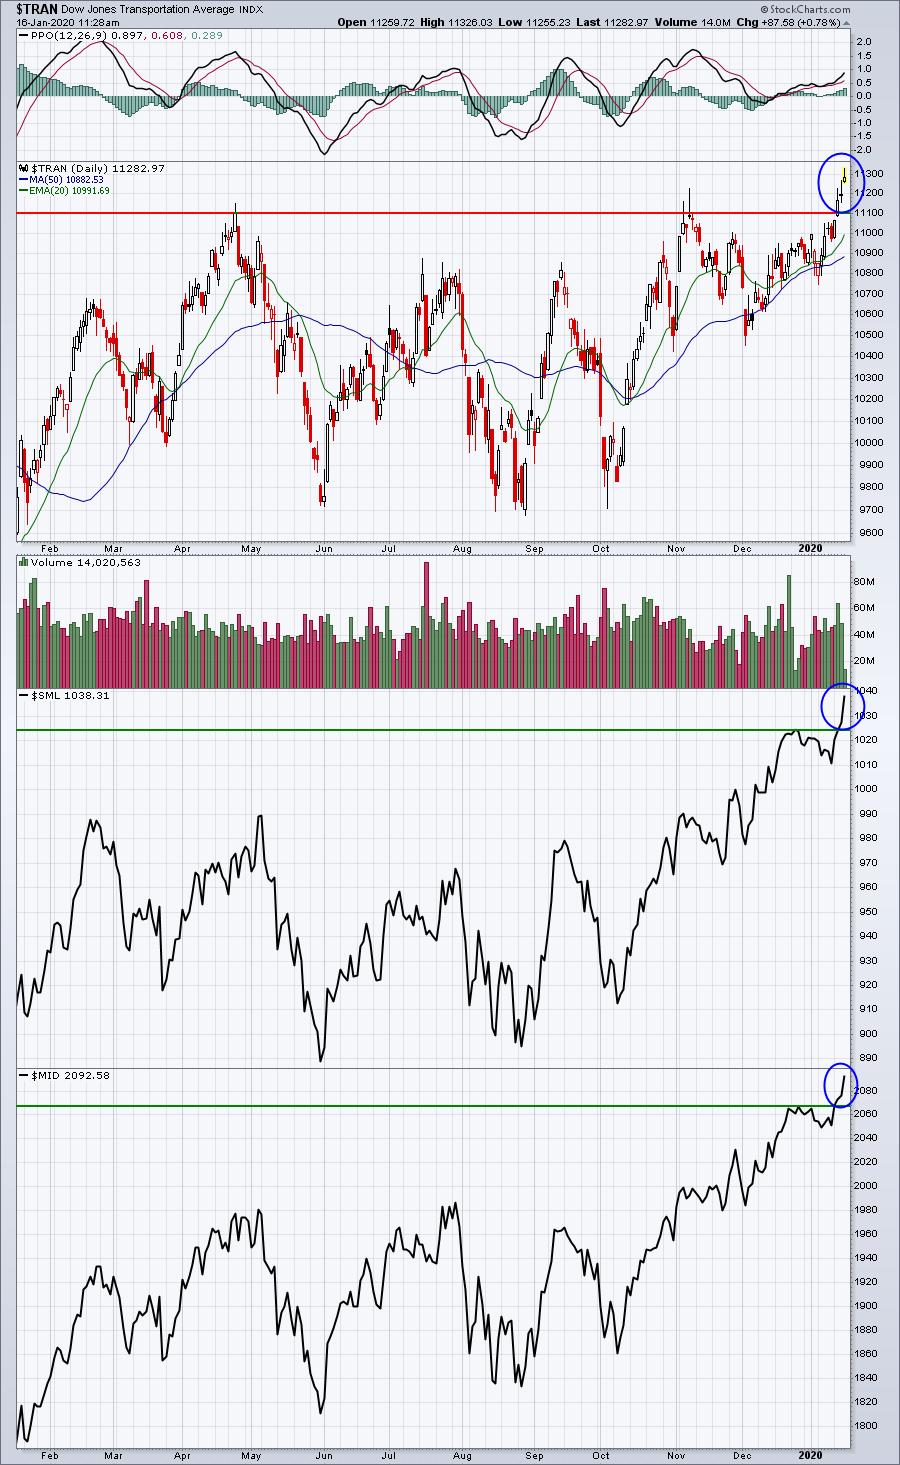
Weeks ago I discussed how important it is to see leadership from transportation stocks and small caps and now we're seeing that confirmation. HUGE moves higher in the S&P 500 occur when led by these areas of the market. This doesn't trump all of the short-term warning signs that have been discussed. Rather, they reinforce the fact that these warning signs are SHORT-TERM. If you're a long-term investor/trader, these recent developments are SCREAMING to hold onto your positions.
Sector/Industry Focus
Truckers ($DJUSTK) have truly caught fire and that's a great economic signal. They're breaking to a new 52 week high today and challenging their all-time high:
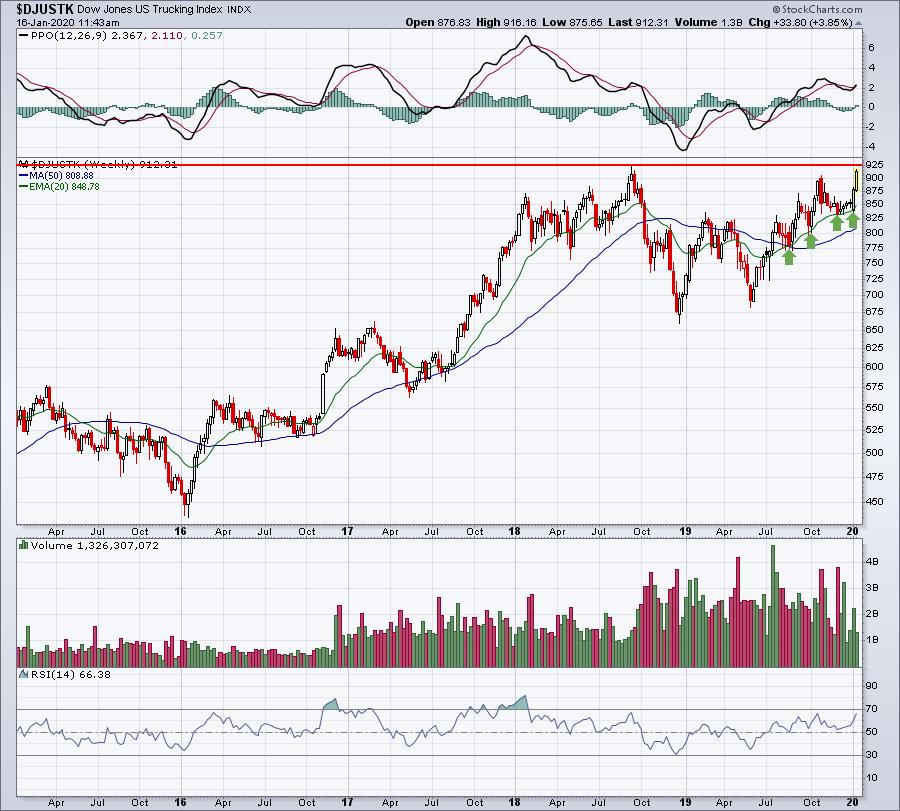
Note all the successful 20 week EMA tests. That's indicative of the start of potentially a lengthy uptrend.
Active Trade Alerts
We have just one active alert right now:
VC (+2.16%) - reports earnings on February 19. VC is climbing again today and is back above its 20 day EMA after losing it temporarily on Wednesday. We want to see VC bounce off 20 day EMA tests. Otherwise, it's an indication that we remain mired in the same sideways consolidation pattern.
Strong Earnings ChartList (SECL)
As noted above, small caps and mid caps haven't performed nearly as strongly as large caps heading into options expiration tomorrow, so I'm going to focus my search for SECL trading candidates among the best stocks within these two asset classes.
Here are the highest SCTR scores among small cap stocks on the SECL:
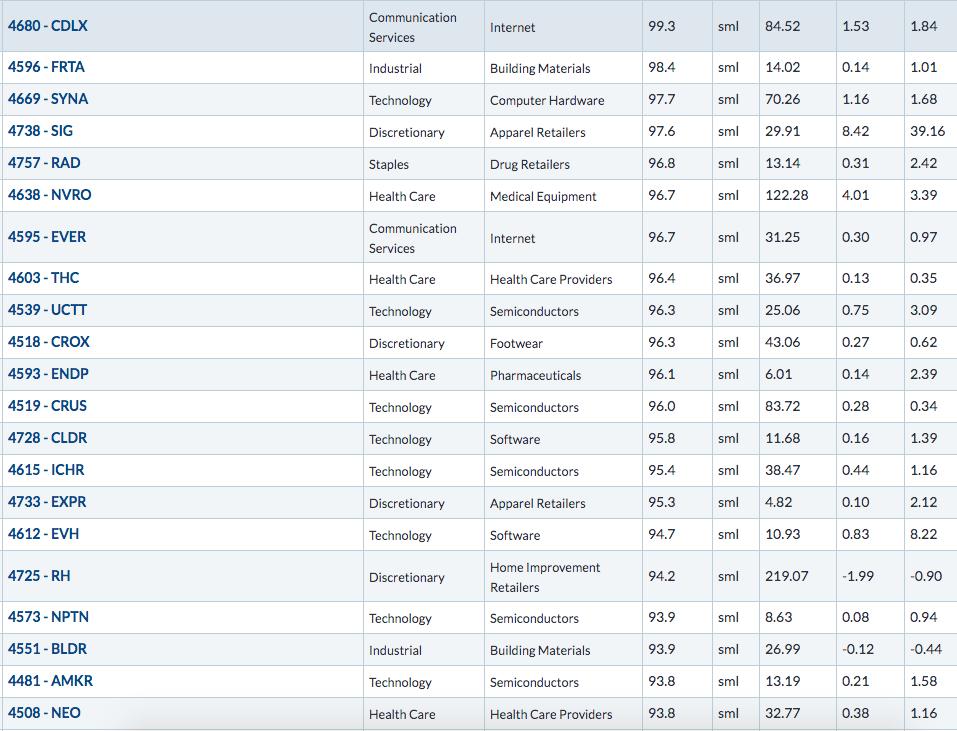
The far right column is today's percentage gain (loss). Here are a couple stocks worth noting:
SIG:
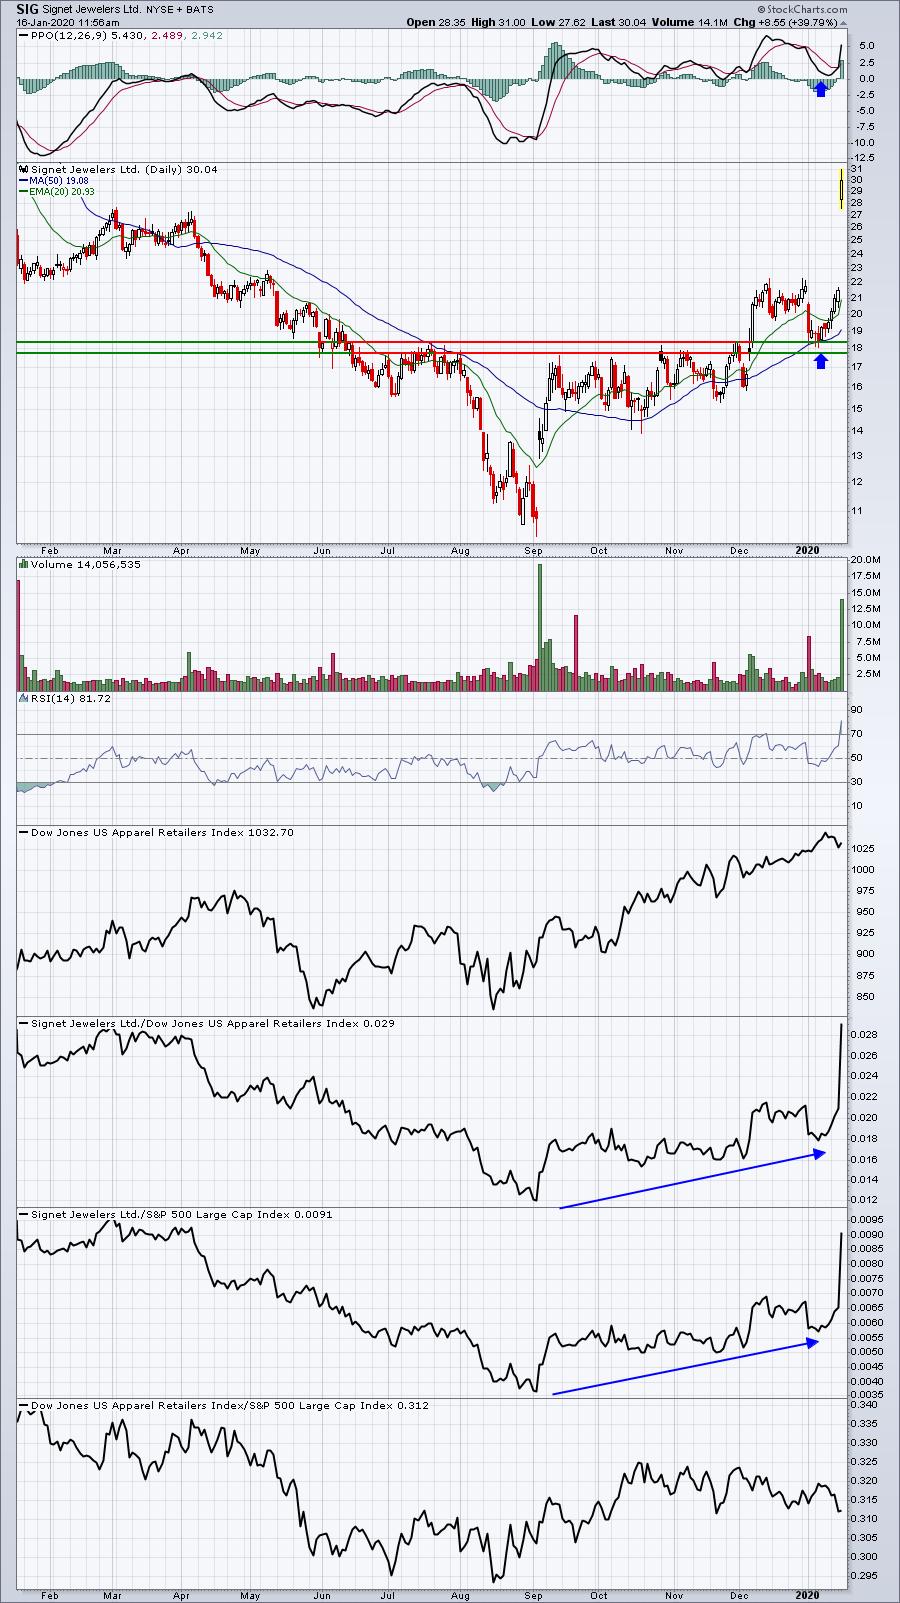
Here's the chart that was included in the January 8th DMR. SIG had fallen back to test key price support. While they don't always work out, you can see that the winners far outpace the losers if you're disciplined about keeping tight stops in beneath price support levels.
RAD:
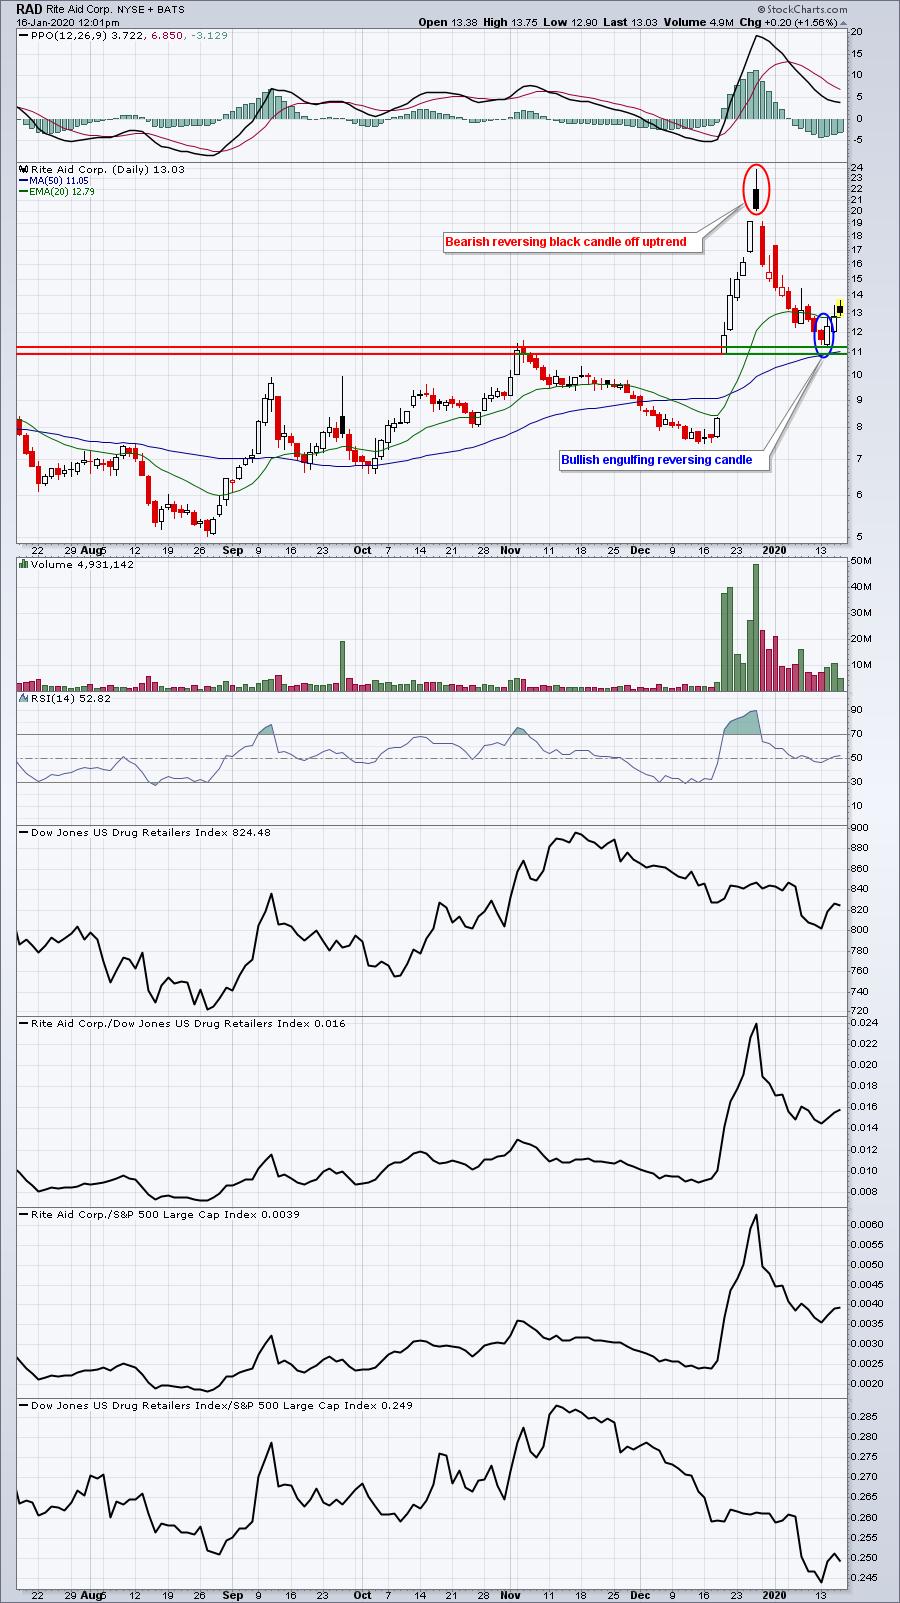
Reversing candles are powerful signals for short-term traders. The top and bottom were both called perfectly if you follow candlesticks.
Next up is the SECL, sorted by highest ranked SCTRs among mid caps:
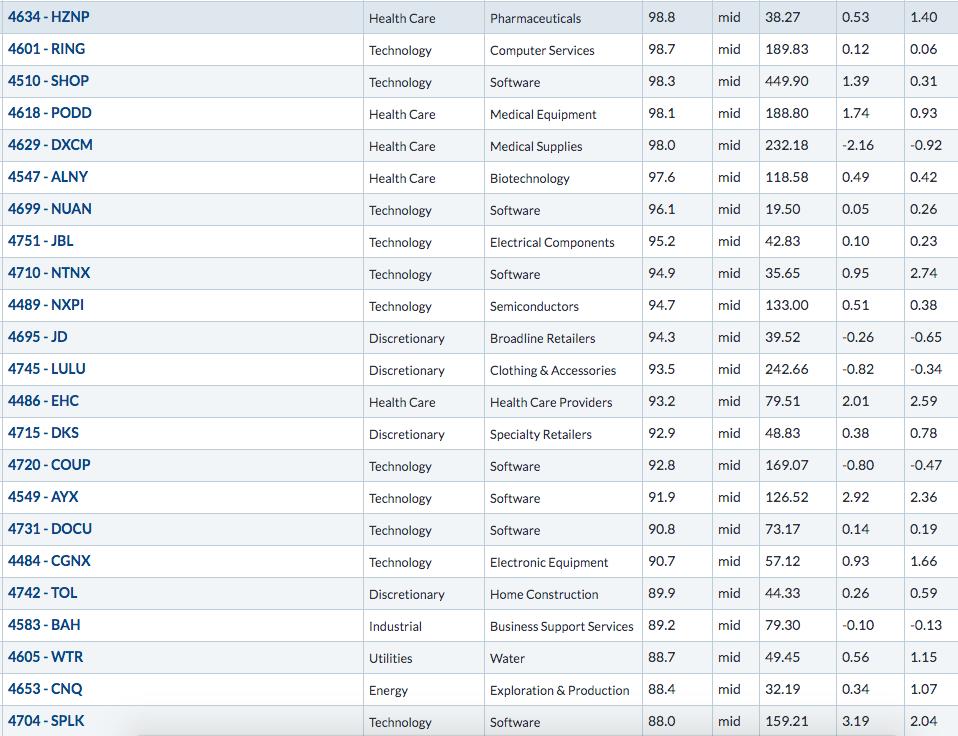
Here are two more interesting charts from this area of the market:
JBL:
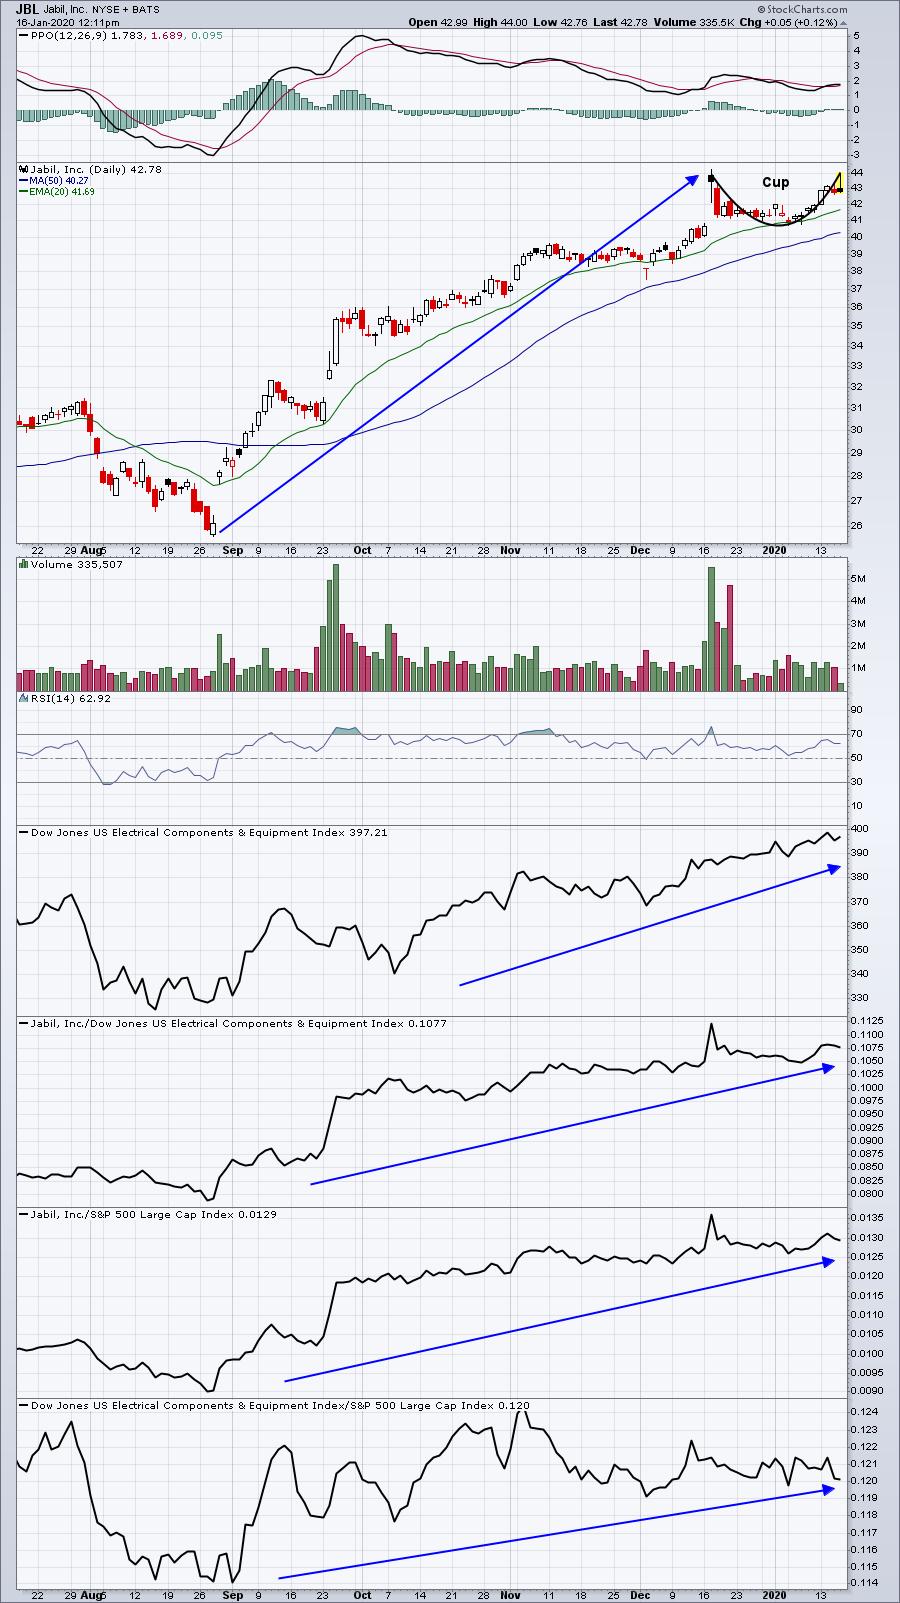
JBL just hit the right side of a cup and backed off, likely forming a handle down to perhaps its 20 day EMA. It's a leader in its industry and is likely to break out and reach its initial measurement of 47.00-47.25.
CGNX:
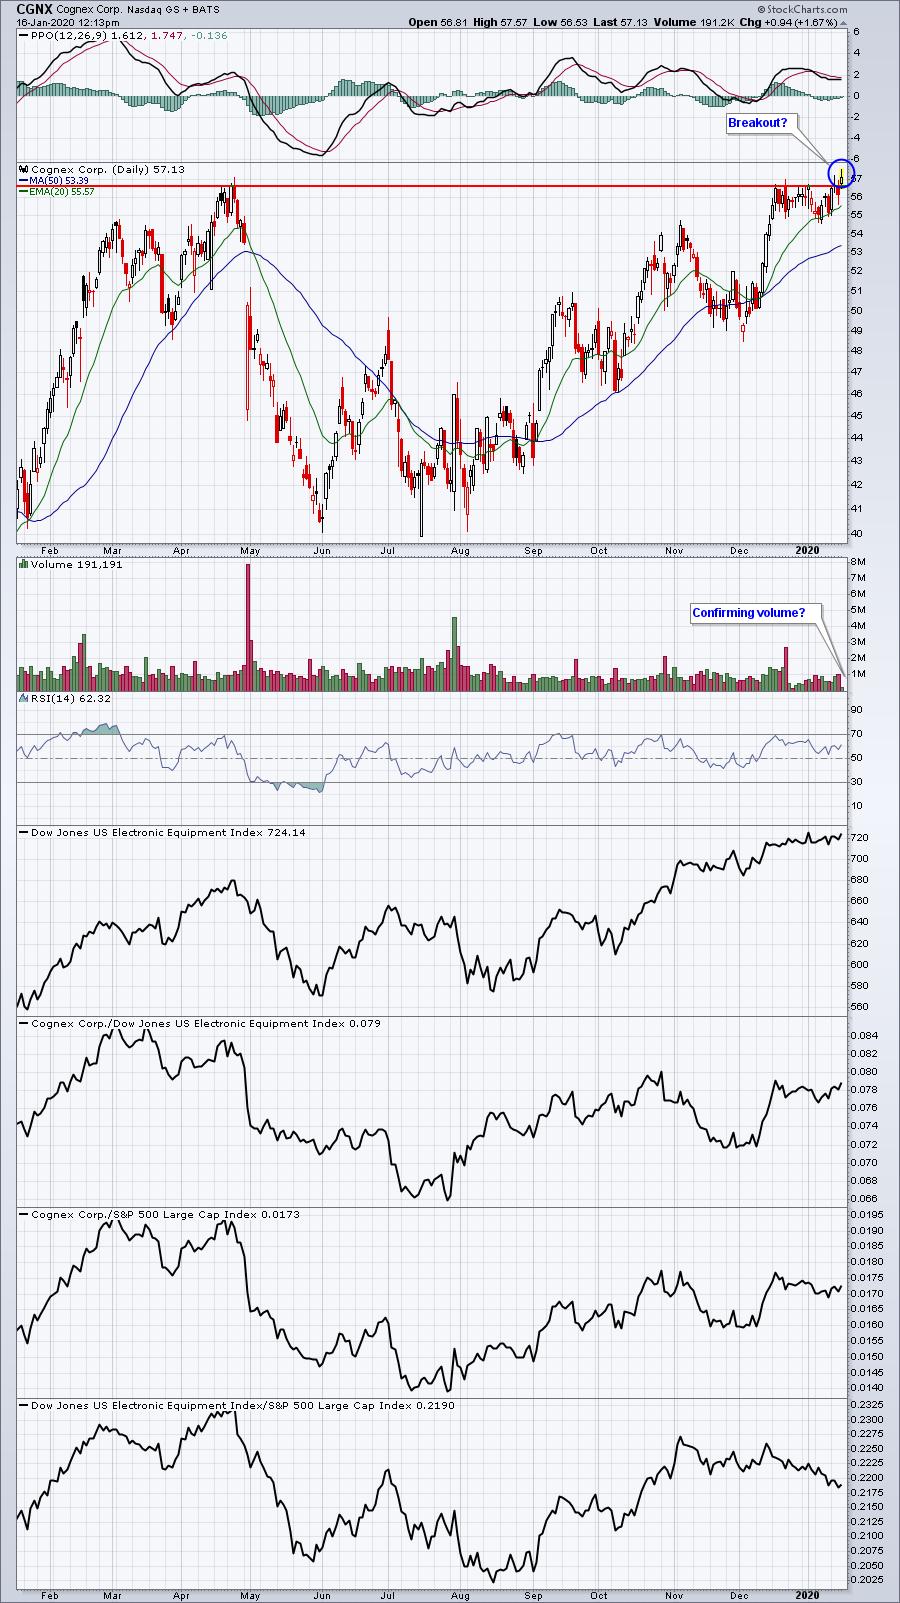
CGNX looks nice in terms of price action, attempting to clear a major price resistance hurdle. But check out the volume. There doesn't seem to be much support from Wall Street, which always makes me nervous. Not all breakouts are created equal and this one I'd avoid unless we see a lot more volume coming in this afternoon.
Movers & Shakers
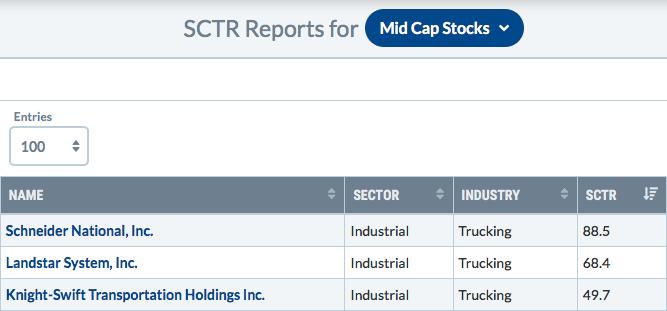
Since I'm focusing today on small caps, mid caps, and transports, why not look at SCTRs for small and mid caps, then search for truckers among them?
Mid cap truckers:
Small cap truckers:
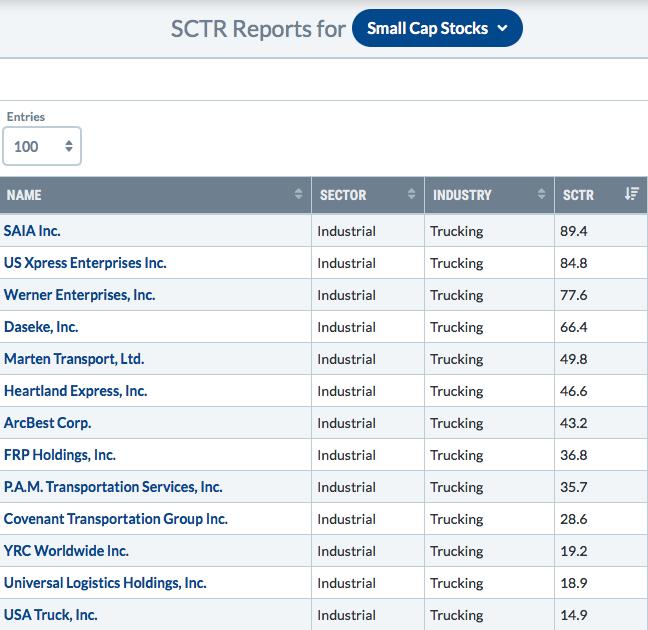
I looked at these 16 trucking stocks' charts, searching for potential high reward, low risk trades. Here is what I'd consider:
SNDR:
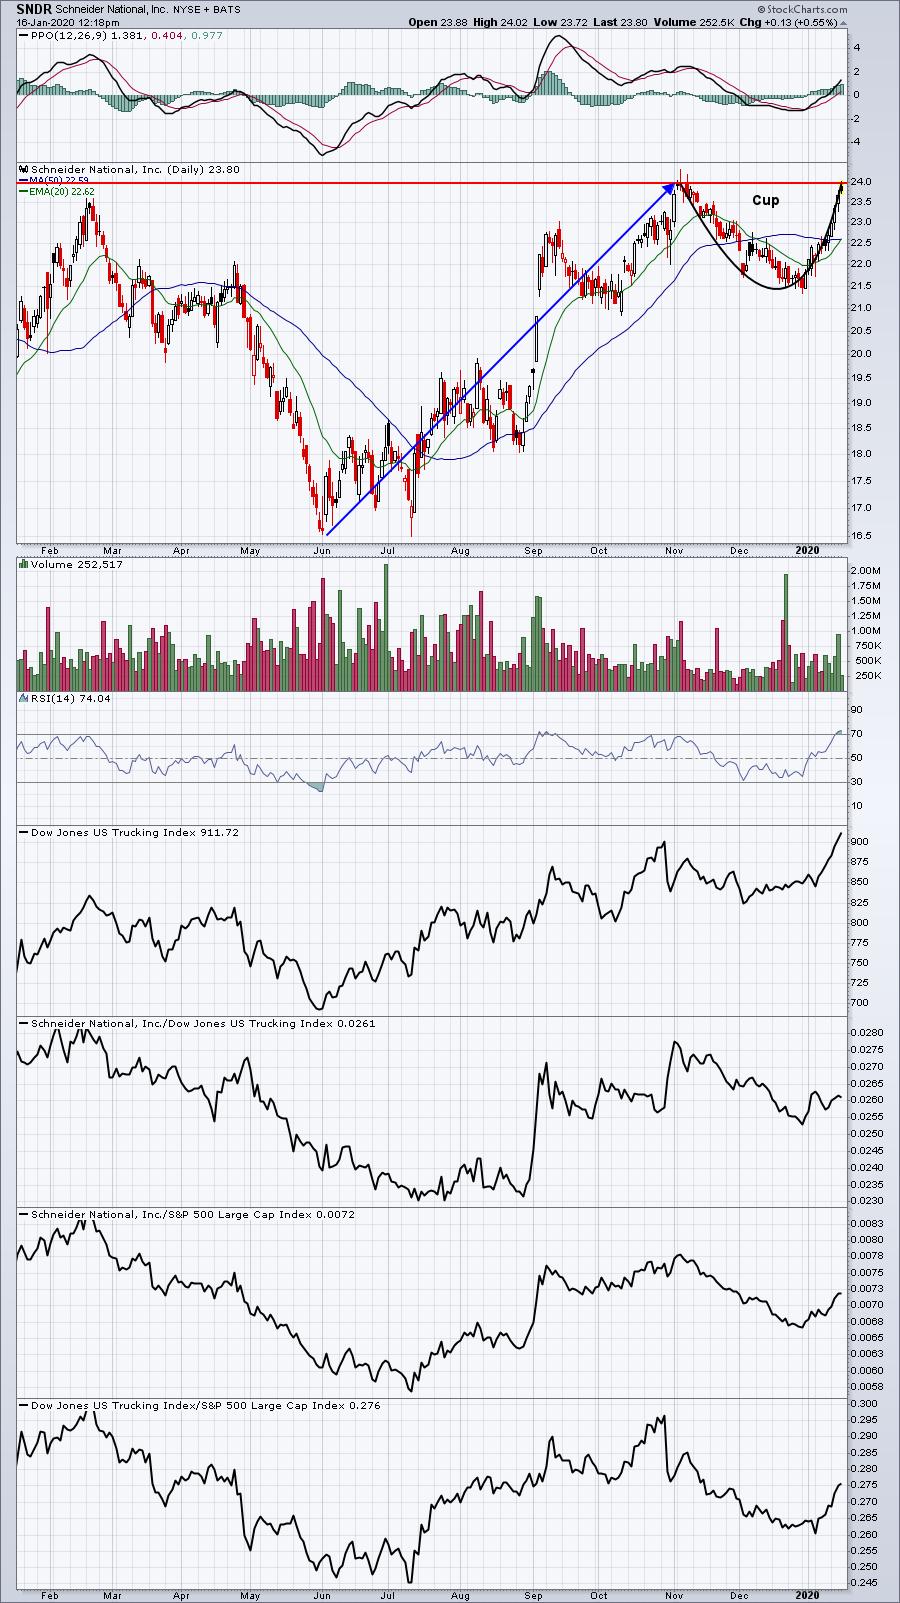
This is an extremely bullish pattern as a cup has formed after a lengthy uptrend. A pullback from here to reach or approach the now-rising 20 day EMA is what I'd look for.
KNX:
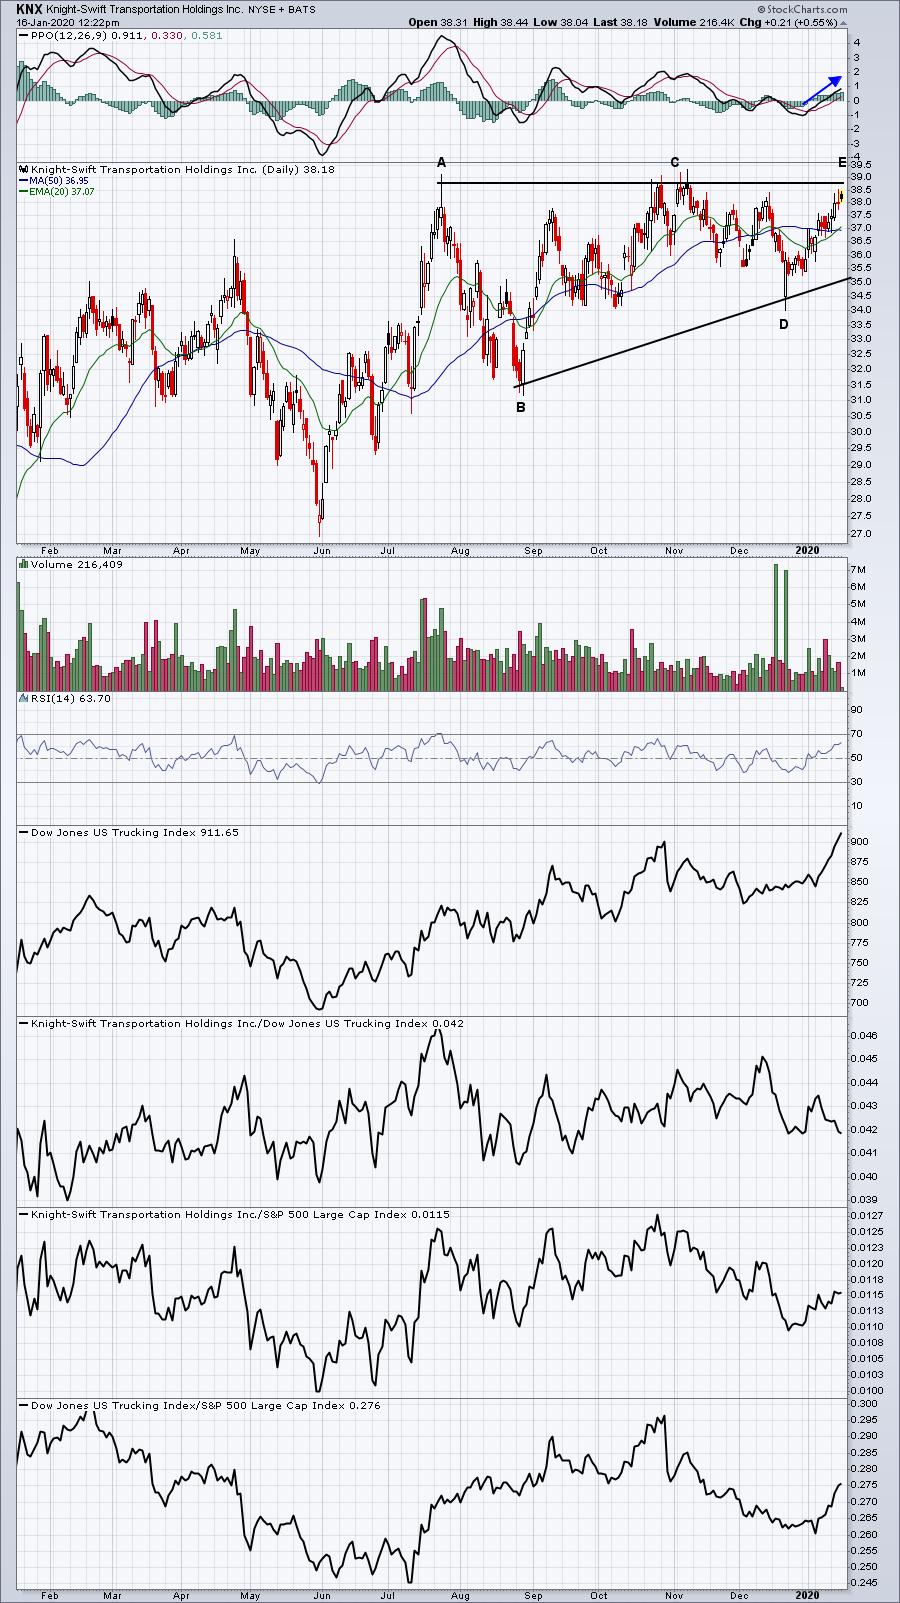
KNX is set up beautifully in an A-B-C-D-E ascending triangle with point E representing a breakout. That's the only thing missing. If it occurs on heavier-than-normal volume, the measurement of the pattern would be to 46.50 initially.
SAIA:
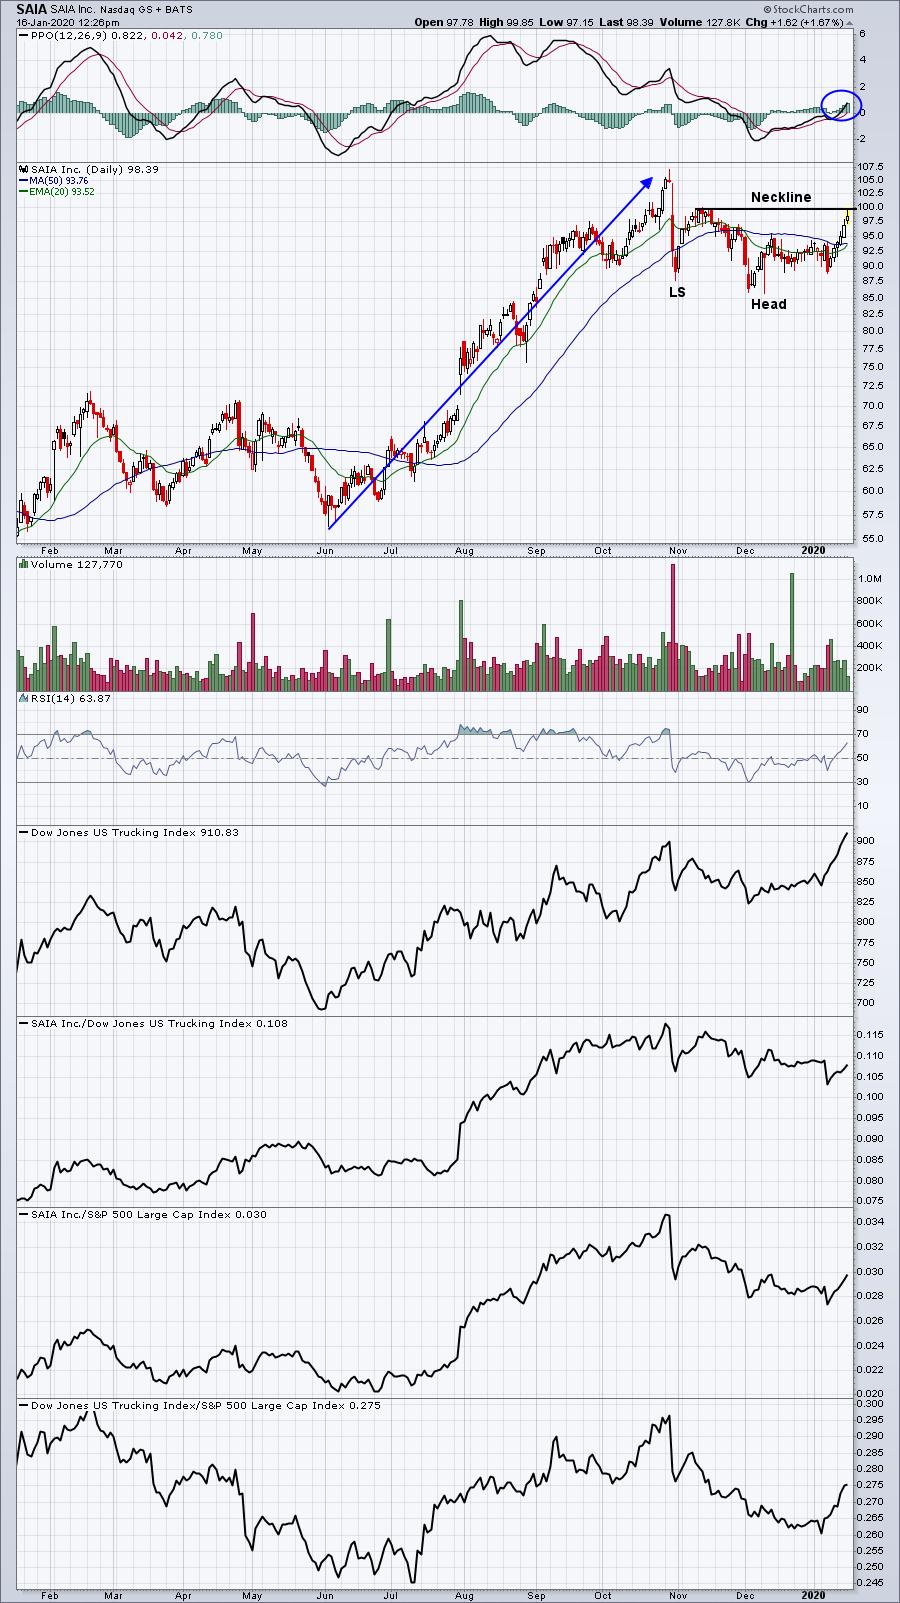
SAIA nearly doubled in 5-6 months, but has recently pulled back in what appears to be a very bullish inverse head & shoulders continuation pattern. If a right inverse shoulder were to reach the 20 day EMA/50 day SMA, it'd likely be a great reward to risk entry point. A confirmed breakout above 100 would initially measure to 114.
USX:
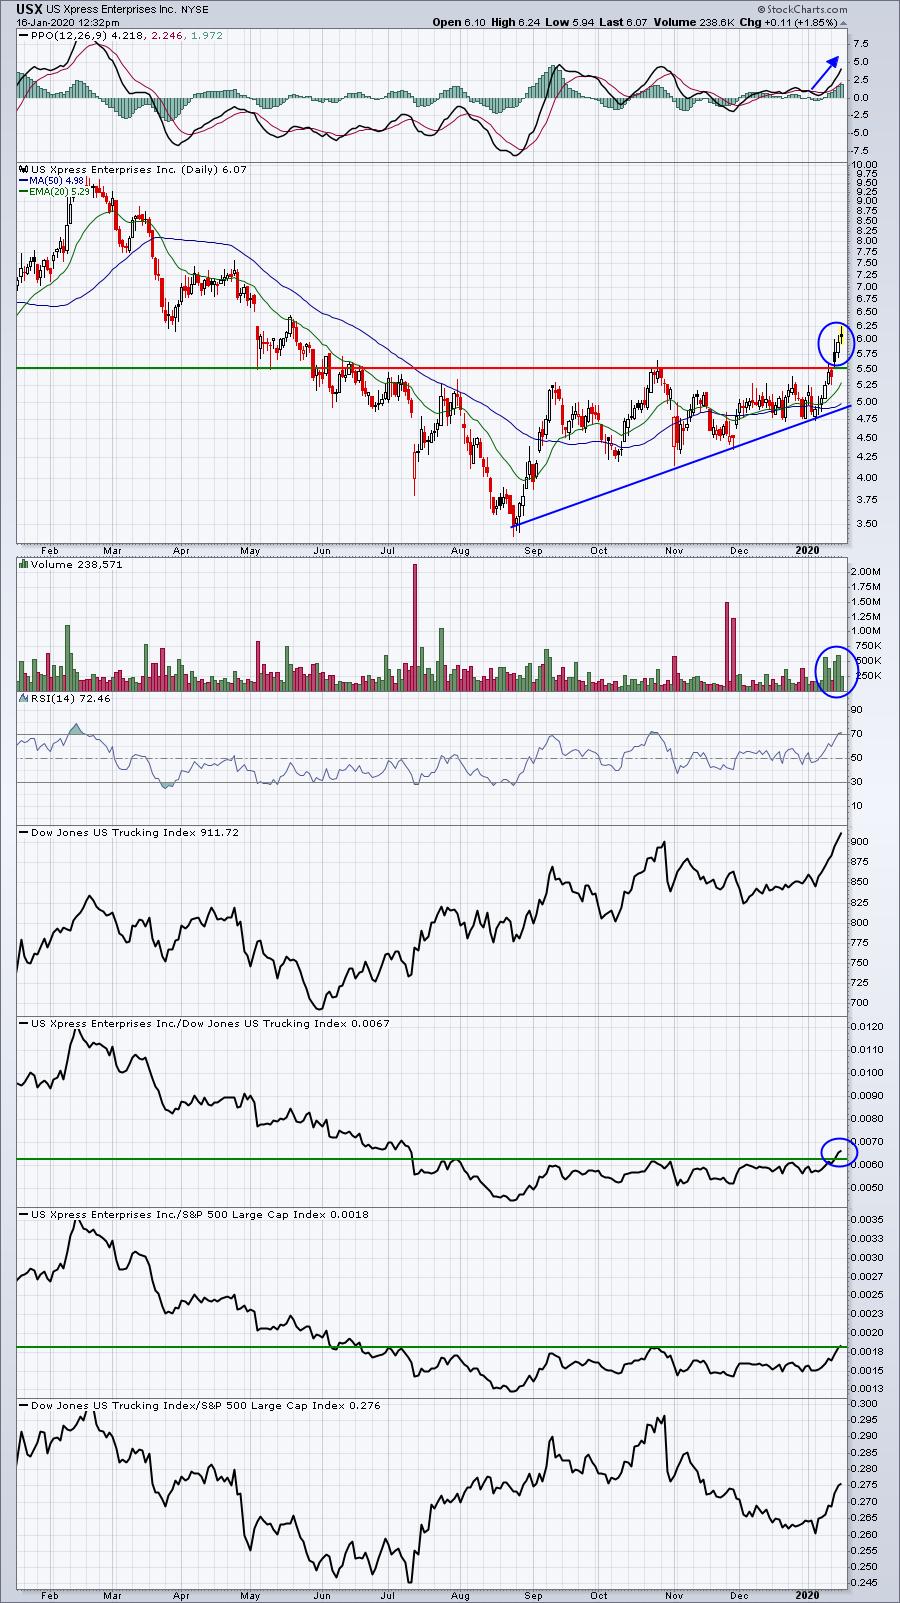
This sure does look to me like a "change of character" on the chart. USX was clearly in a downtrend, but the breakout above 5.50 appears to have reversed that trend. Volume trends have turned much more bullish and the PPO shows surging bullish momentum. A pullback to 5.50 would represent best reward to risk entry.
YRCW:
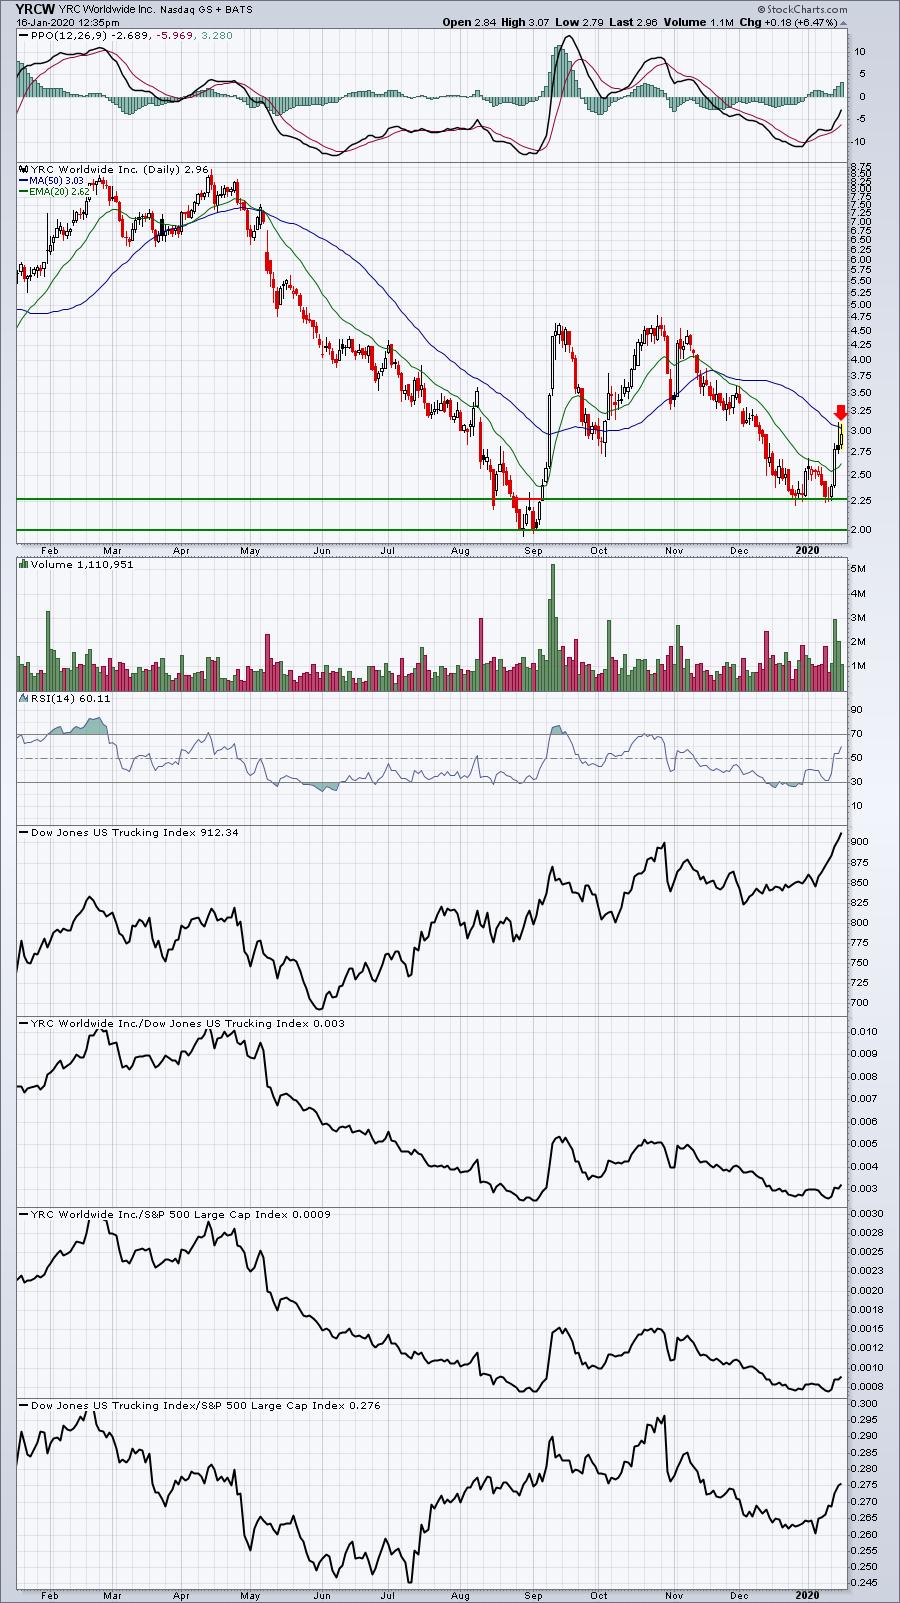
It might be premature to pull the trigger on YRCW at this point, but at least note the double bottom at 2.25 and the breakout above the high between those two lows. The red arrow marks the 50 day SMA. I'd like to see a breakout above that moving average and a PPO that moves into positive territory.
Earnings Reports
Here are the key earnings reports for this week, featuring stocks with market caps of more than $10 billion. I also include a few select companies with market caps below $10 billion. Finally, any portfolio stocks (or active trade alerts) that will be reporting results are highlighted in BOLD. Please make sure you check for earnings dates for any companies you own or are considering owning:
Thursday, January 16:
TSM, MS, CSX, BK, PPG. Others less than $10 bil: OZK, PRGS
Friday, January 17:
HDB, SLB, STT, FAST, CFG, RF, KSU, JBHT
Economic Reports
Initial jobless claims: 204,000 (actual) vs. 215,000 (estimate)
January Philadelphia Fed Business Outlook Survey: 17.0 (actual) vs. 3.0 (estimate)
December retail sales: +0.3% (actual) vs. +0.4% (estimate)
December retail sales less autos: +0.7% (actual) vs. +0.5% (estimate)
November business inventories: -0.2% (actual) vs. -0.1% (estimate)
January housing market index: 75 (actual) vs. 75 (estimate)
Happy trading!
Tom