
EB Daily Market Report - Friday, January 17, 2020
Note
There will not be a Daily Market Report on Monday as financial markets are closed in observance of Martin Luther King's birthday. There also will be no Trading Places LIVE show. Have a great weekend!
Executive Market Summary
- Our major indices are higher once again with more all-time record highs being set
- Real estate (XLRE) is leading today and, along with utilities (XLU), is leading over the past week
- The 10 year treasury yield ($TNX) is up 2 basis points to 1.83%
- Economic reports were mostly strong, especially housing starts which soared above expectations
- Kansas City Southern (KSU, +3.22%) reported earnings and began the day weak, but is now surging higher
- Our only active trade alert VC was up in early action, but has since fallen back near its flat line
Market Outlook
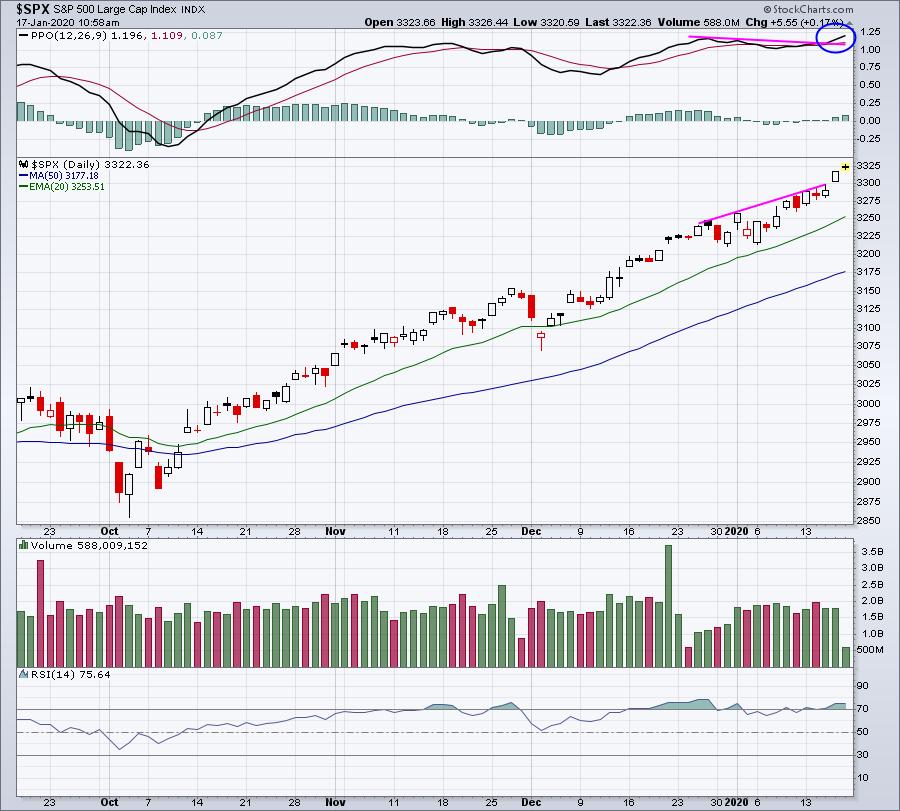
The stock market has a way of having its way. Warning signs can suggest that this freight train of a rally should end, but Wall Street many times will ignore those signs and simply keep on trucking. (Note the two transport puns?) A significant warning sign had emerged in terms of slowing price momentum. We saw negative divergences on both the daily and hourly S&P 500 charts and I pointed that out during the impromptu webinar held Wednesday afternoon. Check out both charts now:
SPX (daily):
SPX (hourly):
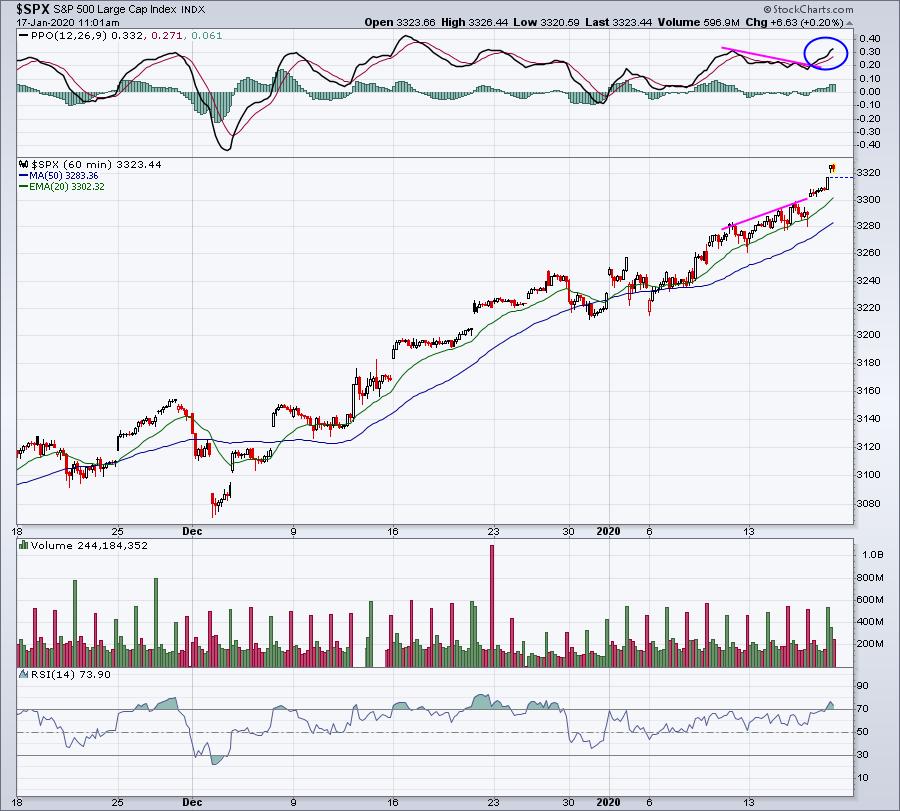
Both of these charts reinforce the notion that technical analysis should never be used to guarantee us anything. Instead, consider using it to help you manage risk. The negative divergences simply alerted us to the fact that price action continued moving higher, while the short-term moving average (12 period EMA) fell vs. the longer-term moving average (26 period EMA). That normally doesn't happen during uptrends and can many times lead to a pullback. Those signals didn't work.
Two other notes. First, the daily PPO is calculated based on where price action is right now. If the S&P 500 were to experience a major reversal by today's close and print a bearish engulfing candle, or a shooting star, there might still be a slight negative divergence on the daily chart. Second, today ends a very bullish historical period from October 27th (close) to January 18th. If we do see a reversing candle print by today's close, I'd respect it as the week after options expire (3rd Friday of every calendar month, which happens to be today) is typically a pull back period for U.S. equities. Remember, that 19th through 25th period of calendar months has historically been the worst week. That's next week.
Sector/Industry Focus
Technology (XLK) has been THE leader for much of the stock market's bull market run. While the negative divergences on the S&P 500 appear to be waning, or eliminated, the 60 minute negative divergence on the XLK does still remain:
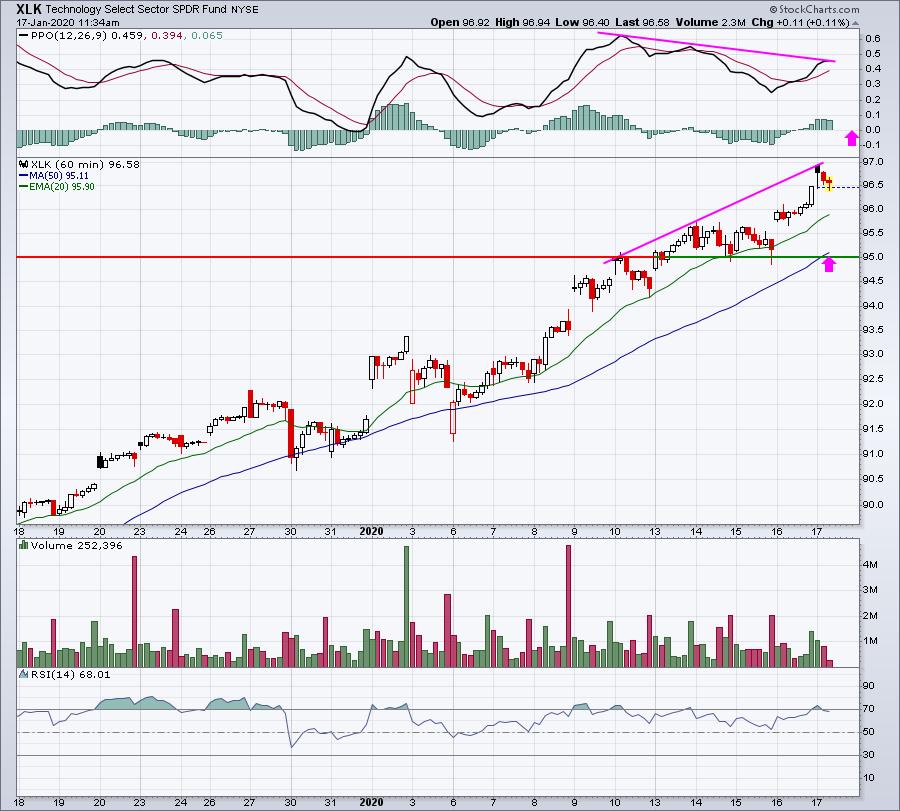
If we see a reversal in the market this afternoon and finish lower, the pink arrows mark two key things that I'd look for - a PPO centerline test and a 50 hour SMA test. Short-term price support is represented by the horizontal line at 95.
Active Trade Alerts
We have just one active alert right now:
VC (+0.01%) - reports earnings on February 19. VC was higher earlier today, but is now back near the flat line. The failure was at the 50 day SMA, which might require another attempt or two to break through. A close above the 50 day SMA would be another positive development for VC and could propel it back toward the series of highs in the 95-97 range.
Strong Earnings ChartList (SECL)
The stock market is determined to stay in record high territory as we saw yet another gap higher this morning. We have warning signs in place, although the negative divergence on the S&P 500 is gone. They can be eliminated by price action simply continuing to rise and that's what's happened with our key indices. The S&P 500 chart in the Market Outlook section above helps to illustrate this.
I can argue that we could be in a short-term topping phase, but the market may have other ideas. In the event we don't pause, it's a great time to check out our SECL stocks that are setting new 52 week highs today. I prefer such stocks breaking out of a base. First, I ran the following scan:
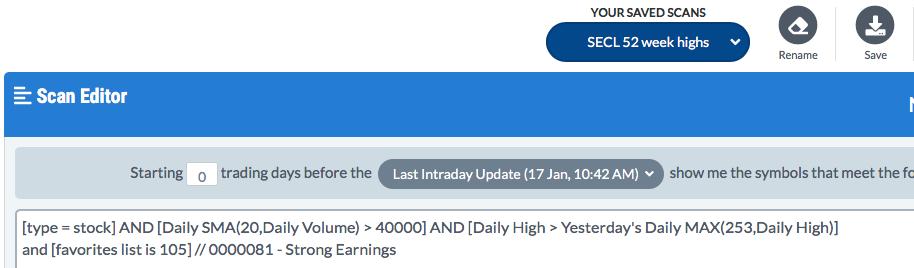
This scan returned 48 of our 281 SECL stocks. Of these 48, I found the following stocks interesting as they're breaking out from prior bases, as opposed to setting new 52 week highs for multiple days consecutively, likely resulting in very overbought conditions and stretched PPOs:
BXP:
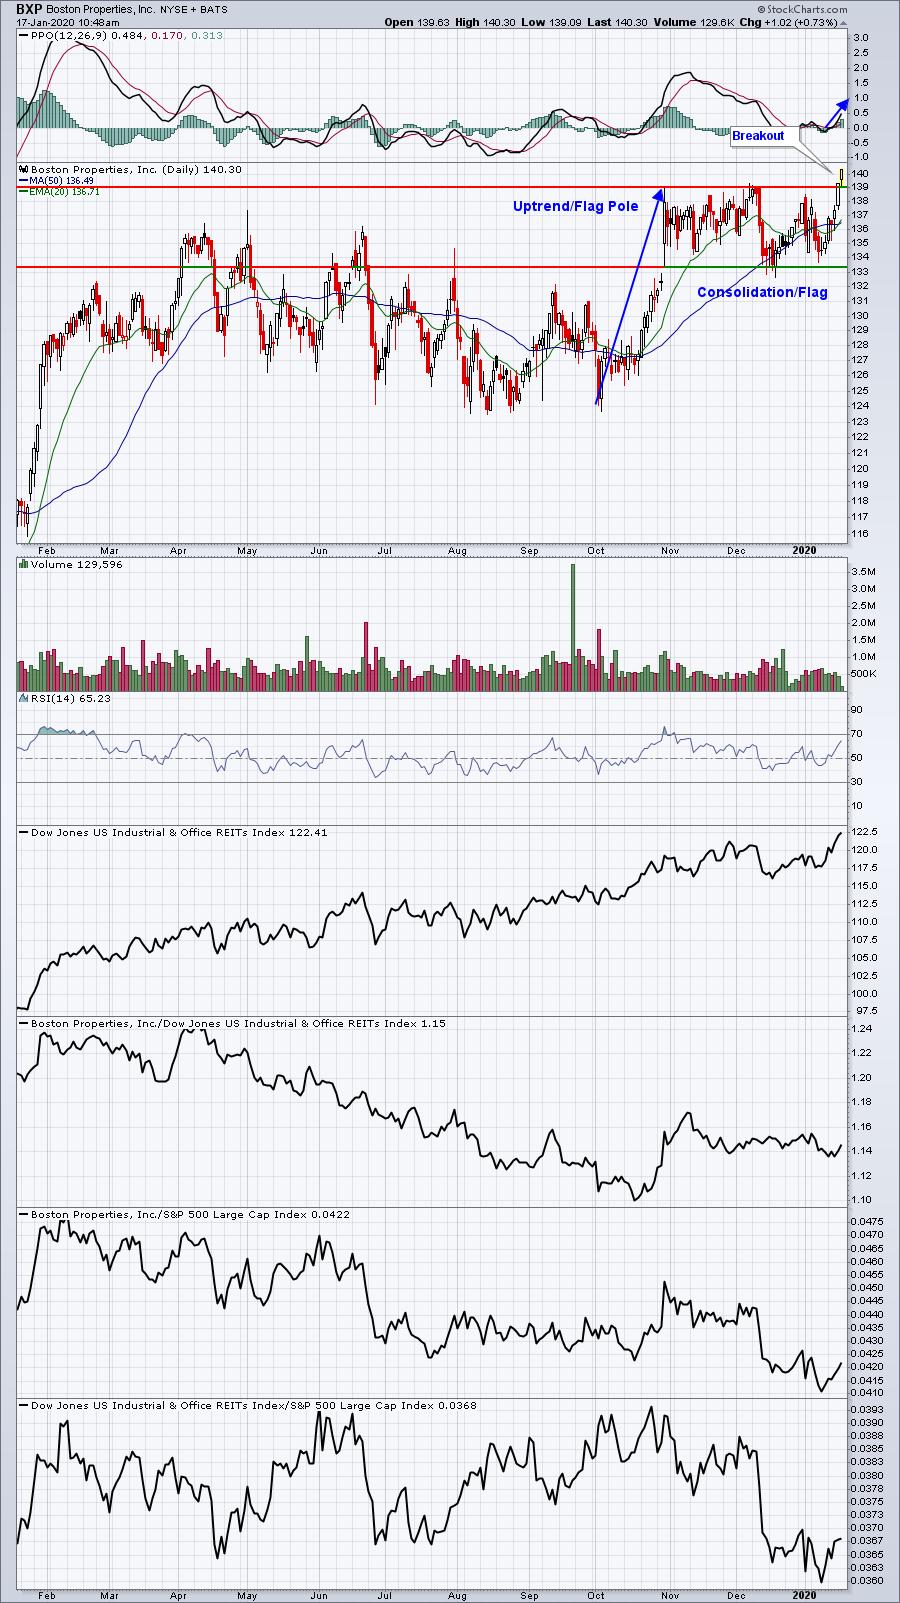
This is in the real estate area and would likely hold up better if the market were to pause over the next couple days to couple weeks. Failure to hold its rising 20 day EMA would require re-evaluation, however.
QCOM:
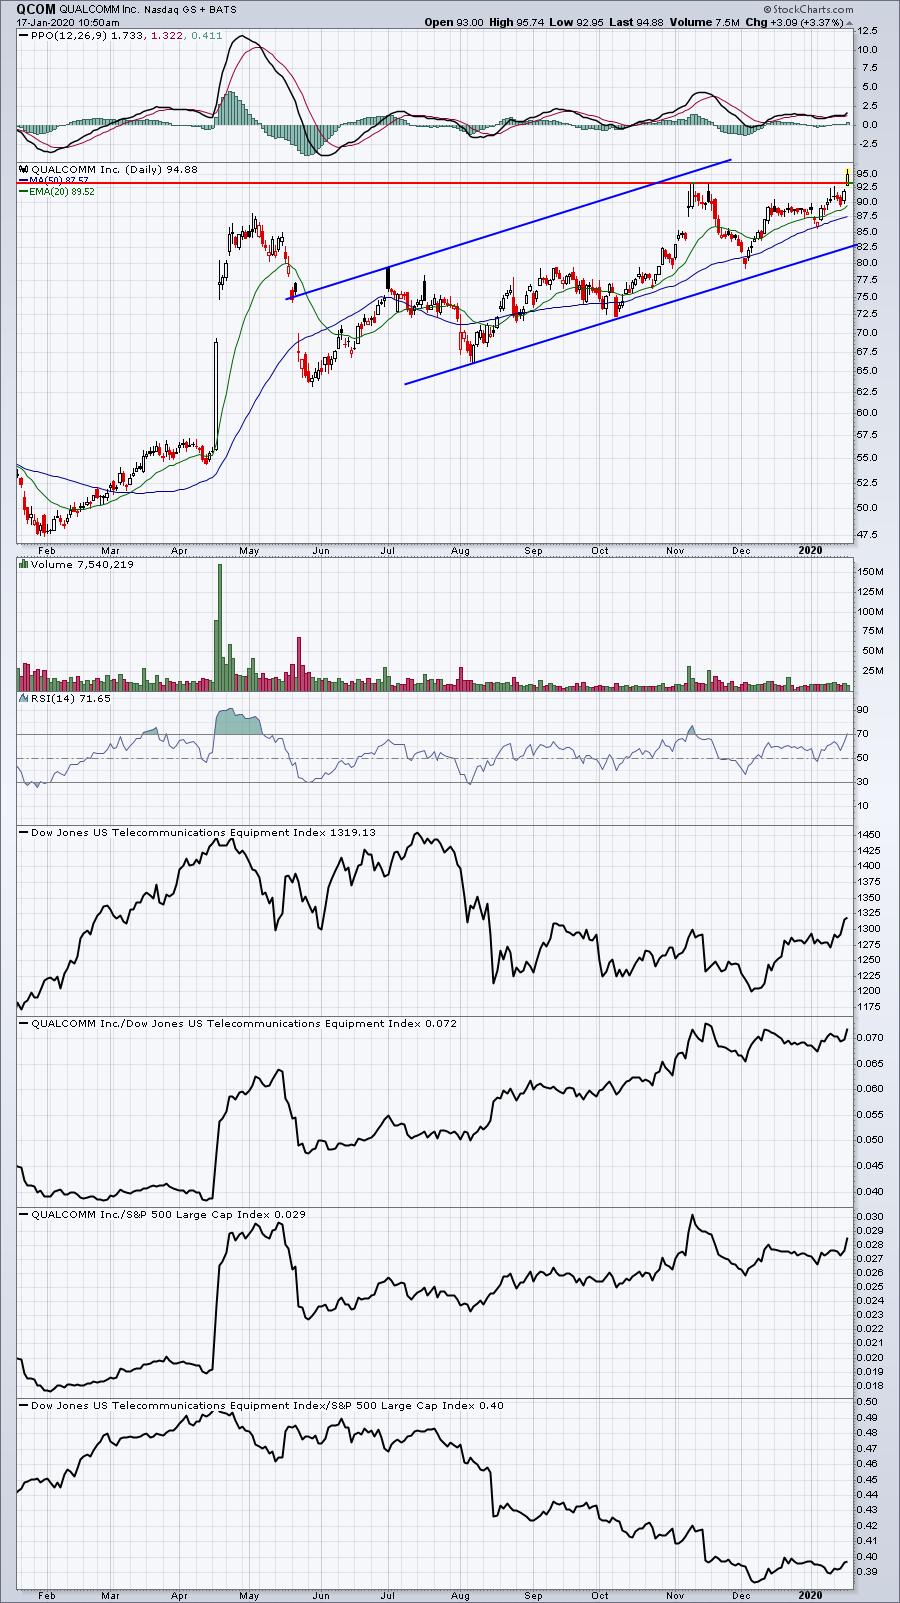
Make sure that QCOM confirms its breakout into the close. The open today was below the breakout level, so a reversal later today and close beneath that resistance line would be short-term bearish and likely result in a 20 day EMA test. I do like QCOM, though, as it appears to be trending nicely higher within an uptrend channel.
Movers & Shakers
Aerospace ($DJUSAS) has been in the tank for awhile, so if I had to pick a stock in this group to invest in, I'd have to pick a leader. United Technologies (UTX) is just that and is the 2nd best performing Dow Jones stock today. Despite a very difficult headwind from the group's relative weakness, UTX is breaking to another all-time high. Here's the chart:
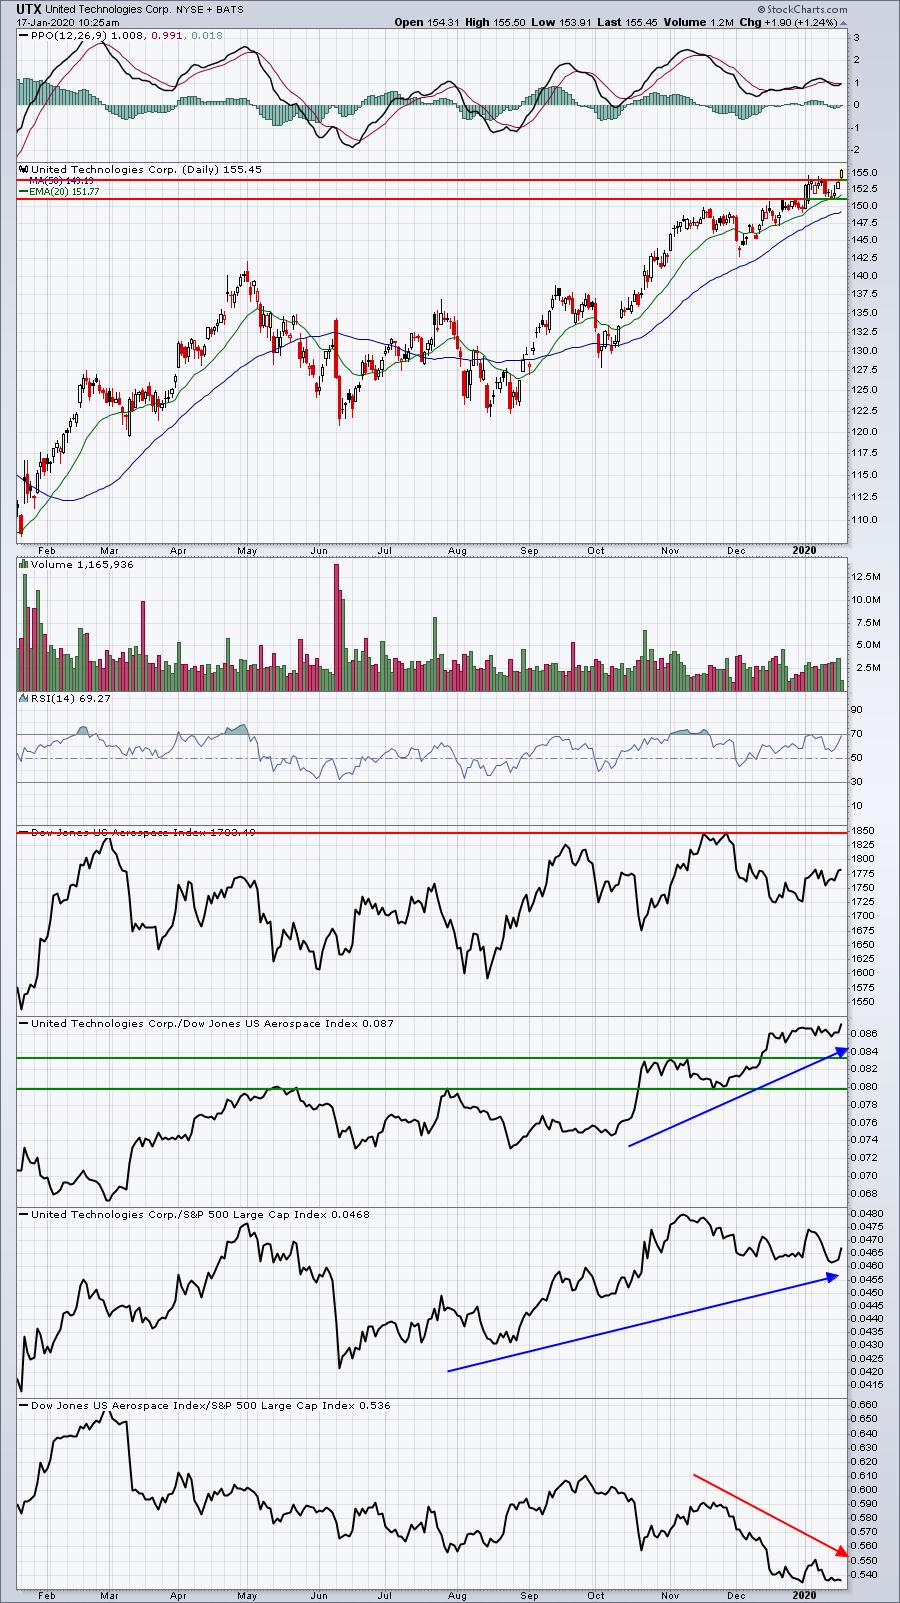
The bottom panel perfectly illustrates how badly aerospace stocks have been performing. They've been one of the worst groups. There's a clear overhead price resistance (double top) that needs to be negotiated on an absolute basis, so watch for that. The recent lows are at least rising, one positive sign, but the real outlook change won't likely come until we see that double top breakout.
Earnings Reports
Here are the key earnings reports for this week, featuring stocks with market caps of more than $10 billion. I also include a few select companies with market caps below $10 billion. Finally, any portfolio stocks (or active trade alerts) that will be reporting results are highlighted in BOLD. Please make sure you check for earnings dates for any companies you own or are considering owning:
Friday, January 17:
HDB, SLB, STT, FAST, CFG, RF, KSU, JBHT
Monday, January 20:
EDU. Others less than $10 bil: LOGI
Tuesday, January 21:
NFLX, COF, AMTD, UAL, HAL. Others less than $10 bil: CMA, ZION
Economic Reports
December housing starts: 1,608,000 (actual) vs. 1,373,000 (estimate)
December building permits: 1,416,000 (actual) vs. 1,458,000 (estimate)
December industrial production: -0.3% (actual) vs. -0.3% (estimate)
December capacity utilization: 77.0% (actual) vs. 77.1% (estimate)
January consumer sentiment: 99.1 (actual) vs. 99.3 (estimate)
Happy trading!
Tom