
EB Daily Market Report - Wednesday, January 22, 2020
Executive Market Summary
- The upward pursuit in U.S. equities is relentless
- Our major indices gapped higher, pulled back late morning, and are trying to rally again
- The NASDAQ is leading the action as Tesla (TSLA) soars again; Intel (INTC) also is breaking out ahead of its earnings, scheduled for tomorrow after the close
- Technology (XLK) is the best performing sector, led higher by IBM's better-than-expected earnings
- The 10 year treasury yield ($TNX) is flat near 1.77%, despite a strong existing home sales report
- Our only active trade alert VC is down fractionally; we've raised our closing stop (see below)
Market Outlook
The Dow Jones has been consistently setting all-time record highs nearly day after day, but looking exclusively at its absolute price chart doesn't tell us the entire picture. The Dow Jones has underperformed the S&P 500 in a big way over the past year as the following chart illustrates:
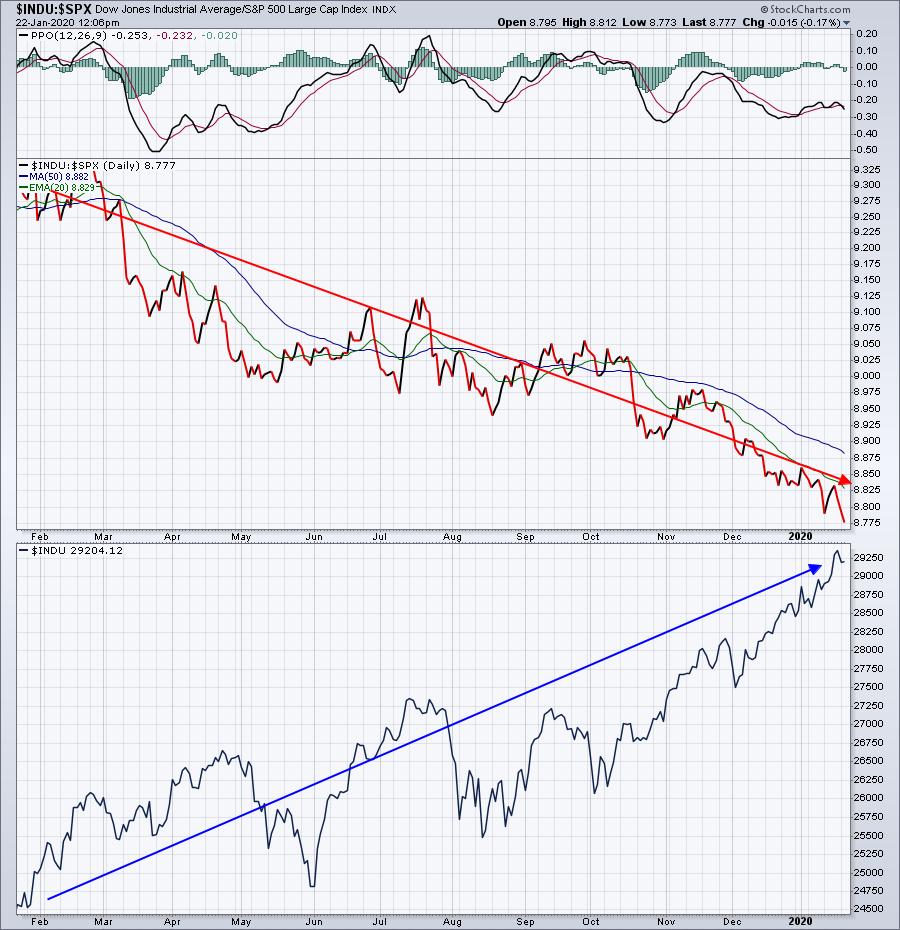
The bottom panel looks great, but money invested in the Dow Jones is not working as hard as money in the S&P 500. If we look at the Dow Jones component stocks' one year performance, we can quickly zero in on the companies that are holding back the Dow Jones:
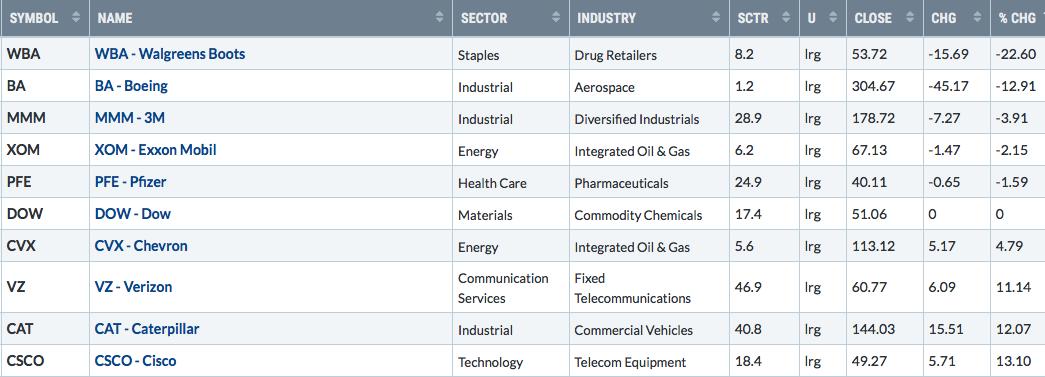
Not too surprisingly, not a single one of these stocks is on our Strong Earnings ChartList (SECL). The SECL helps to keep us out of underperforming stocks.
Sector/Industry Focus
Medical supplies ($DJUSMS) is the 10th best industry group so far in 2020 and that relative strength might just continue. The key development in the space has been the end of a very lengthy consolidation period that began in January 2018 when the overall market topped. It's been slow to break out, but this month it finally happened:
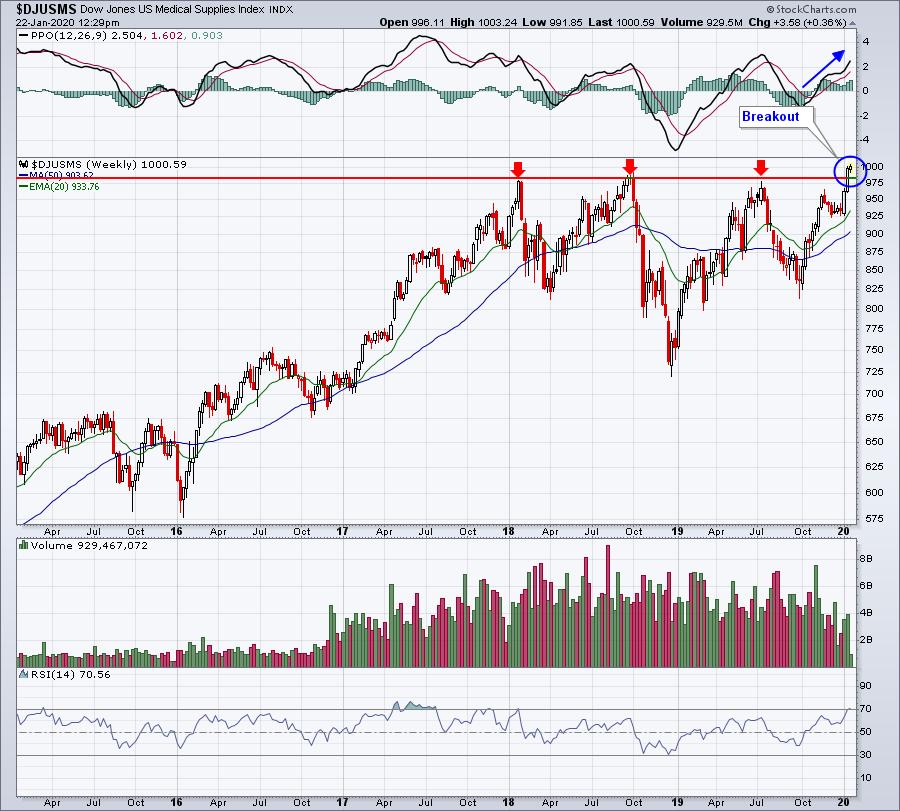
Even if the breakout level were to fail on a pullback, I'd fully expect that rising 20 week EMA to provide excellent support.
Active Trade Alerts
We have just one active alert right now:
VC (-0.92%) - reports earnings on February 19. The heavy volume reversal yesterday and failure at the 50 day SMA is concerning. Now today VC finds itself back below the 20 day EMA, currently at 88.09. The major support remains gap support at 83.92, but I'm not interested in VC falling back to that level. We are going to add a closing stop below the 20 day EMA, so unless VC recovers today, we'll exit with hopefully a small profit (our average entry was 86.05).
Strong Earnings ChartList (SECL)
Yes, the stock market has been moving higher almost every day, but not all technically-sound companies move higher in unison. One scan that I like to run quite often against the SECL is my RSI 40-50 scan. If it returns too many companies, then I adjust the RSI to 40-45. Any uptrending stock that pulls back and prints an RSI in the 40s is a potential trading candidate, in my view. I ran this scan today and it returned 46 stocks. Instead of changing the RSI, however, I added another criterion - SCTR above 75. The higher SCTR helps to ensure that a stock remains relatively strong. Adding the SCTR criterion lowered my results from 46 to 12. They are as follows:
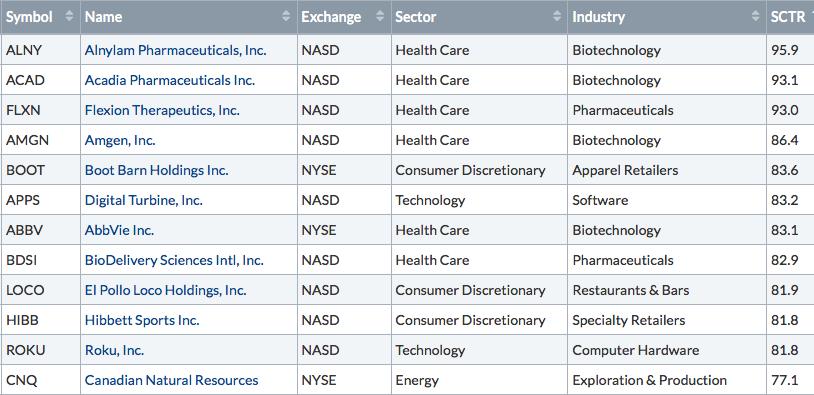
I think the following remain very interesting trade candidates:
AMGN:
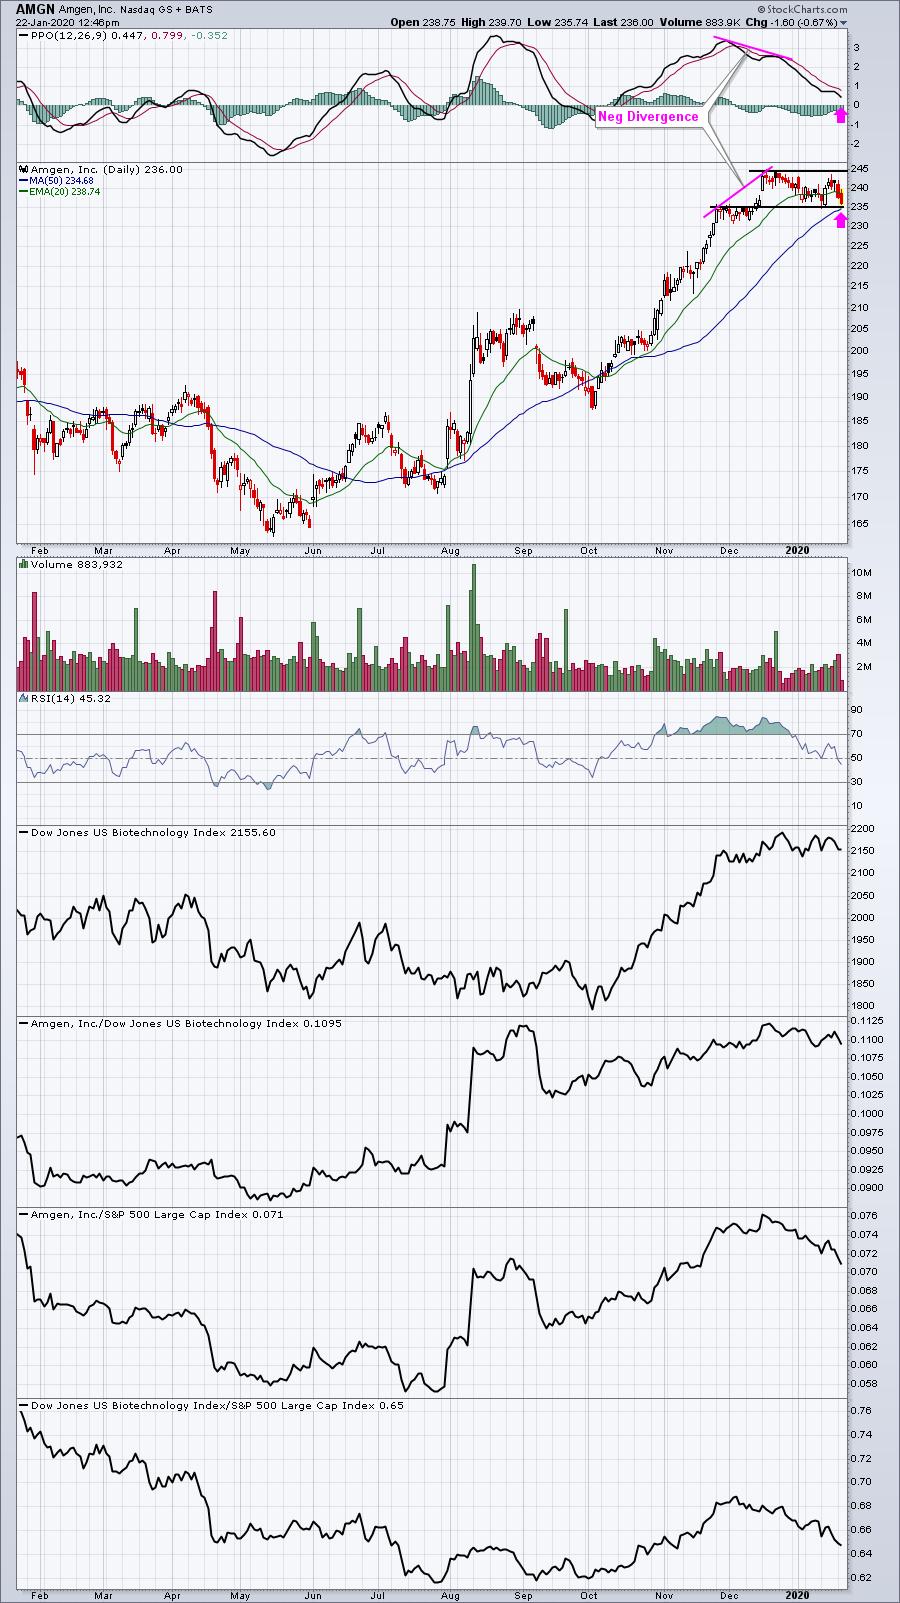
The negative divergence typically leads to a PPO centerline test and/or a 50 day SMA test. We're just about there. Watch the biotech index ($DJUSBT) resistance at 2200. If that breaks, I suspect AMGN will be a very solid investment in 2020.
BOOT:
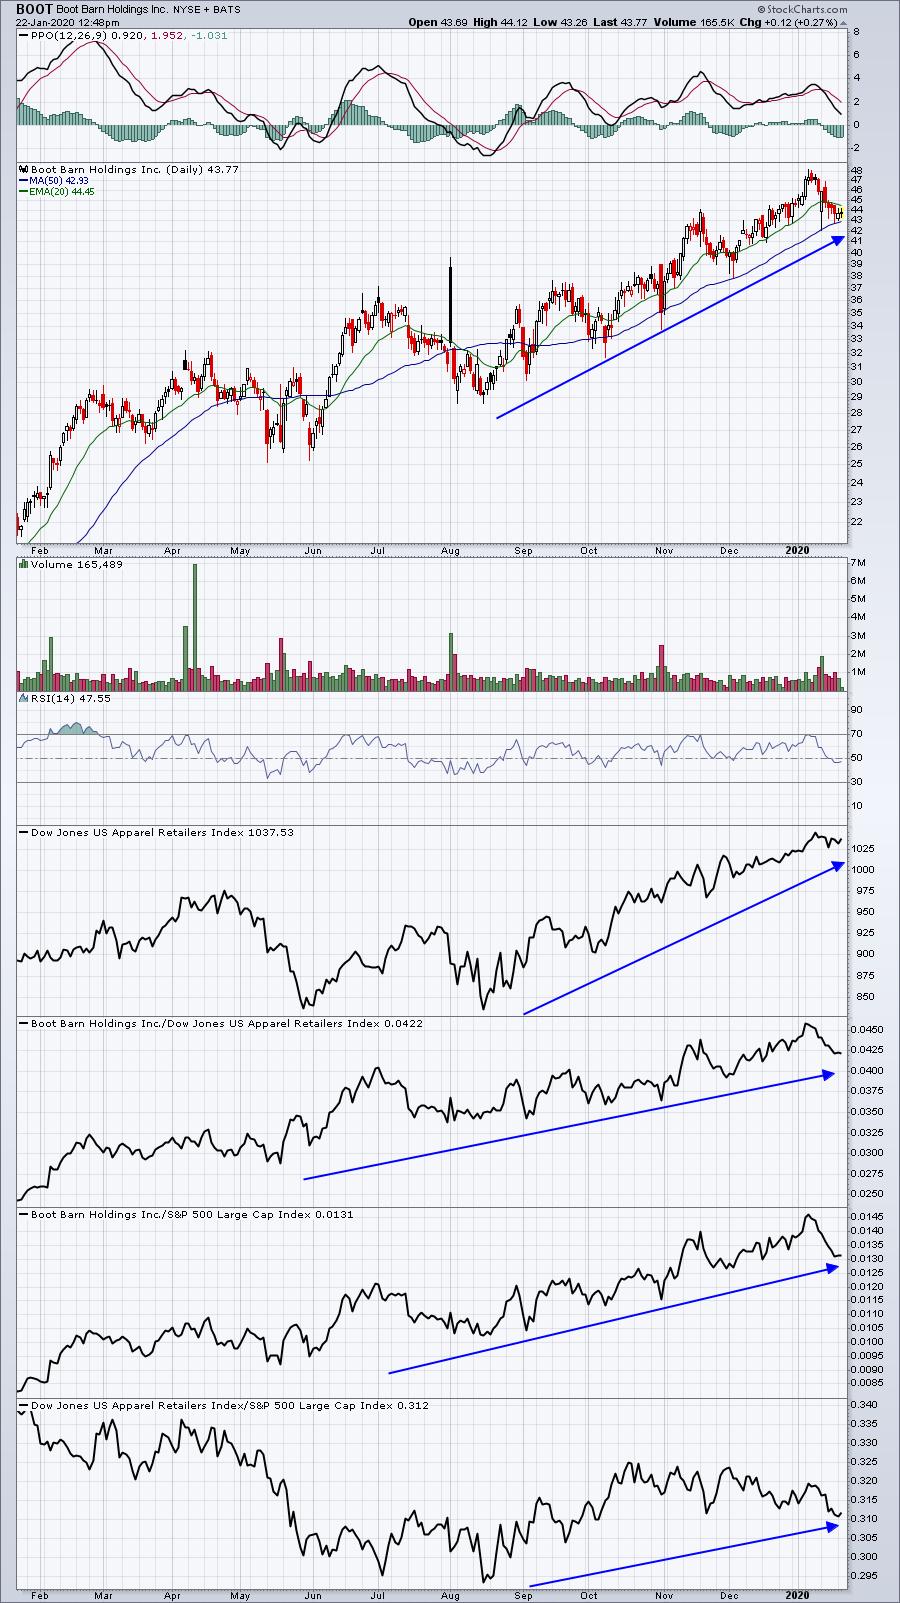
The uptrend appears to remain solidly in place and BOOT has seen its RSI dip into the 40s a few times the past several months and it's been an entry opportunity each time.
BDSI:
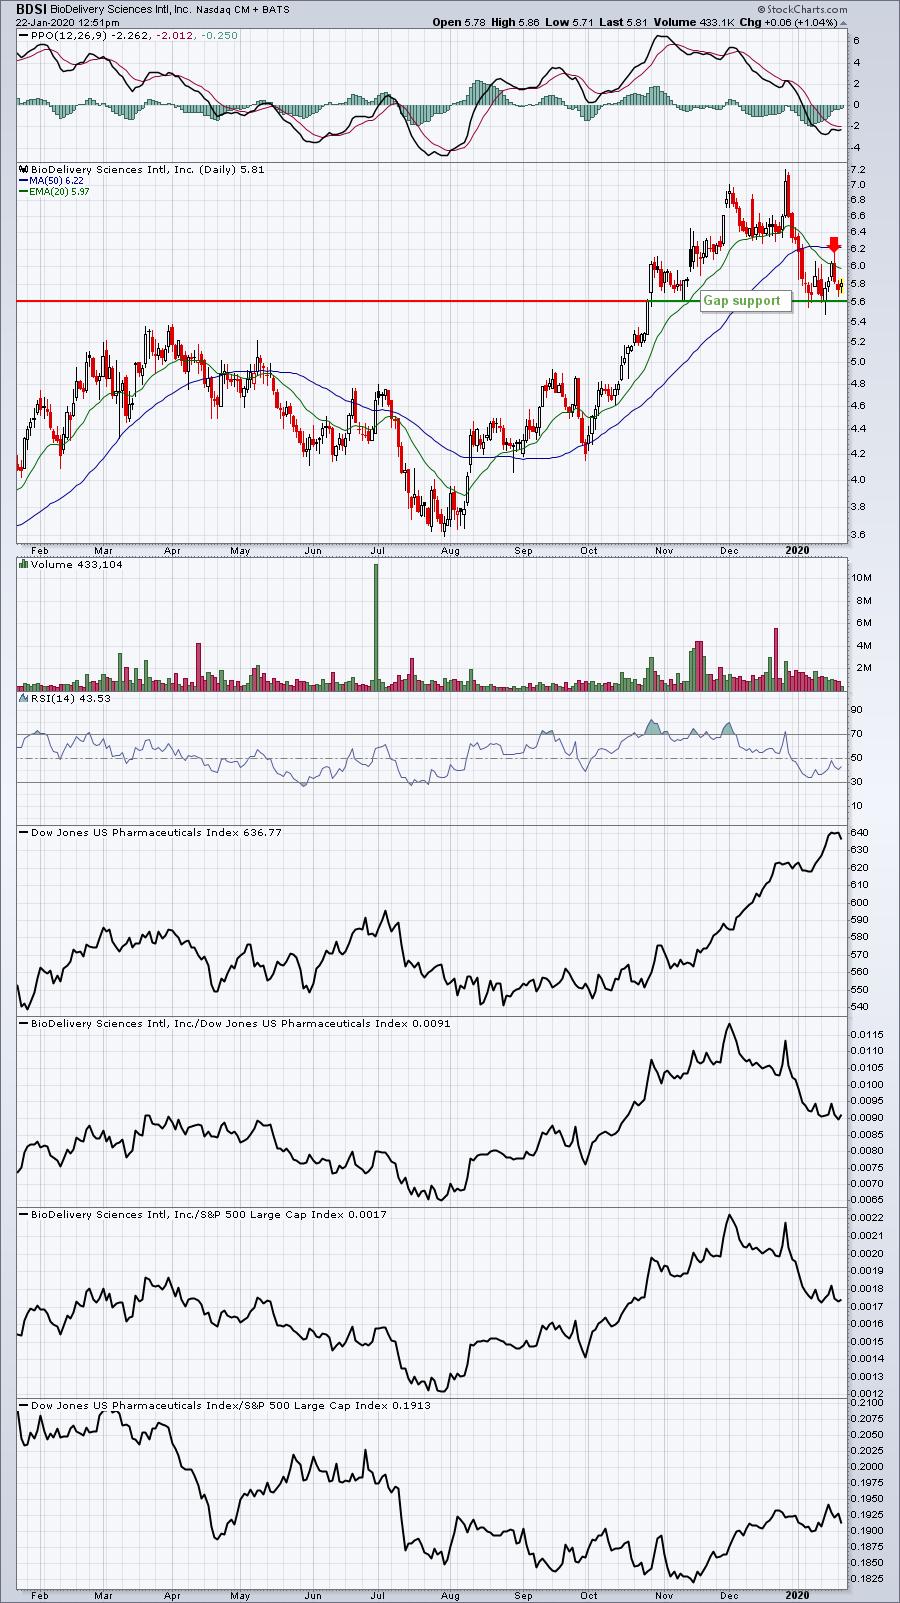
BDSI is squeezing between overhead resistance at its 20 day EMA and gap support near 5.60. A breakout above 6.00 could lead to another explosive rally. One piece of technical evidence not pictured above is that BDSI is testing its rising 20 week EMA, currently at 5.70 (today's low 5.71).
Movers & Shakers
I discussed medical supplies earlier, so I thought I'd provide you a couple medical supplies stocks showing great technical movement in 2020 thus far.
HSIC:
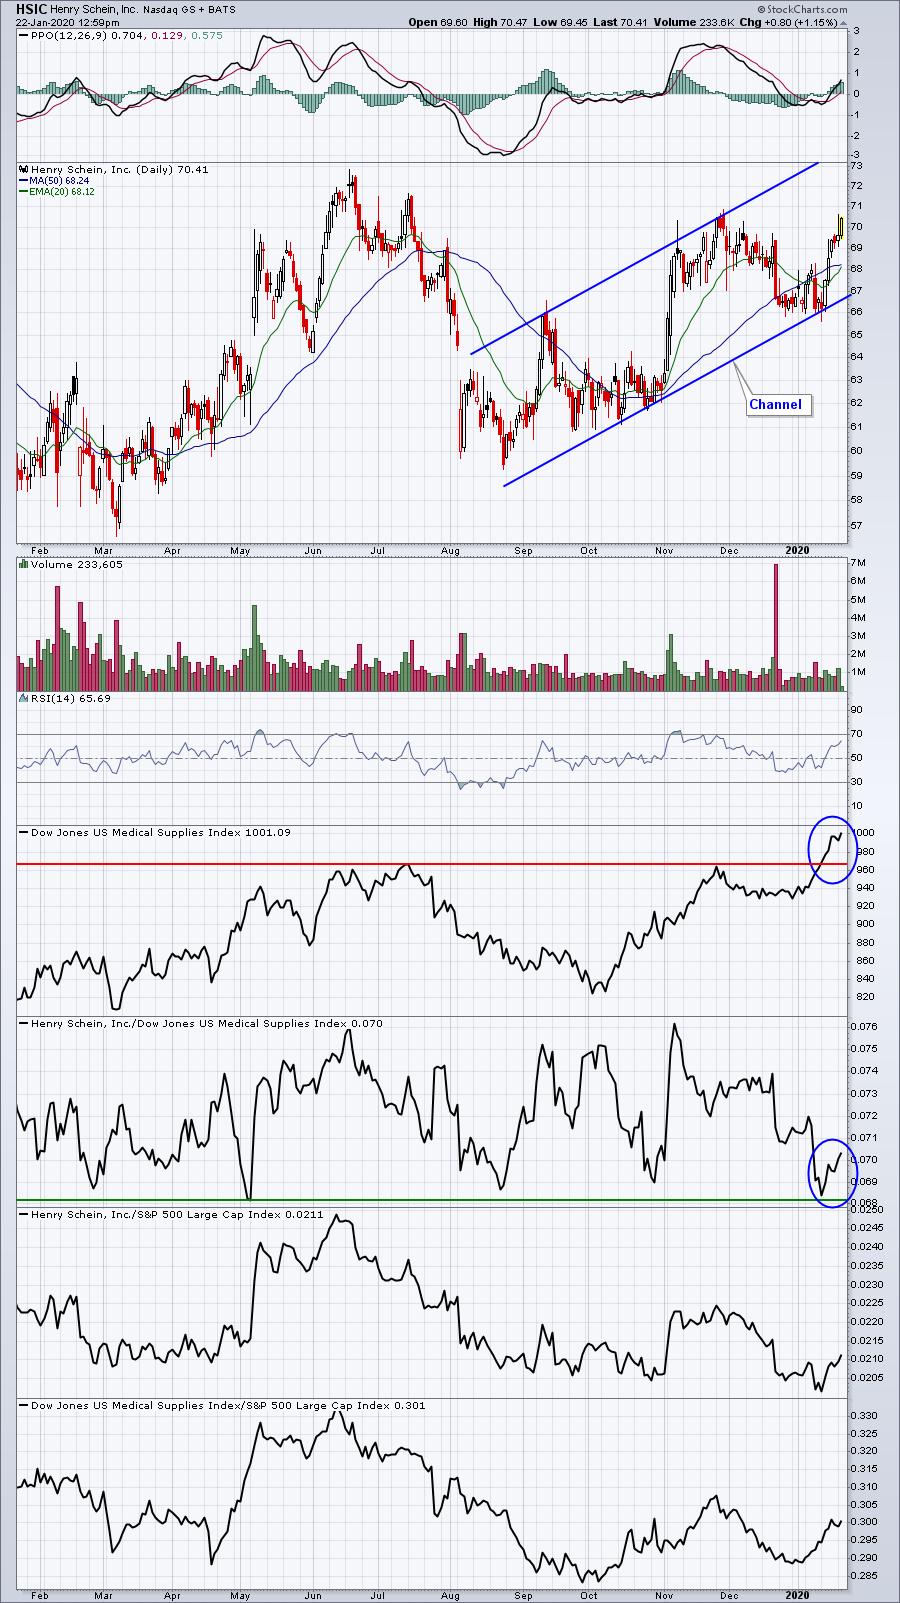
HSIC is in a very bullish channel and it's just begun to show relative strength vs. its peers. Still, that relative strength line was near a 52 week low recently, so I wouldn't tolerate much poor action. There's plenty of overhead price resistance from 71 to 73 as well, so it probably makes sense to watch this one for now. Its SCTR today is higher by 12.3 to 48.1, ranking it as the best SCTR mover among large cap medical supplies companies.
XENT:
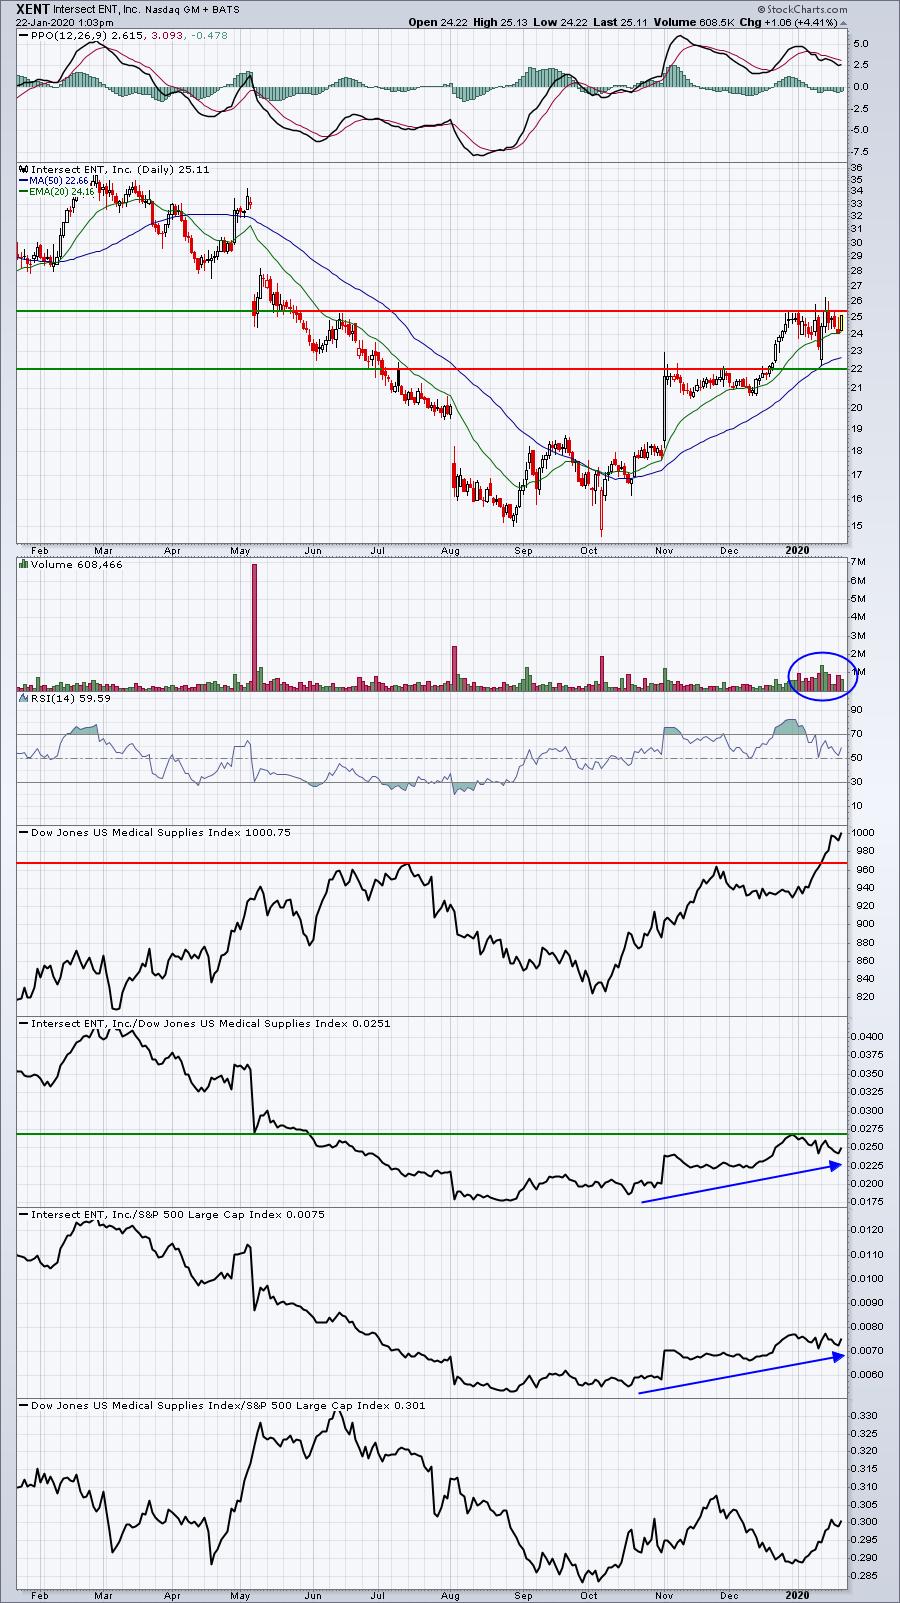
Since printing that double bottom in August and October, XENT has been rallying very nicely and is clearly uptrending. Volume has expanded in January during a period of consolidation, so I'm anxious to see which way XENT breaks. XENT is the top SCTR mover among small cap medical stocks, rising 8.7 to 79.8.
Earnings Reports
Here are the key earnings reports for this week, featuring stocks with market caps of more than $10 billion. I also include a few select companies with market caps below $10 billion. Finally, any portfolio stocks (or active trade alerts) that will be reporting results are highlighted in BOLD. Please make sure you check for earnings dates for any companies you own or are considering owning:
Wednesday, January 22:
JNJ, ABT, ASML, TXN, PLD, KMI, APH, RCI, BKR, NTRS, FITB, CTXS, TDY, RJF, TER, ALLY. Others less than $10 bil: SLG, STLD, SLM
Thursday, January 23:
PG, INTC, CMCSA, UNP, ISRG, KMB, VFC, TRV, LUV, DFS, STM, MTB, SWKS, KEY, FCX, TEAM, HBAN, SIVB, AAL, ETFC. Others less than $10 bil: JBLU, AVT, AVX, HTH
Friday, January 24:
NEE, AXP, APD, ERIC, SYF. Others less than $10 bil: HRC, SNV
Economic Reports
November FHFA house price index: +0.2% (actual) vs. +0.3% (estimate)
December existing home sales: 5,540,000 (actual) vs. 5,430,000 (estimate)
Happy trading!
Tom