
EB Daily Market Report - Thursday, January 23, 2020
Executive Market Summary
- The U.S. stock market is floundering a bit as there appears to be a risk-off mentality building
- The 10 year treasury yield ($TNX) is down 5 basis points to 1.72% amidst the flight to safety
- Crude oil ($WTIC) is down another 2.5% to $55 per barrel as energy (XLE) leads to downside again
- Real estate (XLRE) and utilities (XLU) are among today's leaders, reflecting the market's nervousness
- Coronavirus cases accelerate, including cases in new countries
- The Travelers (TRV), a Dow Jones component stock, is down 5% today after reporting its latest results
- Our active trade alert VC was stopped out yesterday, but today's reversal is quite encouraging for anyone still holding (see below)
Market Outlook
The NASDAQ has been leading the move higher in U.S. equities, but there is a very short-term head & shoulders formation now in place. Should it execute, I wouldn't look for a lot of selling, but another 1% below today's low would be a possibility:
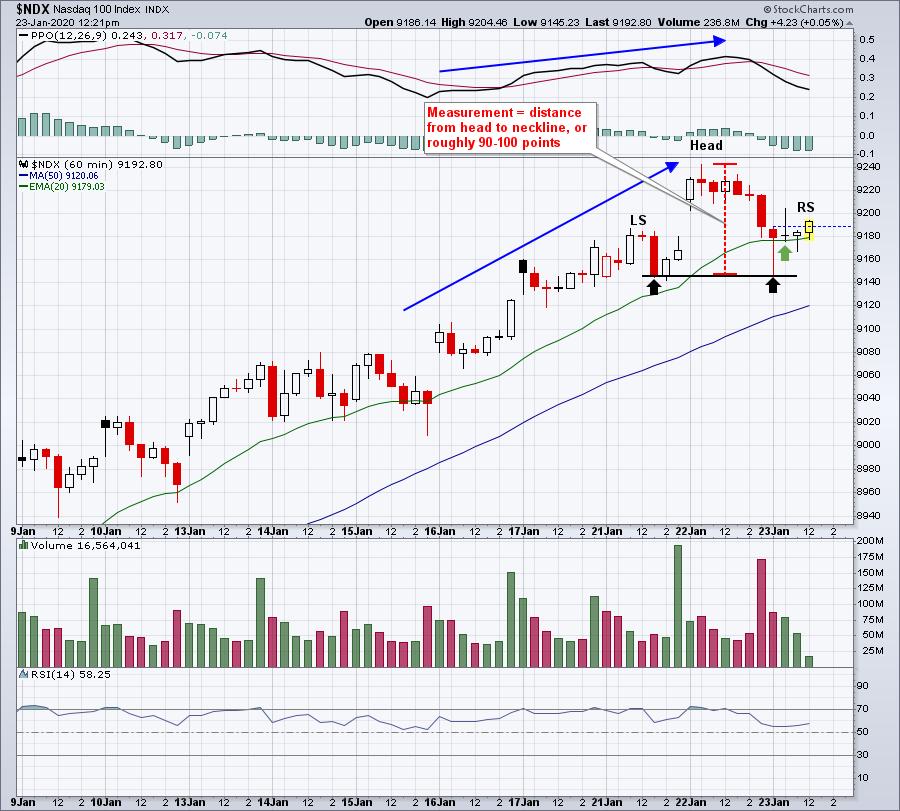
It wasn't too long ago that I posted a similar chart on the S&P 500 that never executed. This one may not either. In fact, the rising PPO suggests that the 20 hour EMA tests (green arrow) are likely to hold. A move above the head would eliminate this pattern. A move below the neckline (black horizontal line) would trigger the measurement down to perhaps 9040-9050.
Sector/Industry Focus
Heavy construction ($DJUSHV) has struggled this week after testing overhead resistance in the 480-485 area:
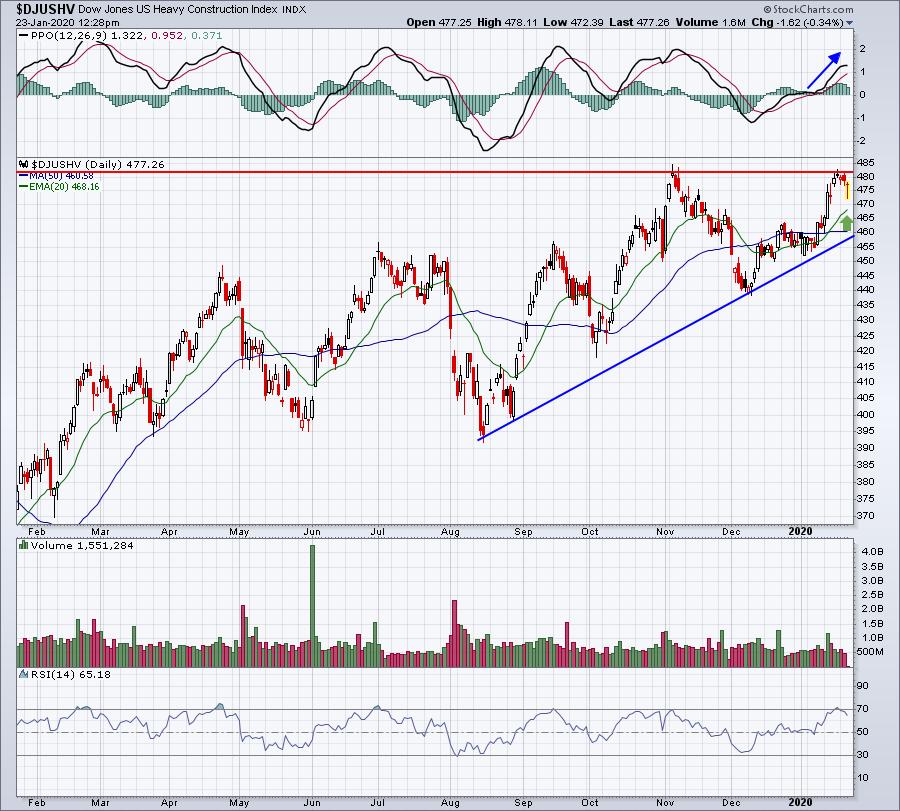
We wouldn't be in "blue sky territory" with a breakout, however, as the DJUSHV hit a high just above 500 in January 2018, so that resistance level would be next if we can negotiate 485. Still, it's one step at a time in an uptrend and, thus far, the DJUSHV seems to be moving higher in that manner. The PPO is strengthening above the zero line, so I've placed a green arrow at the 20 day EMA to highlight where I'd expect buyers to return on any further weakness.
Active Trade Alerts
We have no active alerts right now as VC was stopped out at yesterday's close:
VC (+0.95%) - reports earnings on February 19. We were stopped out yesterday as VC closed beneath our raised closing stop of the 20 day EMA. Therefore, it comes off with a very slight gain. Today's action, while volatile, is much more encouraging as it fell to 83.16, well beneath both gap support at 83.92 and the previous low two weeks ago at 83.75. That definitely could be market makers grabbing additional shares. A big rise from here wouldn't shock me, but we were stopped out. If still holding, continue to watch gap support at 83.92. Any close below that would clearly take me out of the trade.
Strong Earnings ChartList (SECL)
Another way to trade the SECL is to find stocks with strong upside momentum (higher PPO on most recent price high) pulling back to test their rising 20 day EMAs. I have a preference for such stocks opening above their 20 day EMA, trading beneath it intraday, and then moving back above it. Here's the scan I run to find these stocks:

....and here were the results:
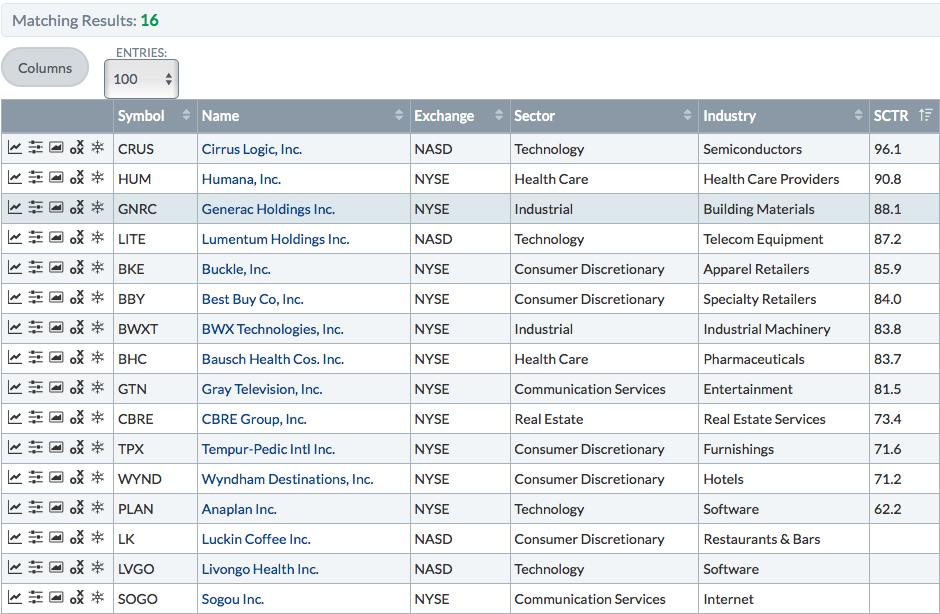
First, let me illustrate the type of chart I'd avoid on this list.
BBY:
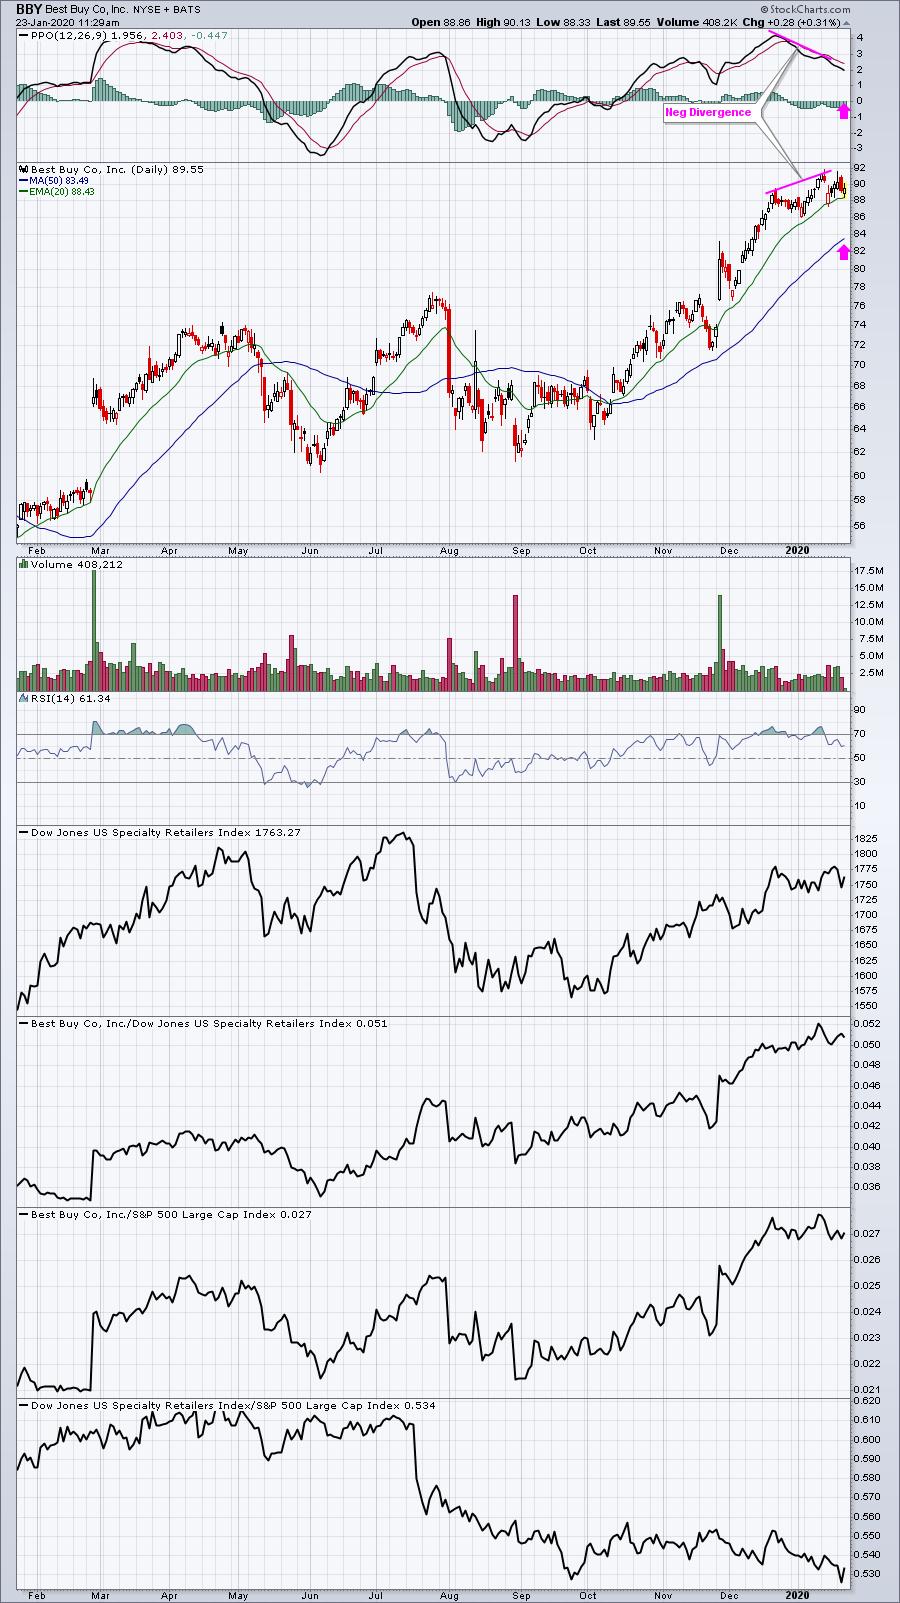
Remember, I want STRONG momentum, so a higher PPO on the most recent price high. We have the opposite here. BBY's latest price high accompanied a lower PPO reading, which is a negative divergence. Also, note that the volume on its latest breakout was moderate at best. BBY is a solid company with a very good chance to move higher, but I'd be cautious near-term for the reasons I just explained. The pink arrows mark two technical conditions I'd expect to see - a PPO centerline test and/or a 50 day SMA test - to unwind the short-term momentum issue.
Here are three that I think look more promising:
PLAN:
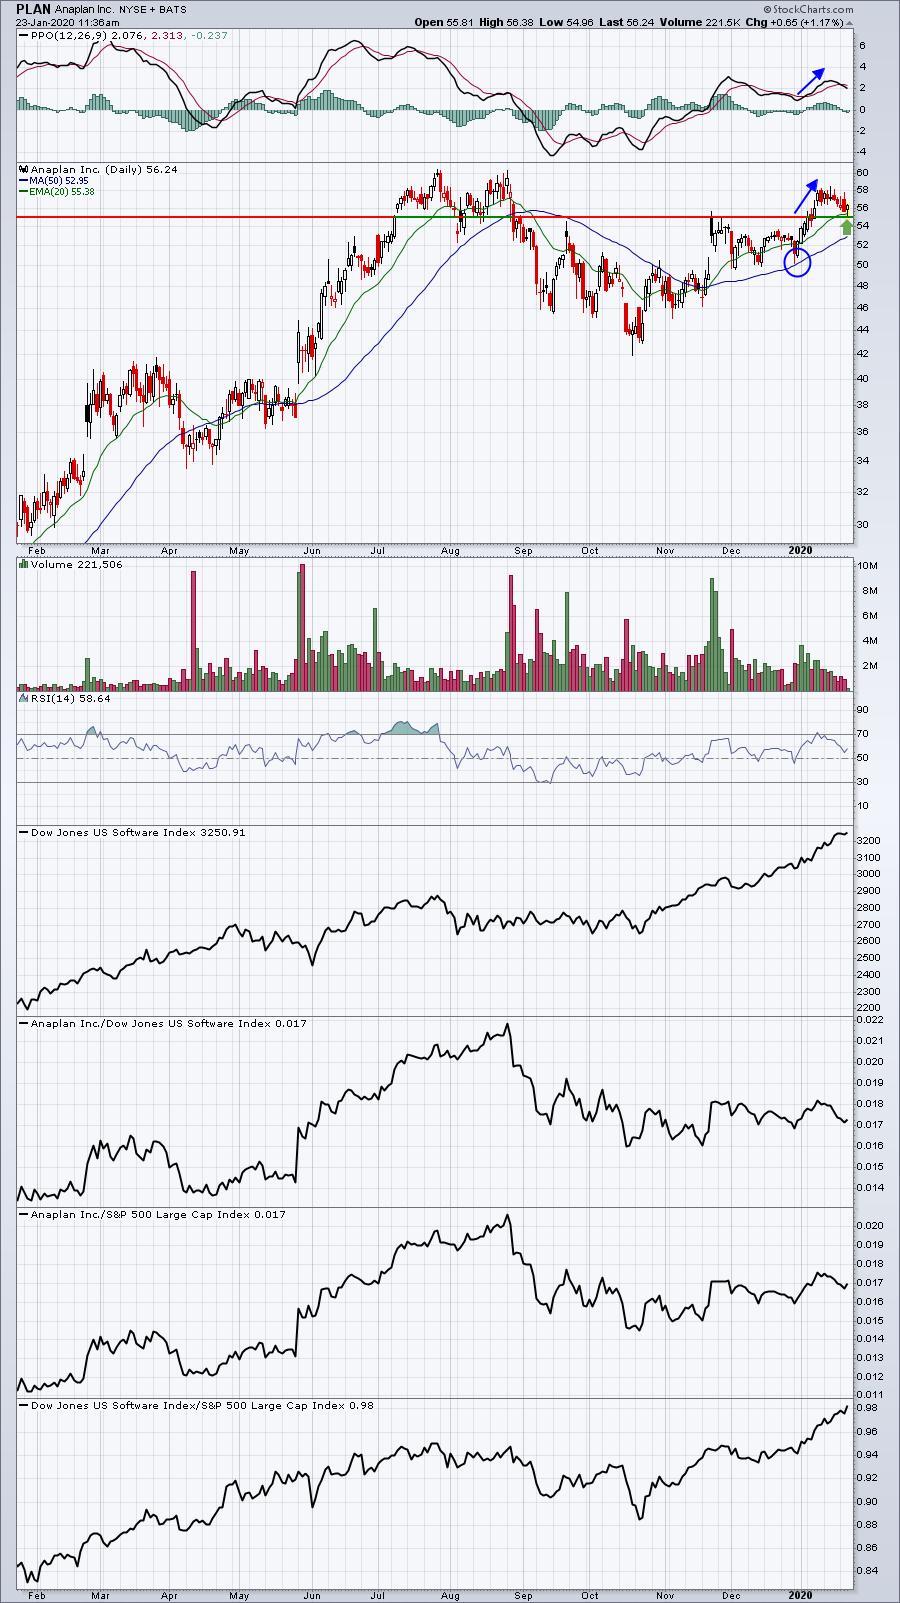
PLAN is coming off a 50 day SMA test and its PPO is re-igniting. As momentum strengthens, the odds of a successful 20 day EMA test grow. Entry at or near that 20 day EMA test can provide an excellent reward to risk setup with an initial target back at the recent high. For those who enjoy longer-term trades, you can hold longer and expect a breakout above the previous high.
LVGO:
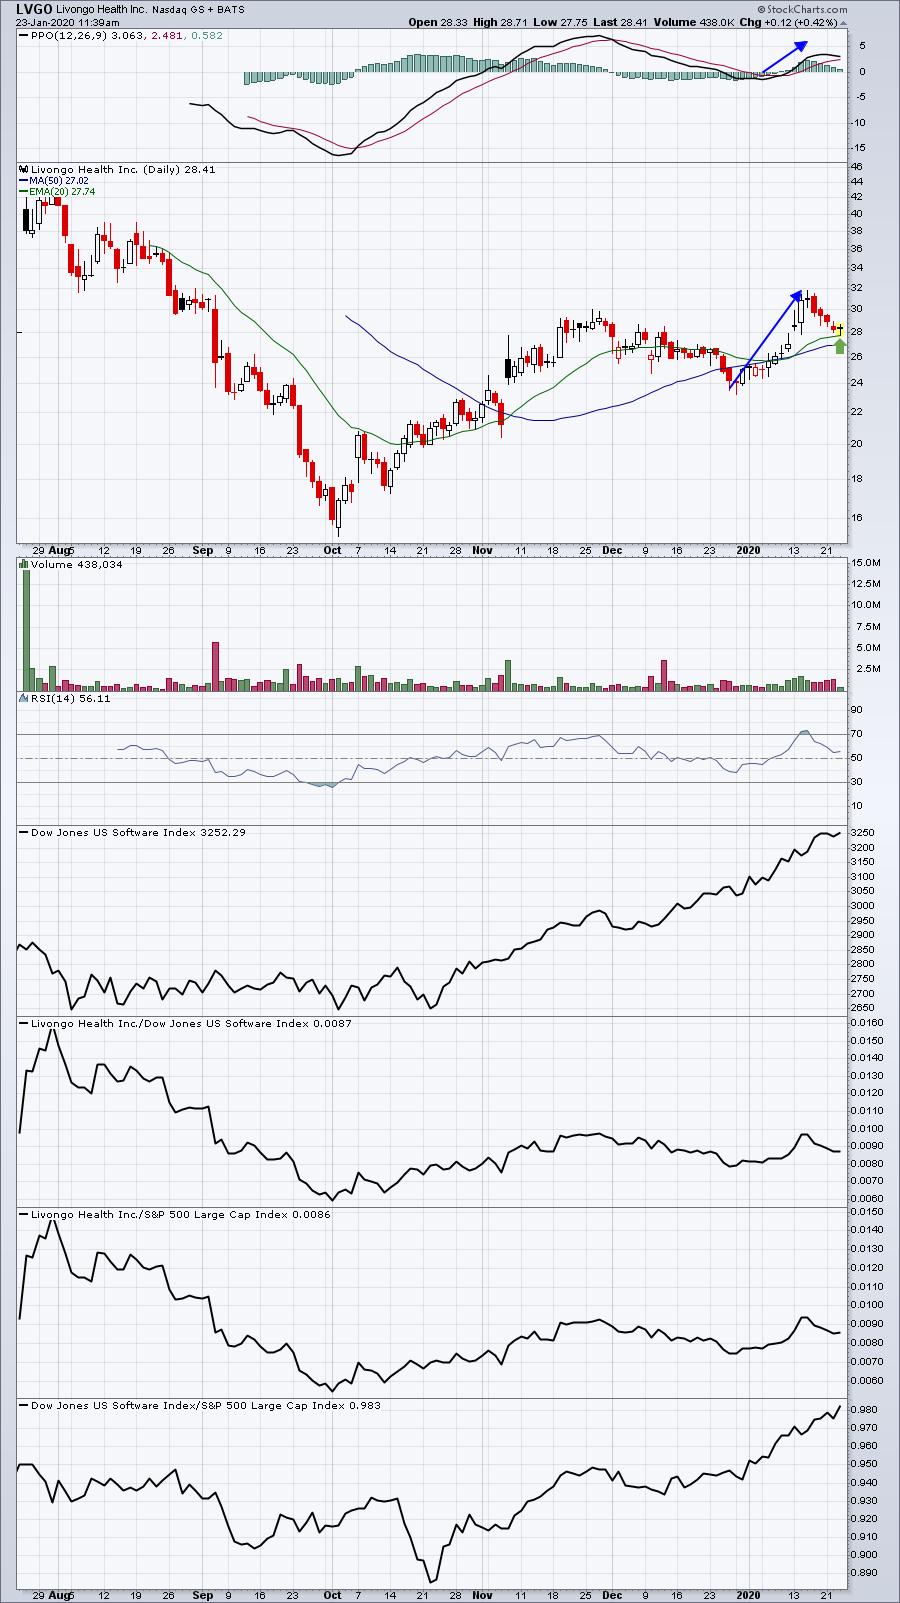
I would not make the mistake of comparing the price highs from November and those from last week. Between those two highs, the PPO "reset" at centerline support and the 50 day SMA was tested. Once either of those two technical conditions occur, I no longer look back to the prior high to evaluate current momentum. It's just the way I've learned to approach this type of chart, feel free to disagree.
SOGO:
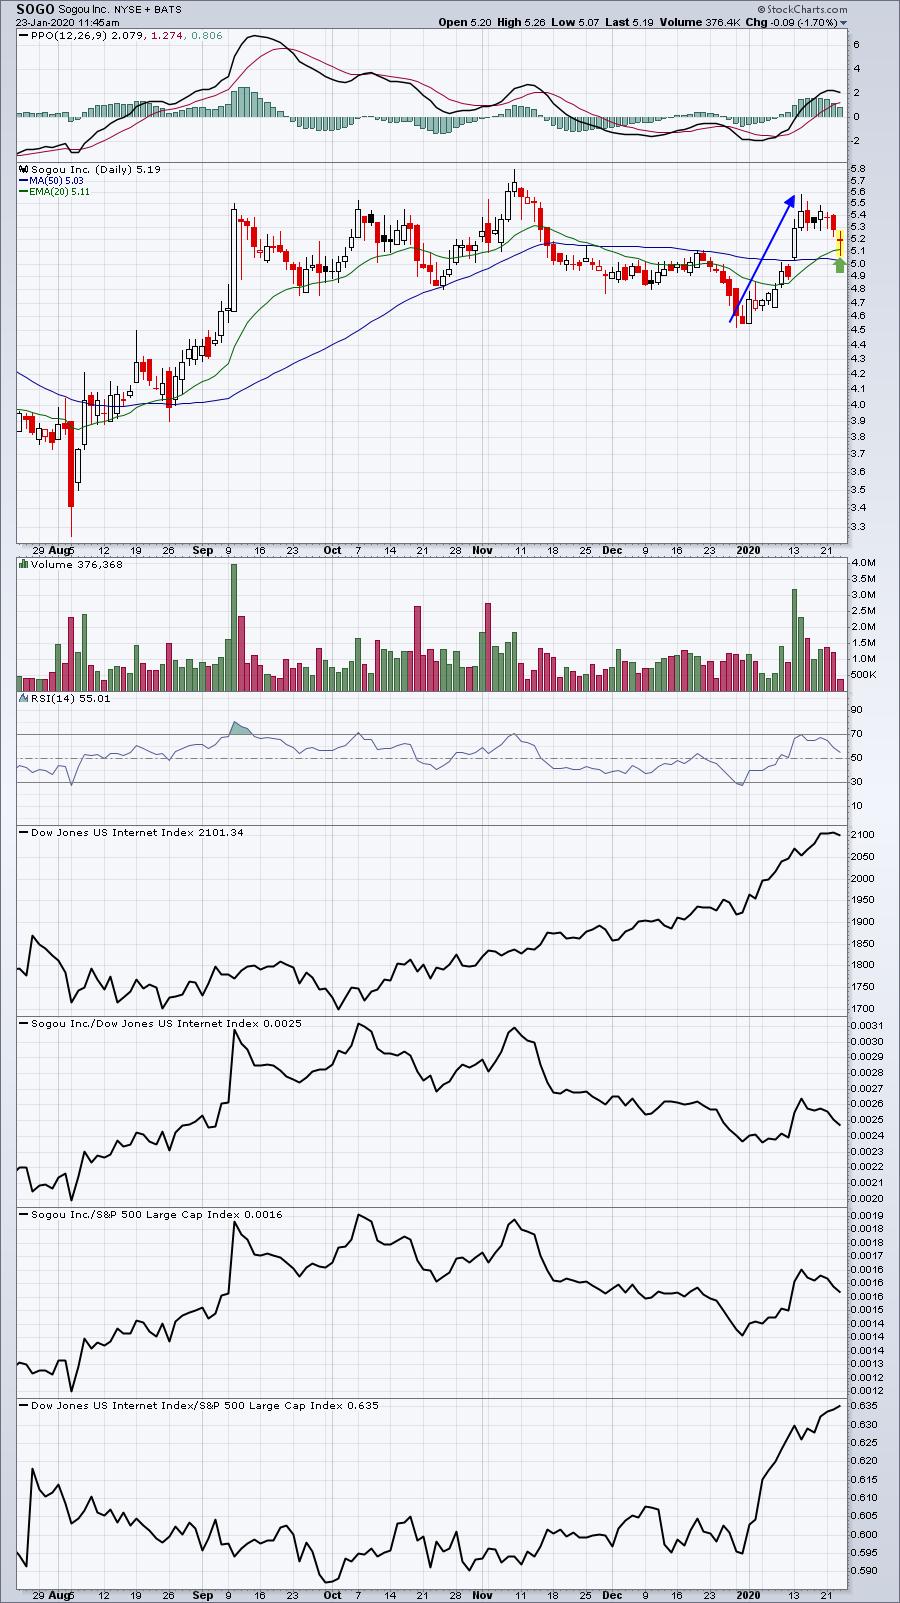
Today's pullback not only tested the rising 20 day EMA, but check out the January 13th action. SOGO gapped higher, opening at 5.05 and accelerating higher throughout the day on very heavy volume. Today's low of 5.07 nearly tested that gap support. Furthermore, check out SOGO's industry group - internet ($DJUSNS) - one of the hottest industry groups right now.
(Disclosure: I bought SOGO shares today, wanting to see that 5.05 gap support hold)
Movers & Shakers
I focused today on stocks selling off to see if any key price support levels are being tested/violated. Here are two I found interesting:
EW:
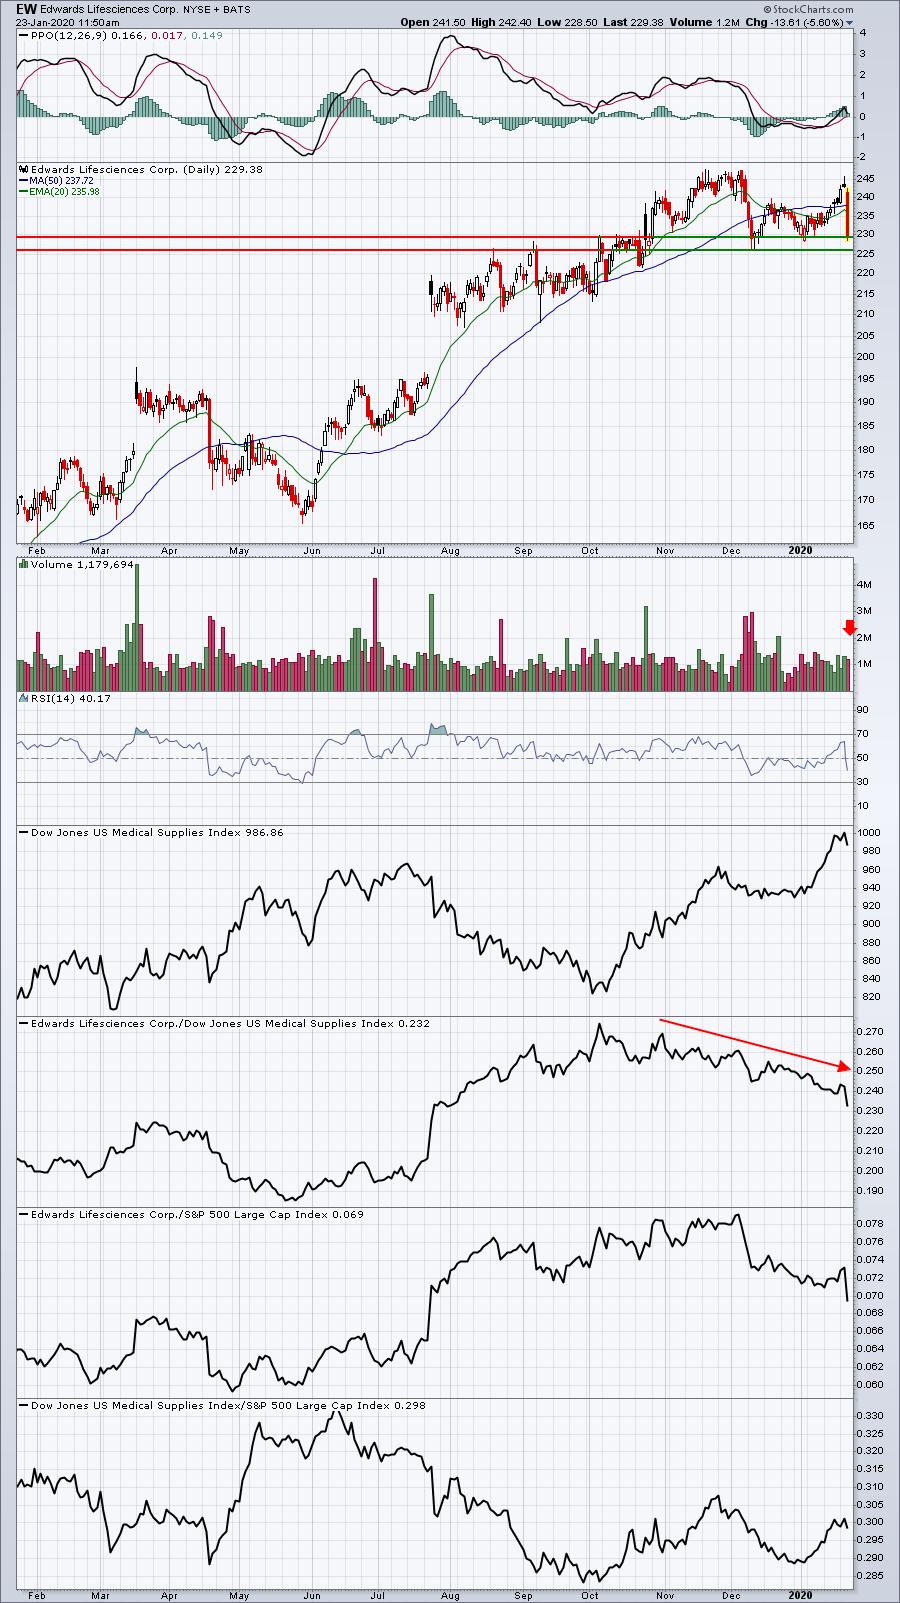
Medical supplies ($DJUSMS) has been a strong area of the market in January, but EW's relative strength among its medical supplies peers has been waning for 3-4 months (red directional line). 226-230 is a critical price support zone. If that's lost in addition to the relative weakness that's developed in the past few months, I'd have no further patience with the stock. However, a reversal in this area would obviously be much more bullish.
CMRE:
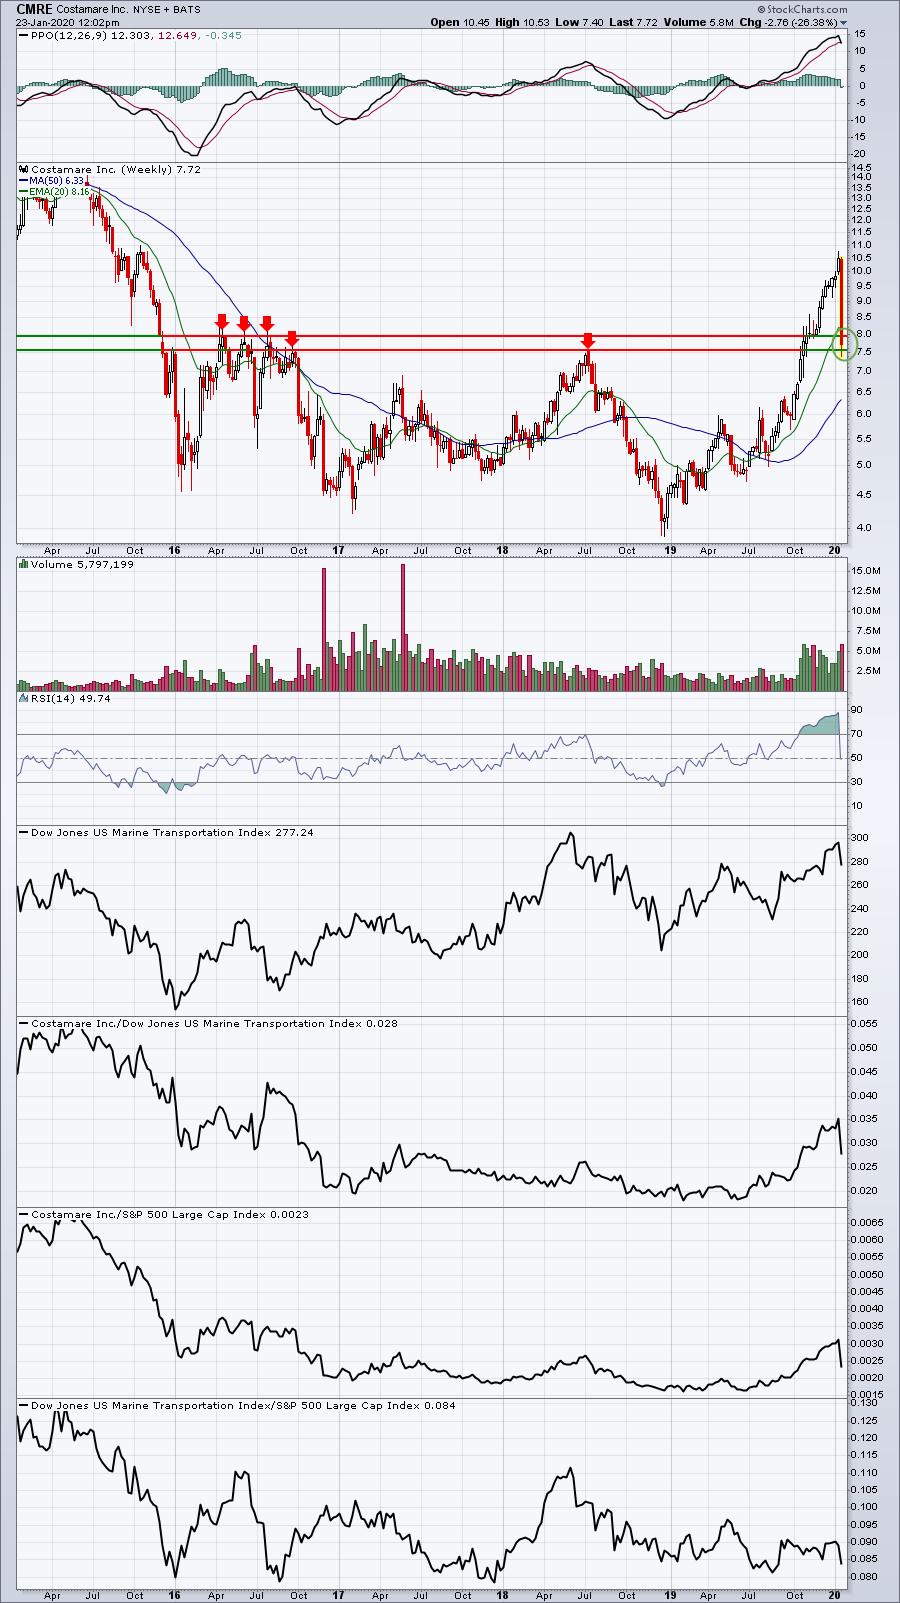
The move to the downside in CMRE this week has been swift, but it was extremely overbought. The above chart is a weekly chart and you can see that CMRE moved higher in unabated fashion for weeks upon weeks. So the first sign of selling spooks those buying at the top. A close tomorrow (end of week) back above that 20 week EMA could prove to be a significant short-term bottom. CMRE is obviously very volatile and not for everyone, but there's a large potential return to help offset the high risk for those with a much higher risk tolerance level.
Earnings Reports
Here are the key earnings reports for this week, featuring stocks with market caps of more than $10 billion. I also include a few select companies with market caps below $10 billion. Finally, any portfolio stocks (or active trade alerts) that will be reporting results are highlighted in BOLD. Please make sure you check for earnings dates for any companies you own or are considering owning:
Thursday, January 23:
PG, INTC, CMCSA, UNP, ISRG, KMB, VFC, TRV, LUV, DFS, STM, MTB, SWKS, KEY, FCX, TEAM, HBAN, SIVB, AAL, ETFC. Others less than $10 bil: JBLU, AVT, AVX, HTH
Friday, January 24:
NEE, AXP, APD, ERIC, SYF. Others less than $10 bil: HRC, SNV
Economic Reports
Initial jobless claims: 211,000 (actual) vs. 213,000 (estimate)
December leading indicators: -0.3% (actual) vs. -0.2% (estimate)
Happy trading!
Tom