
EB Daily Market Report - Thursday, January 30, 2020
Executive Market Summary
- Our major indices are under pressure once again, with small caps ($SML) lagging and down more than 1%
- Microsoft (MSFT) and Facebook (FB) reported quarterly results; MSFT is up 2%, while FB is down 6%
- Semiconductor shares ($DJUSSC) saw several huge earnings reports from the likes of LRCX, QRVO, and CRUS, yet are still down 1.4%; seems to be "buy on rumor, sell on news"
- Amazon.com (AMZN) reports after the bell and its relative strength suggests we could hear not-so-good news
- Q4 GDP hit consensus estimates at 2.1%; the 10 year treasury yield ($TNX) is down 5 basis points to 1.54%
- The huge bump in treasury prices is keeping a lid on equities right now
- We currently have no active trade alerts
Market Outlook
Imposing our will on the market never works. Trust me, the stock market is much stronger than we are. Rather than try to argue with it, it's a much better strategy to just agree with it. To give you an example, mid caps ($MID) just can't catch a break. It finally began to show some strength in mid-January, but a negative divergence formed and we've seen selling nearly every day since:
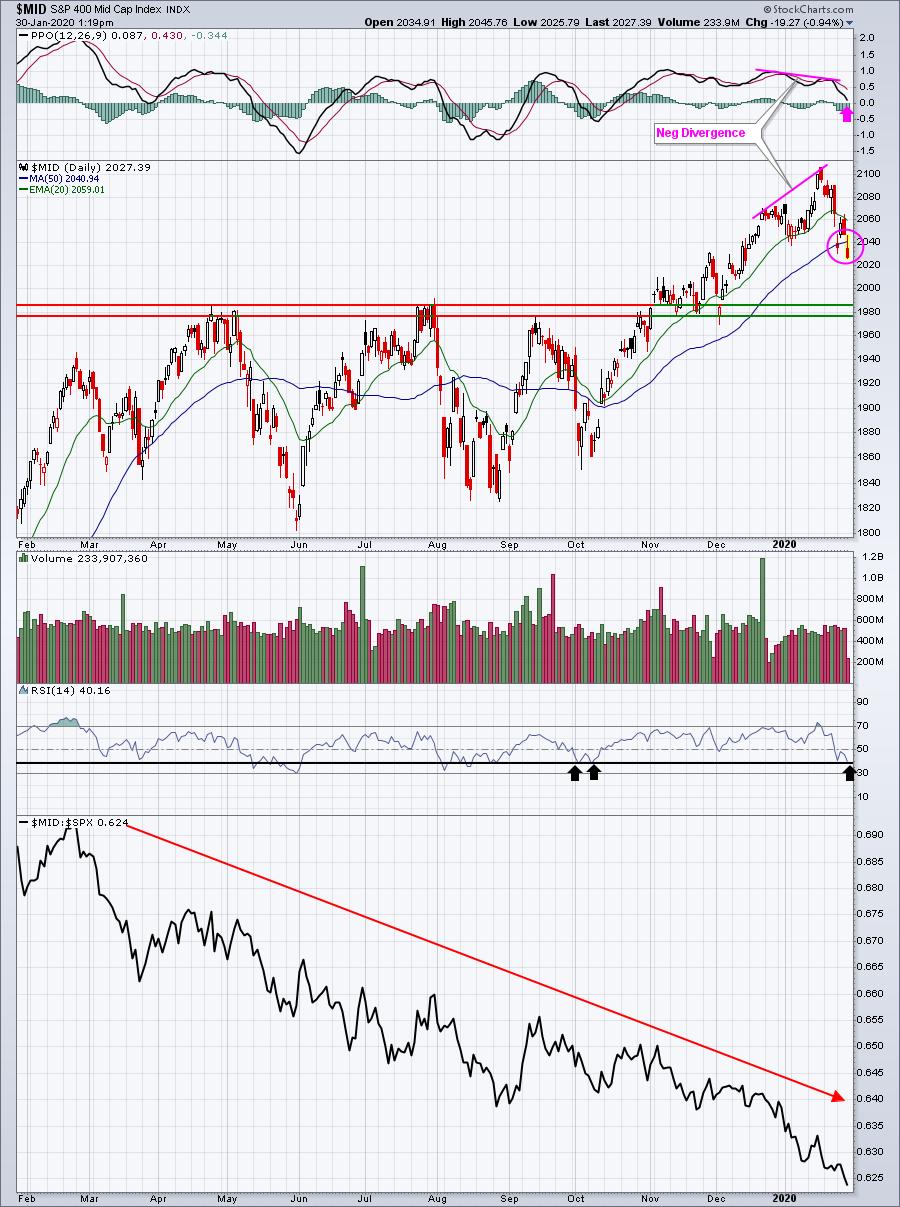
After I see a negative divergence, I typically look for PPO centerline and/or 50 day SMA tests. The pink arrow and pink circle highlight this result. RSI is now at 40, which is where we typically see a rebound in an uptrending chart. The problem, however, is that even when we've reached this level and bounced in the past, we've still underperformed the benchmark S&P 500.
We will likely soon begin a lengthy period of outperformance in both small and mid cap stocks, but it certainly hasn't started yet. Traders seem to like the reliability of earnings growth among the largest U.S. companies.
Sector/Industry Focus
The stock market is lower today and that typically results in leadership from defensive sectors. Right on cue, defensive sectors are shining today - at least on a relative basis:
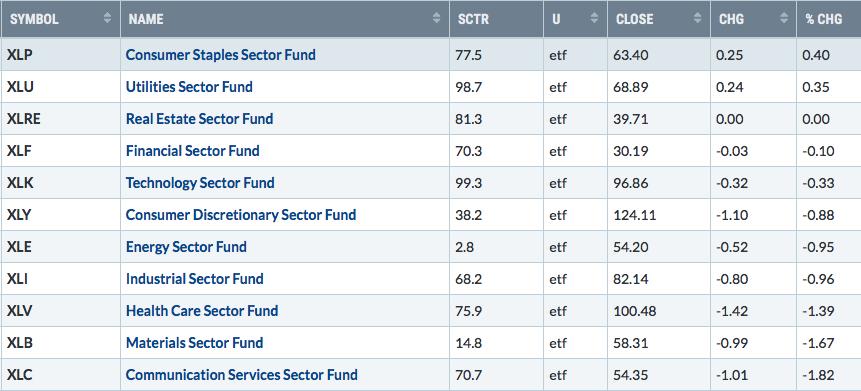
Communication services (XLC) is being weighed down by internet shares ($DJUSNS, -2.84%), especially Facebook (FB, -6.31%) after the tech giant suggested that its growth rate was likely to slow.
Active Trade Alerts
We have no active alerts right now. I think it continues to make sense to be patient, at least for now.
Strong Earnings ChartList (SECL)
Our SECL now comprises just 129 charts, but that number will definitely grow over the course of the next 2-3 weeks. Based on the number of positive reports I'm seeing, I believe our SECL will rise above 400 this quarter for the first time in our history of tracking earnings reports. Earnings are strong and solid earnings growth in a historically-low interest rate environment, along with a more accommodative Fed, spells higher prices ahead. Those companies reporting solid numbers earn the trust of Wall Street and, quite honestly, investors will pay up for earnings growth in a market environment where your alternative is to yield 1.6% in a 10 year treasury.
I want to point out that SWKS is on our SECL twice (chart #4687 and chart #4801). This happens occasionally when a company reports 2 1/2 months apart (as SWKS did) instead of the standard 3 months. SWKS reported earnings November 11th, which would have suggested an earnings report this quarter around February 11th. Instead, SWKS reported last week. I quickly glanced through the remainder of the SECL and didn't see any other duplicates, but I wanted to explain how that can happen.
I think it still remains wise to lessen trading activity right now. I firmly believe the S&P 500 is going higher in 2020, but we've run a long way in a short time and could use a pause. Trading in a sideways to down market can get very frustrating. Small caps ($SML) and mid caps ($MID) have really been trounced the past two weeks, so if you're noticing many smaller companies underperforming, that's a big reason why. I've highlighted the relative weakness of the $MID vs. the $SPX above. I'd be a little patient here.
Movers & Shakers
I reviewed breakouts again today and found the following home construction stocks ($DJUSHB) interesting:
BZH:
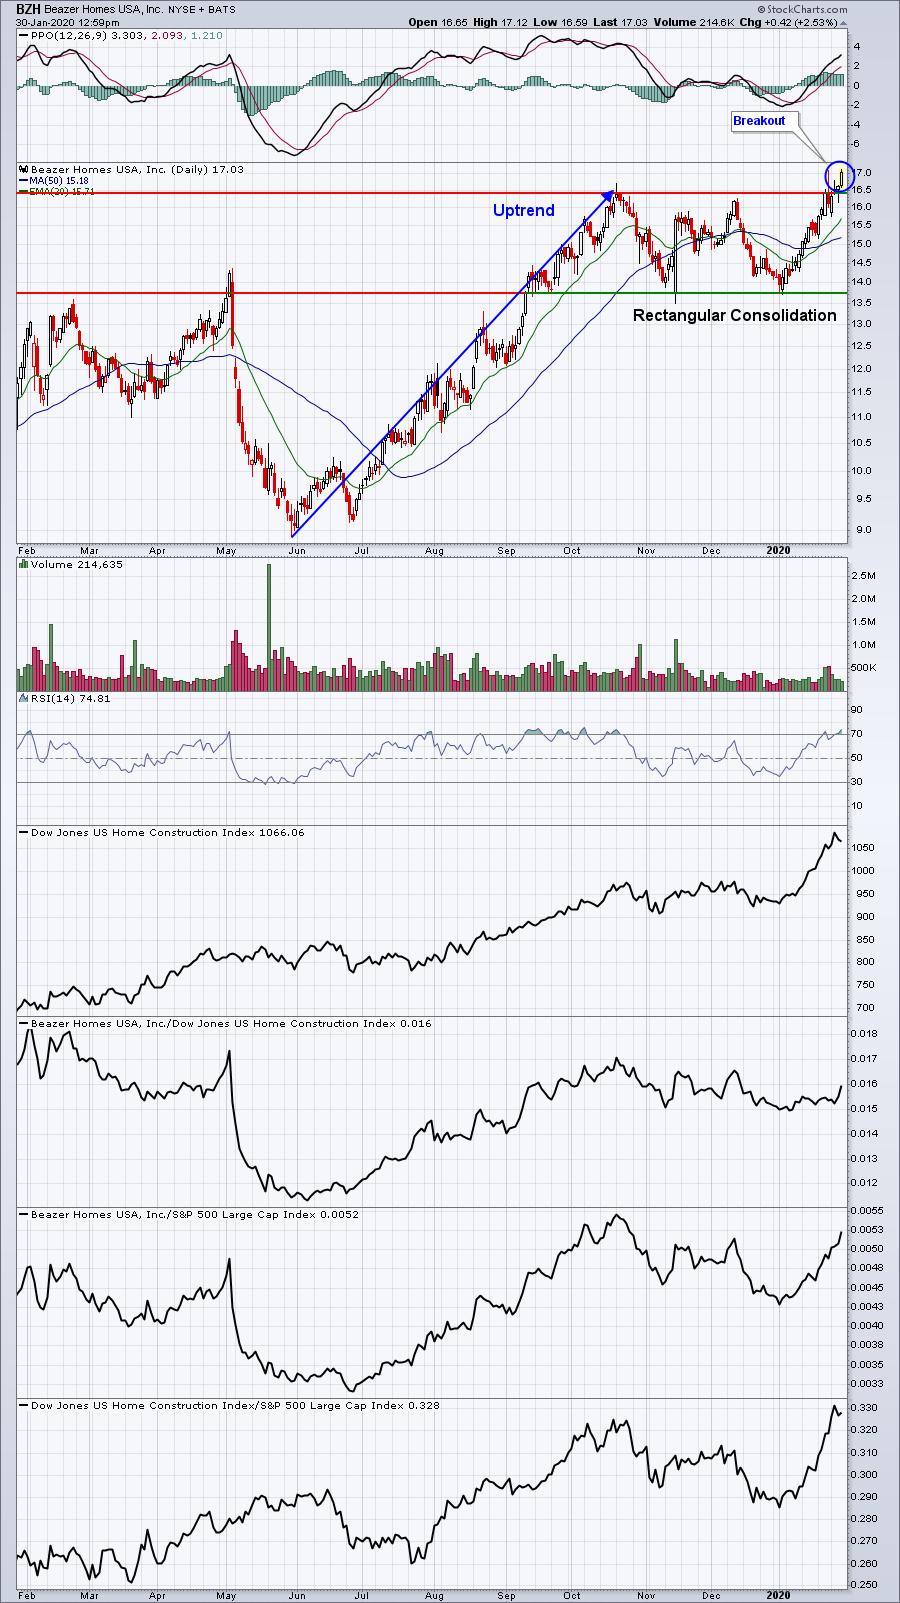
The breakout is nice, but I'd like to see more volume accompany this move. It certainly doesn't appear to be institutional buying and relative strength has been drifting lower for three months.
MDC:
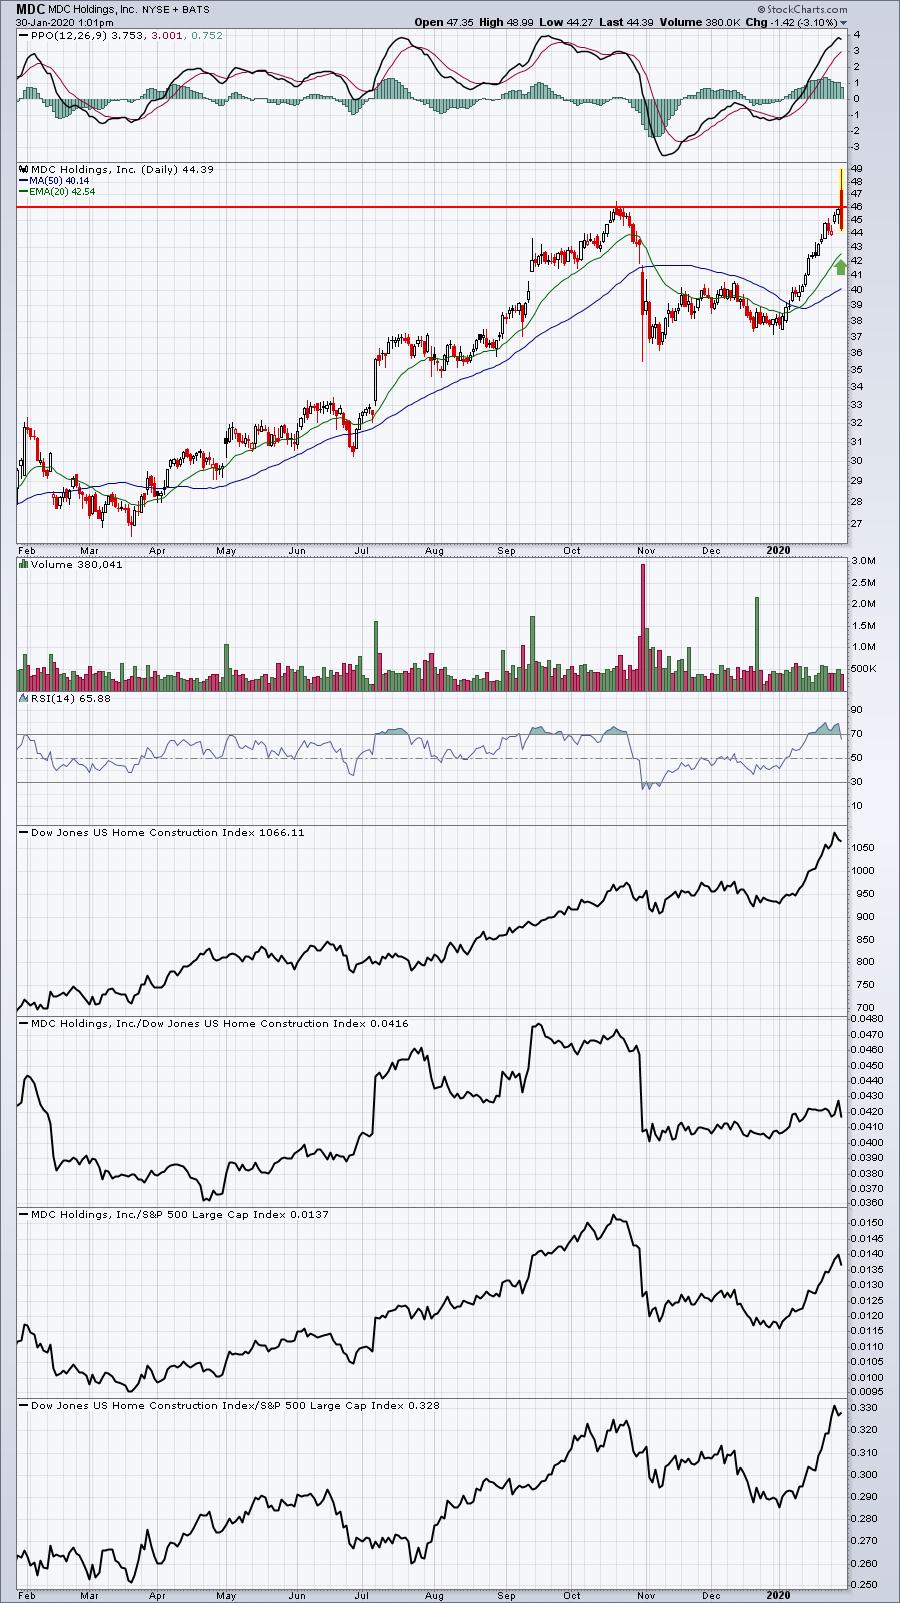
That is quite a reversing candle today after MDC reported EPS this morning that crushed estimates, $1.42 vs. $1.24. Revenues also topped expectations, $1.10 bil vs. $1.09 bil. Nonetheless, that bearish engulfing candle looks rather ominous, barring a big change by the close today. Relative strength is problematic as well. Hhhhmmmm....
Earnings Reports
Here are the key earnings reports for this week, featuring stocks with market caps of more than $10 billion. I also include a few select companies with market caps below $10 billion. Finally, any portfolio stocks (or active trade alerts) that will be reporting results are highlighted in BOLD. Please make sure you check for earnings dates for any companies you own or are considering owning:
Thursday, January 30:
AMZN, V, VZ, KO, RDS.A, AMGN, LLY, TMO, DHR, UPS, MO, NOC, RTN, EPD, VRTX, MMC, SHW, BIIB, EW, DD, TFC, BX, ROP, TOELY, VLO, XEL, EA, HSY, WEC, PH, ALXN, MSCI, APTV, RMD, NOK, CTVA, WDC, CMS, ABC, AJG, GWW, IP, AMCR, DOV, MMP, DGX, CE, BEN, OTEX, FICO, APO, TSCO, WRK, CPT, EMN. Others less than $10 bil: CY, RHI, PFPT, DECK, MUR
Friday, January 31:
XOM, CVX, HON, CHTR, CAT, CL, ITW, AON, PSX, JCI, LYB, IDXX, WY, IMO, CHD, KKR, BR, PSXP, BAH. Others less than $10 bil: GNTX, BERY, MAN
Economic Reports
Q4 GDP: +2.1% (actual) vs. +2.1% (estimate)
Initial jobless claims: 216,000 (actual) vs. 215,000 (estimate)
Happy trading!
Tom