
EB Daily Market Report - Monday, February 3, 2020
ChartList Links
We had a Saturday webinar where a new StockCharts Shared ChartList feature was explained. If you're a StockCharts.com Extra member or above, we can now send a link and password to any of our ChartLists. If you're not a StockCharts.com member, you can still view all the charts, you just won't be able to save them. We've already sent our Strong Earnings ChartList to members (and we even sent this ChartList to our entire EarningsBeats.com community, including EB Digest subscribers, so they could experience the benefits of our fundamental and technical research).
In addition to discussing this new ChartList sharing feature, I discussed "Q4 Earnings Predictions - Bullish" and "Q4 Earnings Predictions - Bearish". There were 47 bullish predictions and 40 bearish predictions for companies reporting their quarterly results this week. If you'd like to download the ChartLists into your StockCharts.com account, here are the links and passwords:
Q4 Earnings Predictions - Bullish:
Password: Q4Bull
Q4 Earnings Predictions - Bearish:
Password: Q4Bear
Executive Market Summary
- Our major indices are all higher today, recovering from Friday's big selloff
- The good news is that aggressive sectors are leading today's action
- Technology (XLK, +1.37%) and consumer discretionary (XLY, +1.36%) are battling for top spot
- Energy (XLE, -1.42%) is the only sector that's lower and weakness there could change soon - see Market Outlook and Sector/Industry Focus below for details
- Tesla (TSLA, +11.73%) continues its eye-popping advance
- Manufacturing data came in much stronger than expected with ISM manufacturing moving back above 50
- We currently have no active trade alerts
Market Outlook
I suspect the drop in the U.S. Dollar Index ($USD) from late last week has only just begun. Treasury yields here in the U.S. continue to drop vs. those in Germany and that normally results in a weakening dollar. Check out this chart:
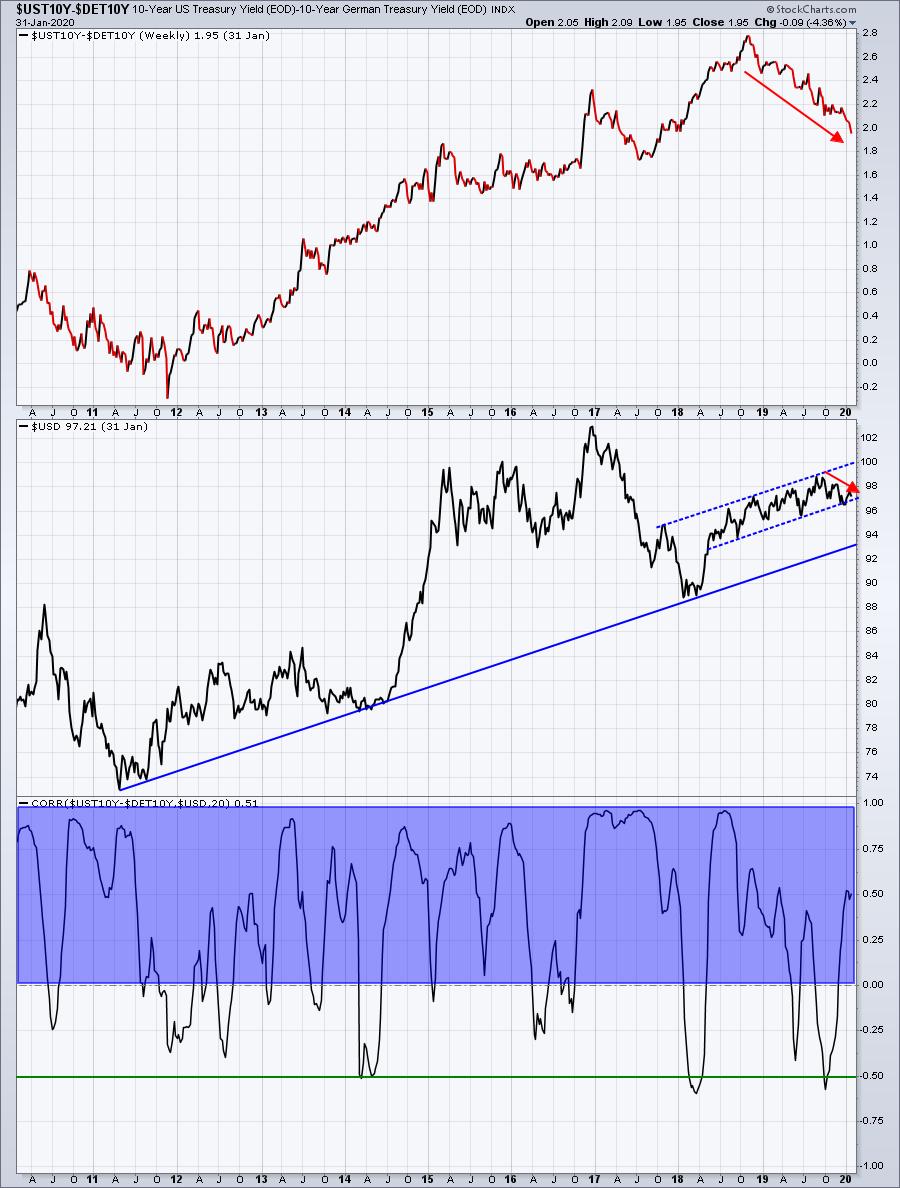
The relationship of our treasury yields vs. Germany's suggests the dollar is about to take a major turn to the downside. If it does, it'll set up a potential short-term trade in materials (XLB) and energy (XLE). Check out the Sector/Industry Focus below.
Sector/Industry Focus
While the dollar has rallied over the past month, check out what sectors have been lagging:
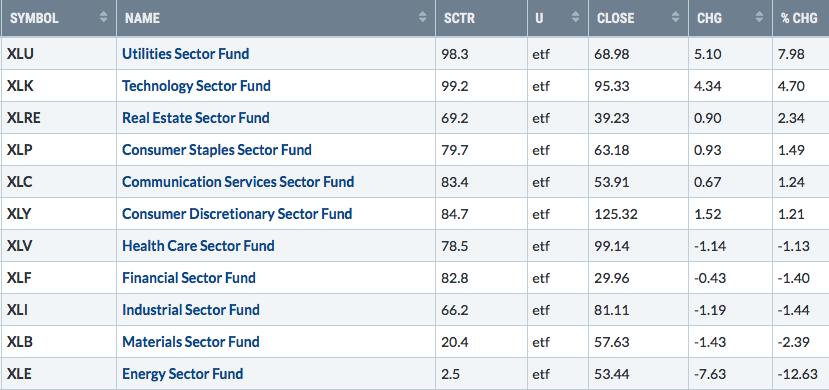
Right at the bottom, you can see the XLB and the XLE. Well, if the dollar weakens, as I expect it to, look for a return of relative strength to both of these groups. Here's the chart to watch:
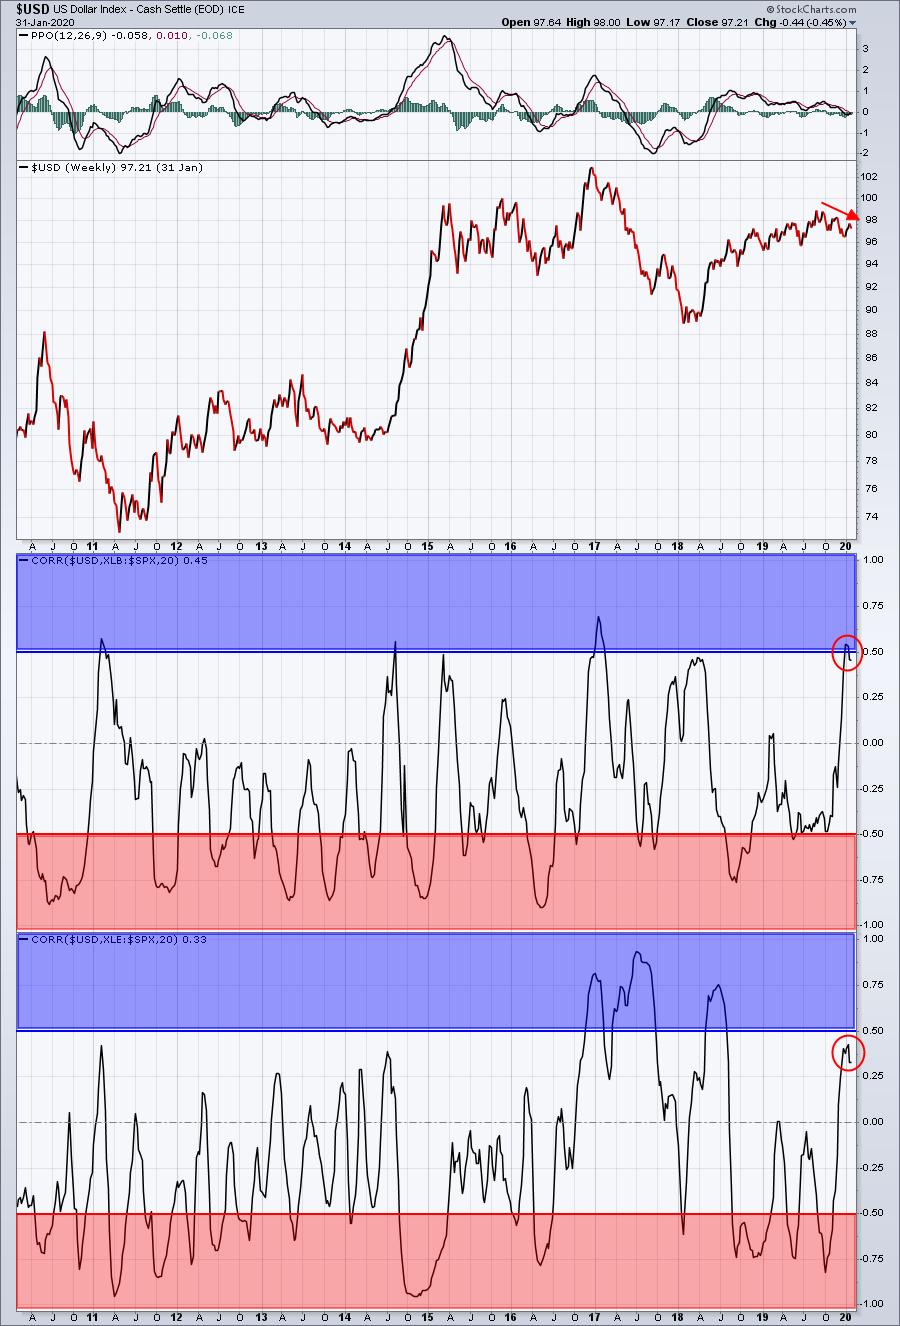
You can see that the dollar's relationship to the relative strength of both materials and energy is an inverse one. Therefore, if dollar weakness continues, we should expect both materials and energy, especially the latter, to regain relative strength.
Active Trade Alerts
We have no active alerts right now. I like several of the semiconductors right now, but given the uncertainty of the short-term market action, I'm holding off. If you want to take a chance or two, you might consider either TER or QRVO, both of which are highlighted below.
Strong Earnings ChartList (SECL)
Many time, I'll check out what's NOT working today on the SECL to see if any opportunities are presenting. For instance, if I view the SECL in Summary form and then sort it beginning with the worst percentage gain loser, here's what we see as of 11:05am EST:
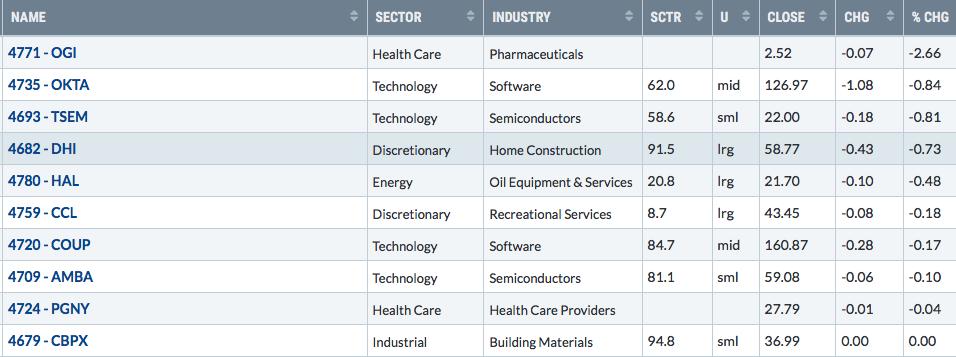
119 of the 129 stocks on the SECL are higher this morning. Just the 10 listed above were either breakeven or are down for the session. Here is one chart to consider given the idea that energy could begin to outperform:
HAL:
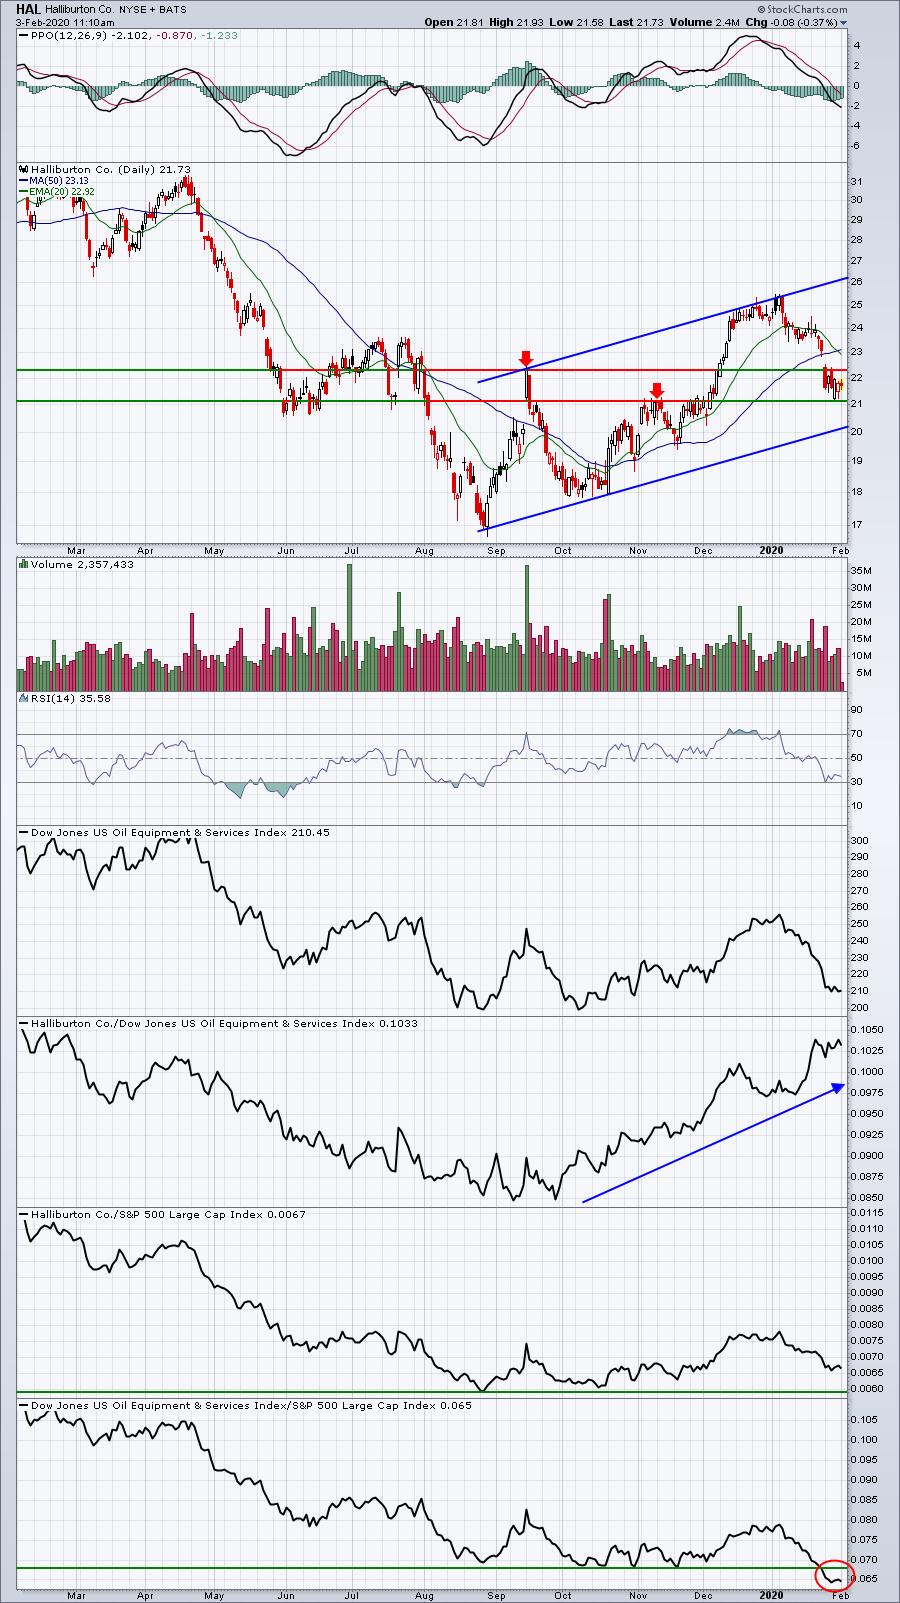
Over the past 4 months, HAL has been CRUSHING its industry peers. It looks to me like a bullish channel is in play here and we're moving closer and closer to the bottom channel line, which would be the best reward to risk entry. We're also in a price support zone right now. Given the likelihood that the U.S. dollar has begun another downtrend, energy shares could snap back quickly and HAL is a relative leader.
Movers & Shakers
Here are a few big names testing key levels:
DIS:
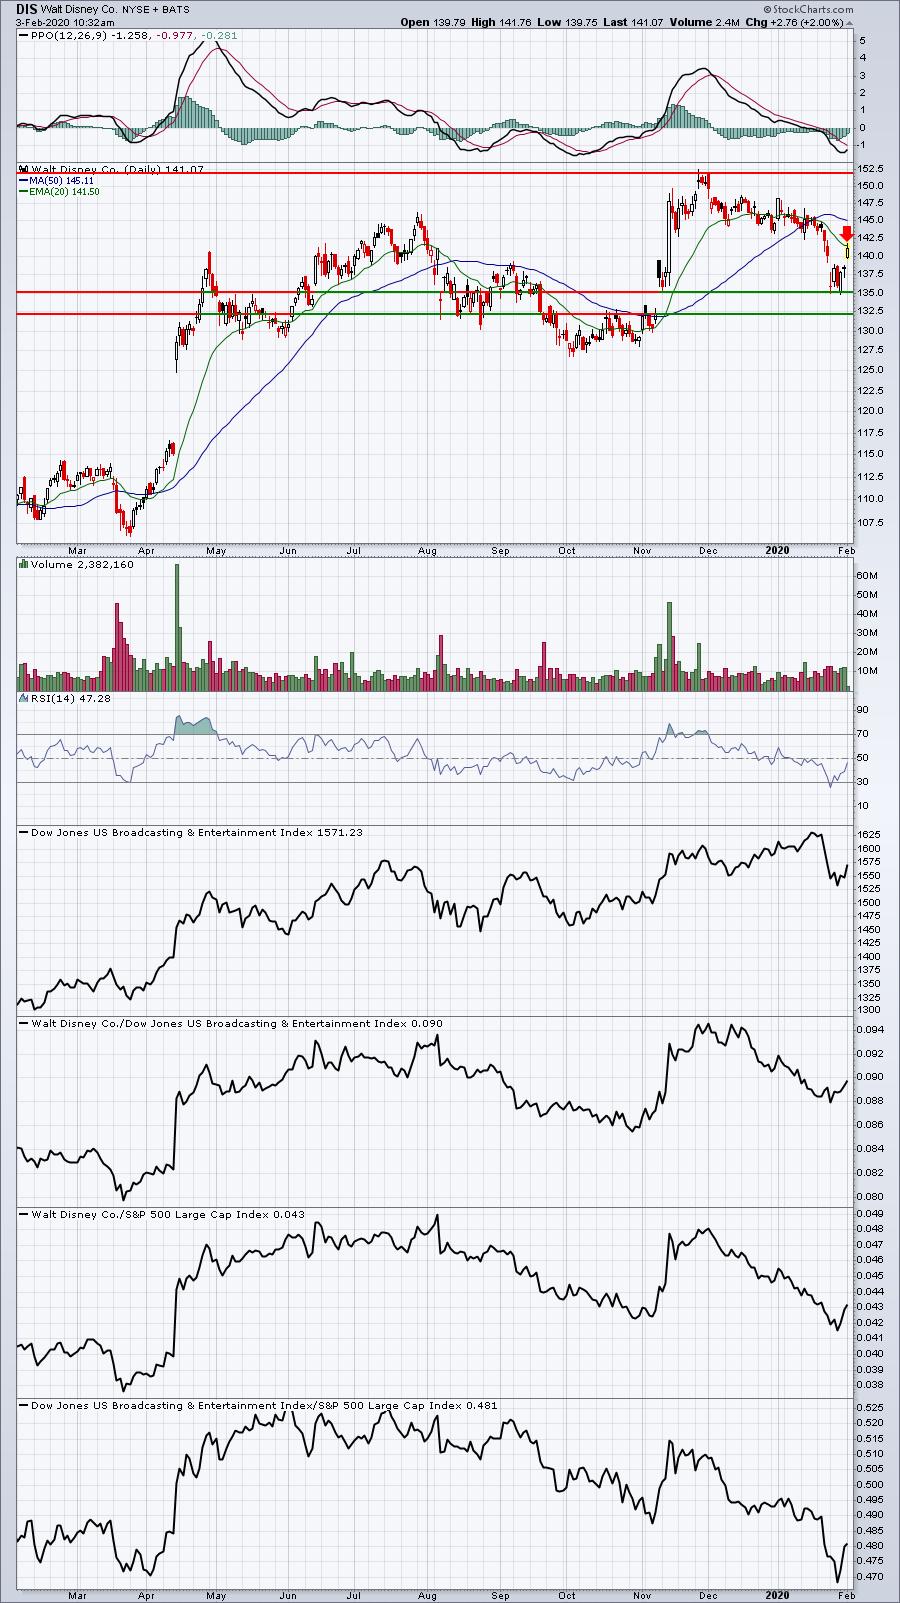
DIS will be reporting earnings tomorrow so anything goes, but it's worth mentioning that it's bouncing today to test its 20 day EMA. The safe play is to exit here, if you own it, to see what happens with its earnings report. Relative strength is not great for broadcasting & entertainment ($DJUSBC) vs. the S&P 500, but the relative strength of DIS vs. its peers is simply mediocre at this point. It's really a coin toss technically as to which way DIS trades after its earnings report. I'd ordinarily give it the benefit of the doubt and guess higher after earnings, but will they discuss an impact to next quarter as a result of the coronavirus? That's the wild card.
NOC:
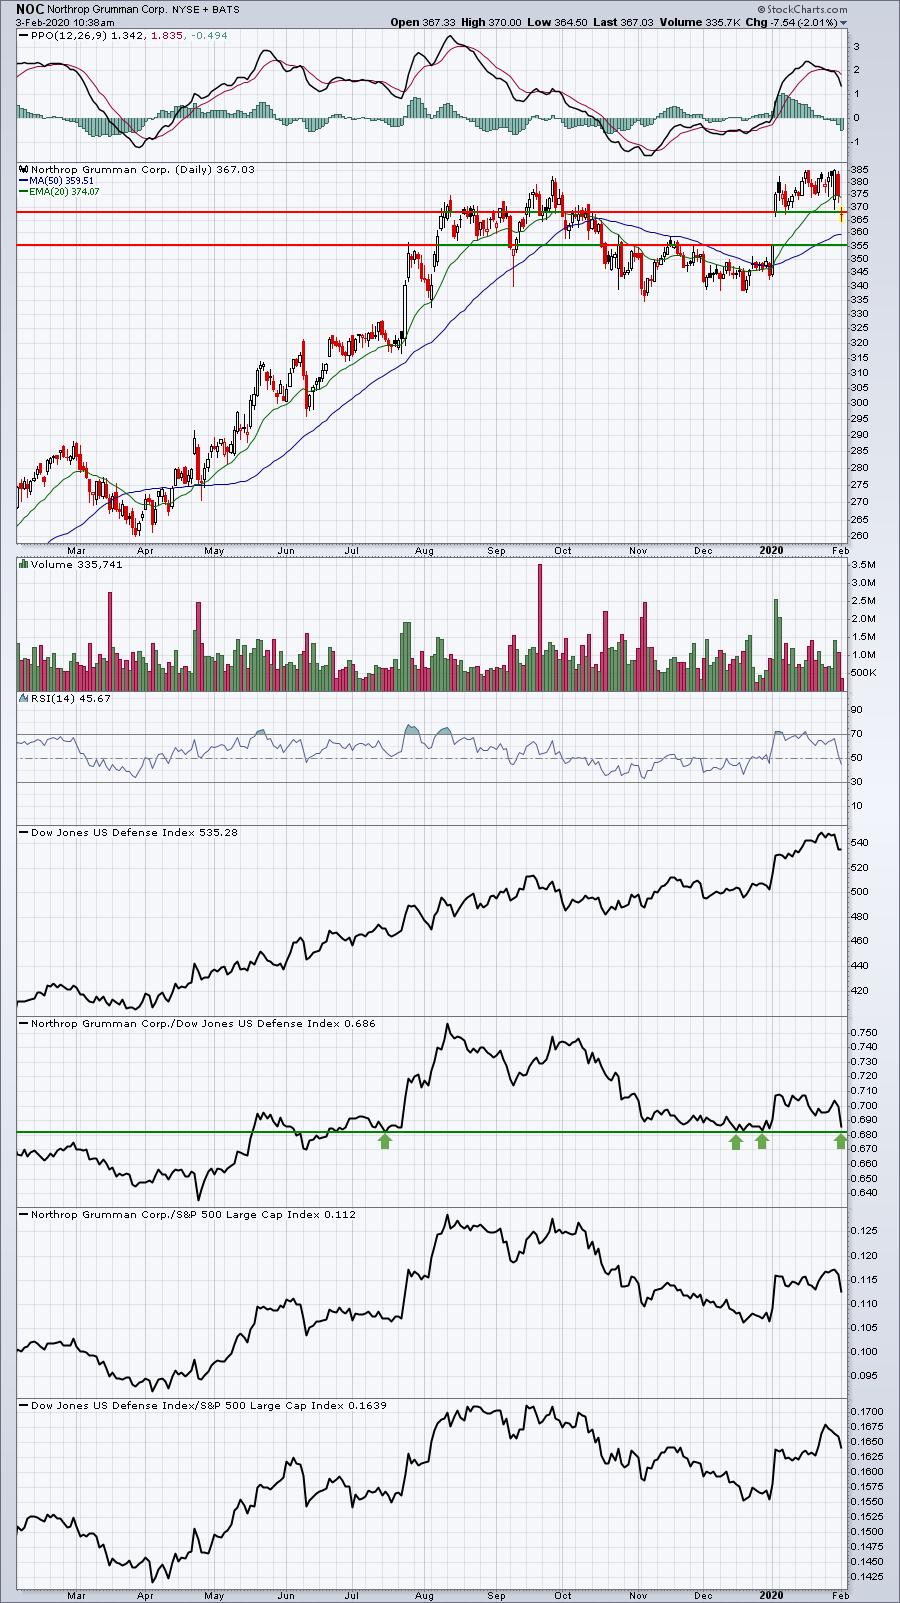
The NOC chart is beginning to look suspicious. Today, the defense industry ($DJUSDN) is flat, while NOC moves down after a downgrade. If it had great relative strength vs. defense peers, I'd consider the downgrade an opportunity, but that's not the case. NOC hit a relative high in August and has seen a relative downtrend ever since. I'd be very careful if the relative support line is broken.
Earnings Reports
Here are the key earnings reports for this week, featuring stocks with market caps of more than $10 billion. I also include a few select companies with market caps below $10 billion. Finally, any portfolio stocks (or active trade alerts) that will be reporting results are highlighted in BOLD. Please make sure you check for earnings dates for any companies you own or are considering owning:
Monday, February 3:
GOOGL, SYY, NXPI, IX, HIG, ARE, CHKP. Others less than $10 bil: ON, CTLT, ACM
Tuesday, February 4:
DIS, BP, FISV, GILD, CB, COP, LHX, EMR, SPG, ETN, AFL, ALL, PRU, F, TDG, RACE, SIRI, ZBH, KLAC, MCK, SNAP, CNC, CMI, RCL, CMG, MCHP, CERN, MTCH, CLX, MKL, STX, WAT, IT, ATO, J, PAA, JKHY, GL, ARMK, CCK. Others less than $10 bil: DOX, NBIX, RL, PCTY, ENTG, UNM, MANH, IPHI, VIAV, BOOT
Wednesday, February 5:
MRK, NVO, GSK, QCOM, BBD, BSX, SU, GM, MET, HUM, CTSH, ORLY, AVB, IFNNY, SPOT, DTE, FOXA, AME, IAC, PAYC, CINF, TWLO, BAP, YUMC, FMC, LNC, CDAY. Others less than $10 bil: PTON, NUAN, GRUB, FEYE, RAMP
Thursday, February 6:
PM, SNY, BMY, BDX, CI, SPGI, EL, UBER, ICE, ATVI, DASTY, BIDU, BCE, REGN, YUM, TSN, MSI, FLT, WLTW, FCAU, TWTR, FTV, VRSN, BLL, K, FTNT, CDW, MTD, SGEN, NLOK, IQ, ODFL, CAH, MT, XYL, TTWO, WYNN, ALNY, PINS, MPW. Others less than $10 bil: ZEN, SNA, DXC, TPR, DNKN, SKX, HBI, SYNA
Friday, February 7:
ABBV, HMC, CBOE, CNHI, AVTR. Others less than $10 bil: CAE, GOOS, CCJ
Economic Reports
January PMI manufacturing index: 51.9 (actual) vs. 51.7 (estimate)
January ISM manufacturing index: 50.9 (actual) vs. 48.7 (estimate)
December construction spending: -0.2% (actual) vs. +0.5% (estimate)
Happy trading!
Tom