
EB Daily Market Report - Tuesday, February 4, 2020
ChartList Links
Yesterday, I shared the following ChartLists in the DMR. I'll provide them one more time, but you should also be aware that we have a ChartLists section of our website where you can find these links (and potentially others). Here's the area on our website:
https://www.earningsbeats.com/members/candidate-tracker.cfm
Q4 Earnings Predictions - Bullish:
Password: Q4Bull
Q4 Earnings Predictions - Bearish:
Password: Q4Bear
Executive Market Summary
- U.S. stocks jumped higher out of the gate today with the NASDAQ providing leadership once again
- All of our major indices are higher by at least 1.5%
- Sector leadership could not be much stronger as technology (XLK, +2.61%) and industrials (XLI, +2.00%) lead
- Utilities (XLU), a defensive sector, is the only sector in negative territory
- Automobiles ($DJUSAU) are soaring as Tesla (TSLA, +16.80%) surges higher
- Most industry groups are participating in this rally, a very bullish signal
- We currently have no active trade alerts
Market Outlook
Is the move lower in the S&P 500 over? That's the million dollar question. I believe this rally is partly because of money flows. New money from 401k's, pension funds, etc. generally sends the stock market higher the first week of calendar months and that could be what we're seeing right now. Consolidation can take lots of different shapes and sizes, so it's really difficult to predict when a bout of selling is over. The most obvious signal that it's ended is when we see new all-time highs print. I do find it interesting that the S&P 500 found solid support at the price support line that I provided a little more than a week ago:
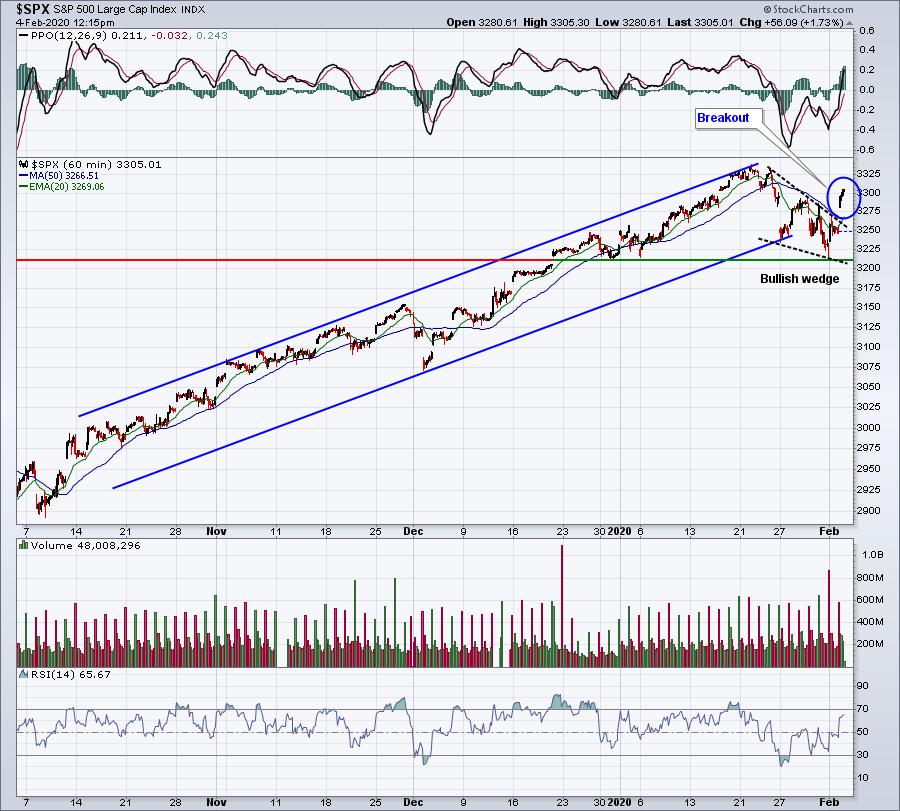
A bullish argument could be made that price support has been tested in an A-B-C correction and today's gap higher is a very bullish breakout from the bullish wedge that had printed. But again, until we see new highs, this could be the makings of sideways consolidation with key resistance (recent high) and key support now well-defined (Friday's low).
My approach is this. I don't think it's a great idea during a secular bull market to nitpick whether we're going to pull back 3% or 5% or 7%. I'd use weakness to at least begin accumulating your favorite stocks, hopefully those that are relative strength leaders. If we see our major indices break to new highs, I'd be prepared to buy remaining shares on such a breakout - unless clear warning signs suggest that rally won't last. It would be important to check equity only put call ratios, the VIX, sector leadership, etc. to evaluate potential warning signs.
Sector/Industry Focus
There are a lot of long-term gold bulls out there, but I'm definitely not among that crowd. Yes, gold usually gets a lift any time that dollar ($USD) weakens and I wouldn't be surprised to see a weaker dollar during Q1 2020. And gold also gets a lift when markets grow in volatility. But I believe we're still in the early stages of a lengthy two decade secular bull market that could last into the 2030s. When stocks are the investment of choice, gold usually is not. The following relative chart of the GLD:SPY should help to illustrate this:
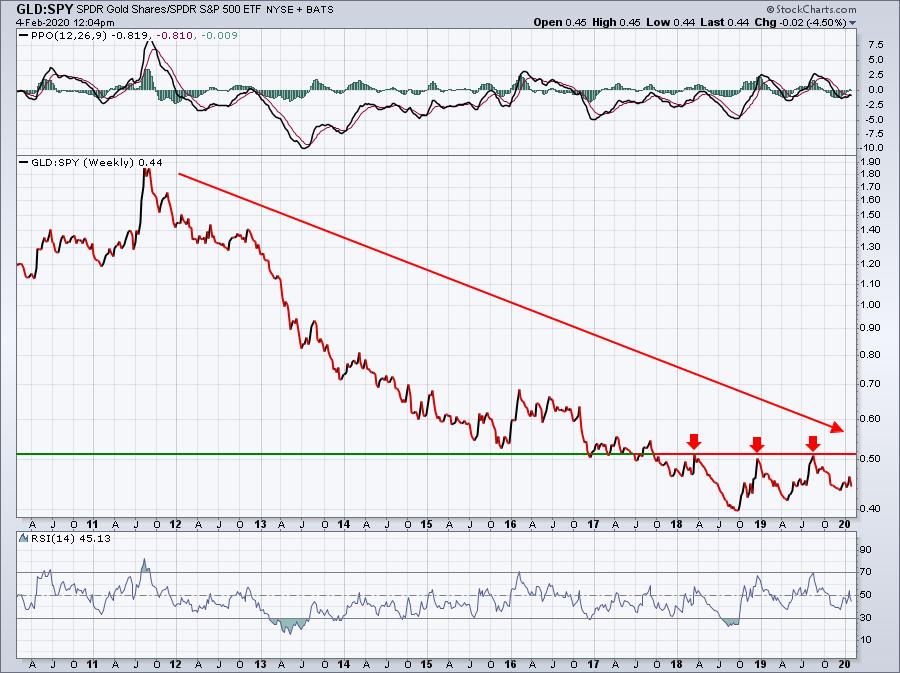
There's definitely a dollar effect to the above chart. But even if the dollar does fall, I have my doubts that we'll see GLD breakout above the GLD:SPY relative price resistance line. Remember, my goal is to outperform the benchmark S&P 500. Any investment in GLD over the past several years really puts pressure on the balance of your portfolio. As Warren Buffett famously said, "diversification is protection against ignorance".
Active Trade Alerts
Currently, we have no active trade alerts. Please do not assume that we wouldn't trade on the long side and that we'd suggest 100% cash simply because we have no trade alerts out. As I've stated on previous occasions, we do not use trade alerts to help manage a portfolio. We use them for educational purposes, walking everyone through a specific trade, discussing targets, stops, and what we're seeing on the charts throughout an active trade. It's much more of a process that highlights our trading strategy, how we think our way through a trade, and why we make certain decisions, like raising a stop in the middle of a trade.
I'm sure we'll have another active trade out shortly.
Strong Earnings ChartList (SECL)
I ran a scan of our 129 SECL stocks to find those hitting fresh 52 week highs today. There were 11 and here's the list:
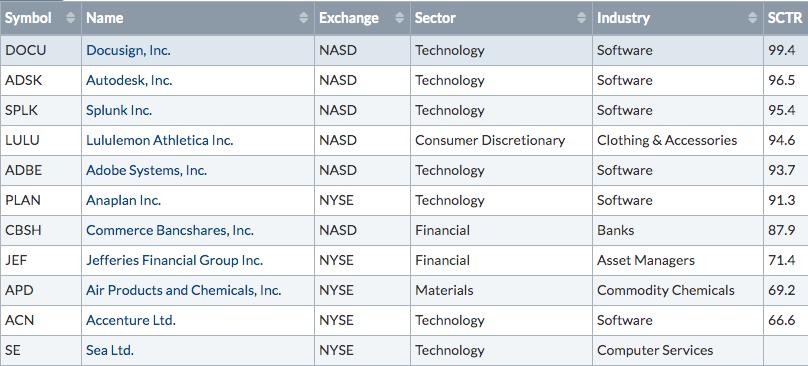
Here are two that caught my eye:
PLAN:
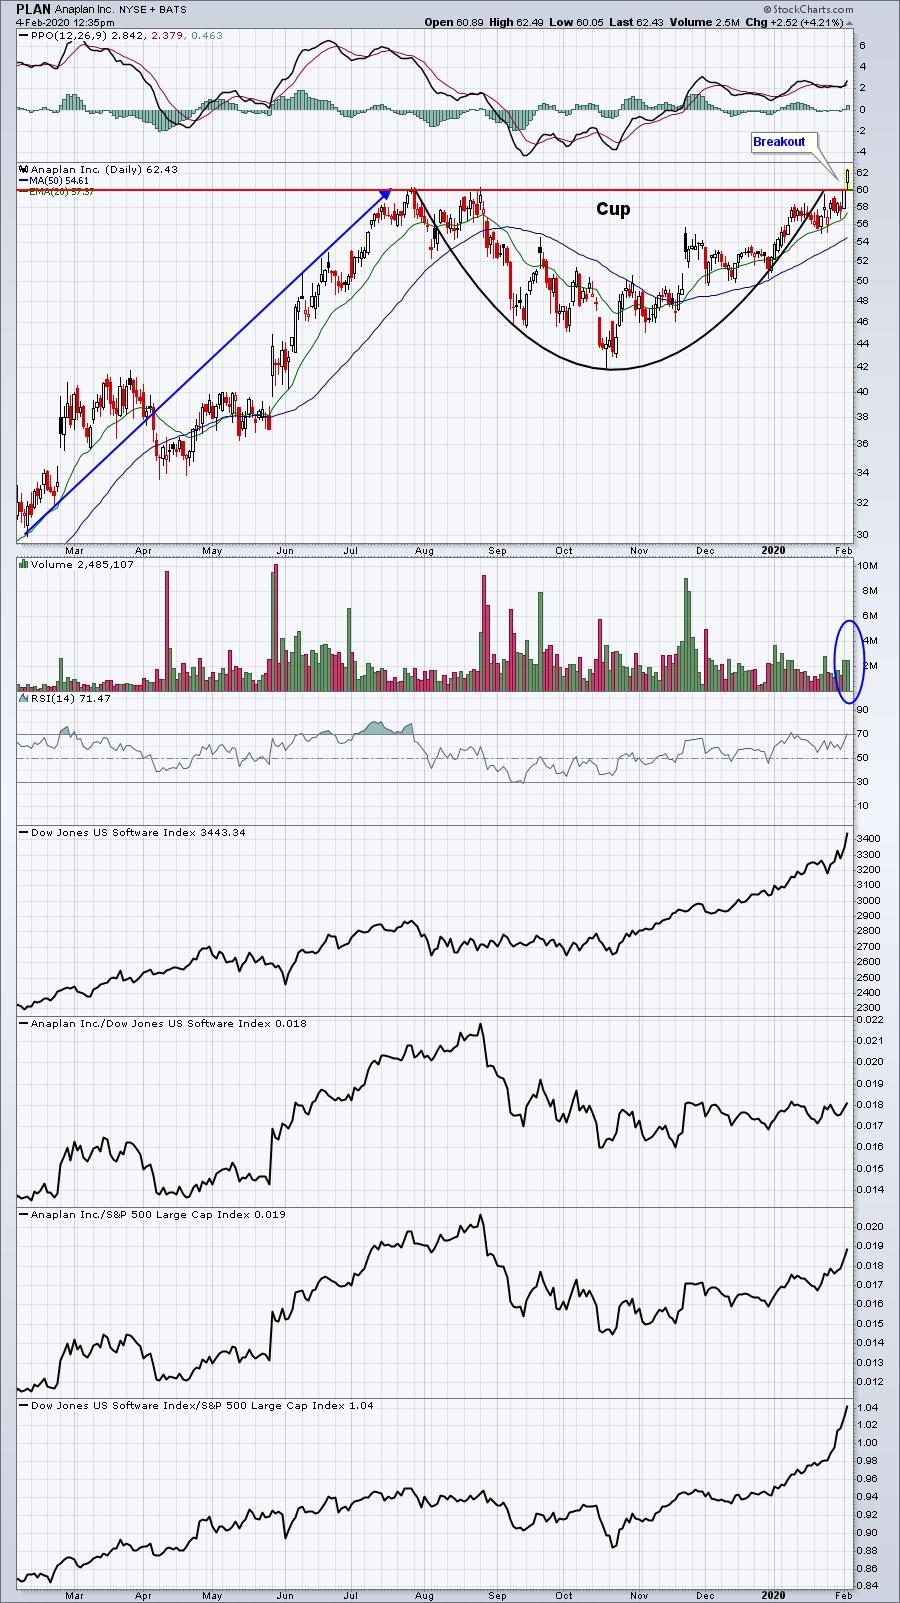
Here's a beautiful breakout of a bullish cup with handle continuation pattern. Volume is confirming the breakout and the measurement would be 78. It doesn't hurt that the stock is in the very bullish software industry ($DJUSSW).
CBSH:
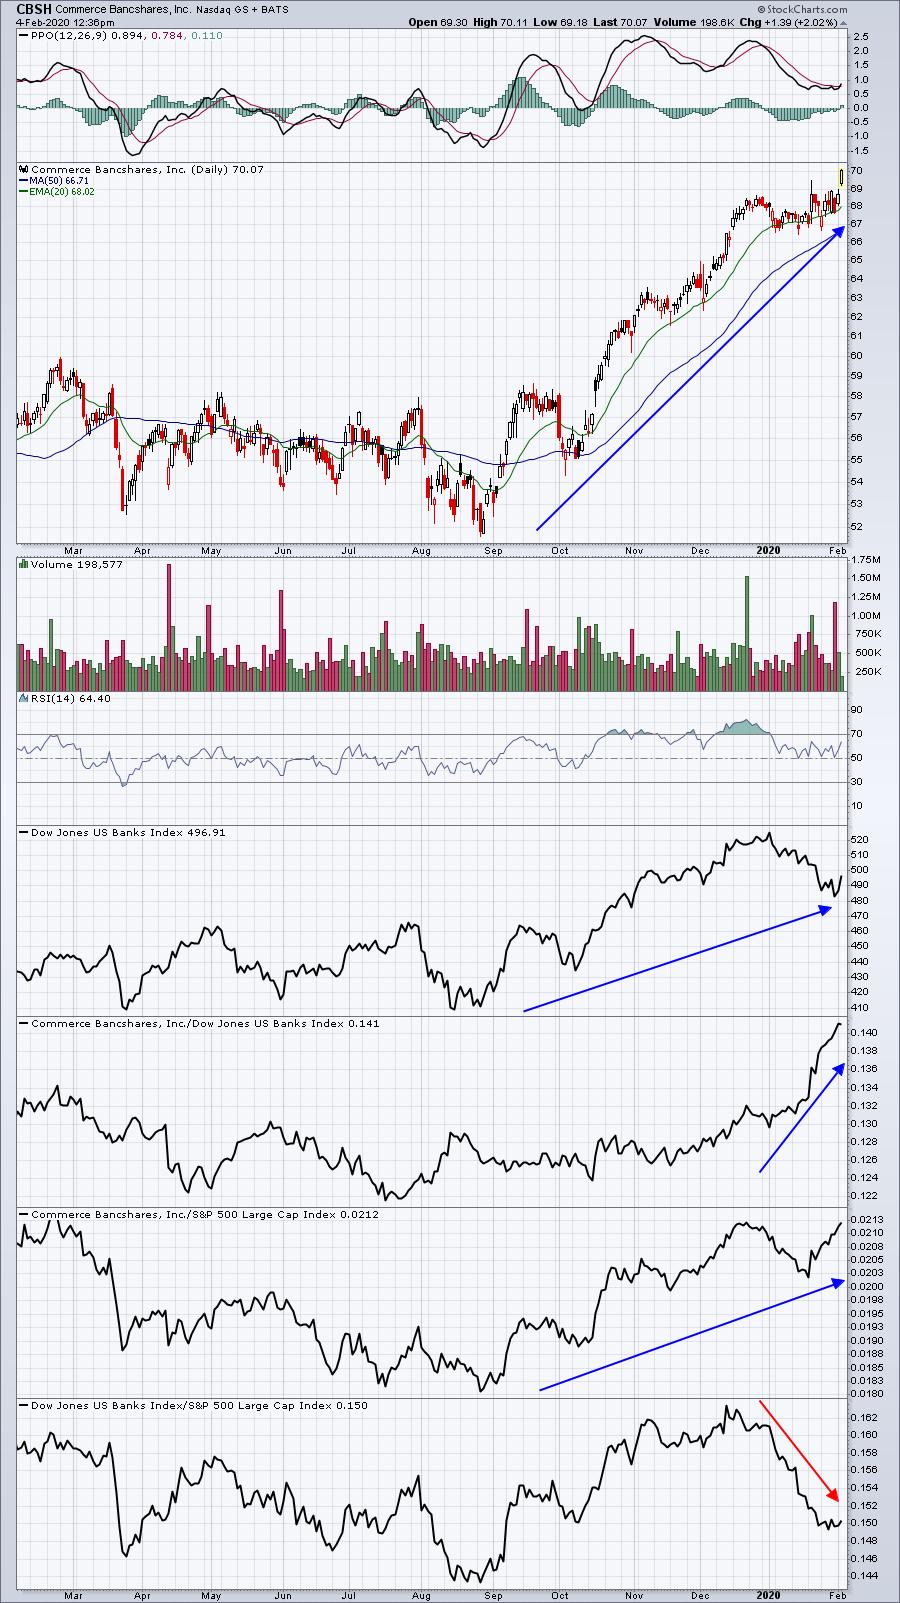
Is there a better bank to own right now than CBSH? If there is, I don't know which one. Look at the soaring relative strength, breaking out to new highs, all during a 6-7 week stretch when banks ($DJUSBK) have performed miserably. If the 10 year treasury yield ($TNX) continues to cooperate and move higher, I'd look for CBSH to lead the bank pack higher.
Movers & Shakers
I looked through S&P 500 companies to find key support levels that are being tested or recently have been tested. Here are a few:
LKQ:
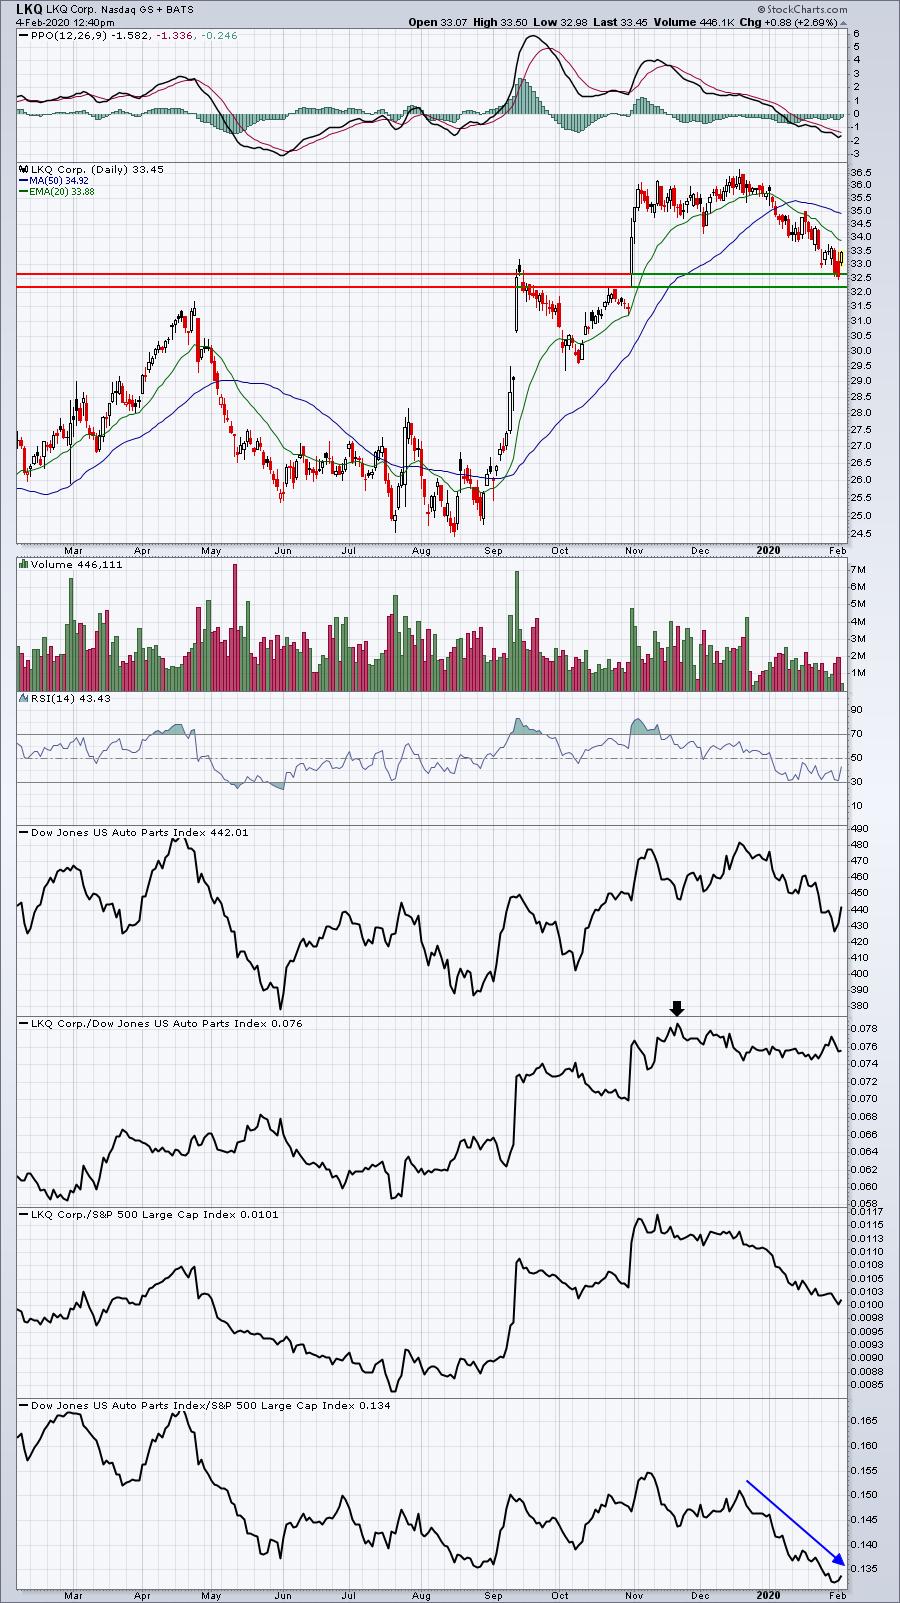
Despite being part of a very disappointing auto parts group ($DJUSAT), LKQ has managed to perform quite well on a relative basis as it slowly made its way all the way back to key gap support. A rally from here certainly wouldn't be a shocker.
VAR:
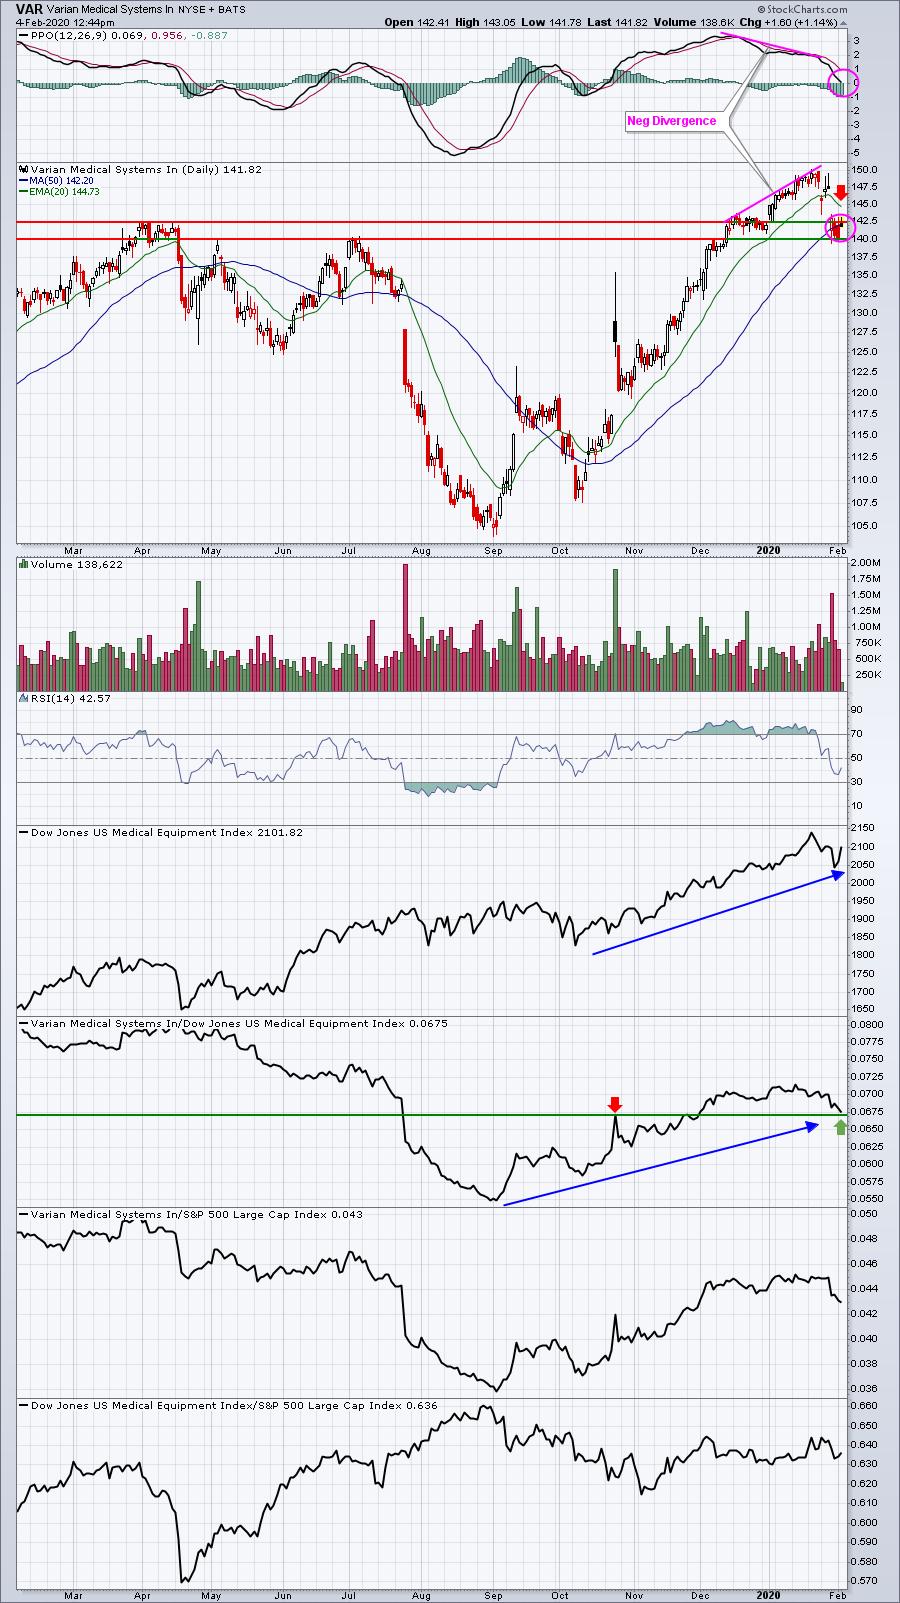
VAR had been uptrending relative to a very strong medical equipment industry ($DJUSAM), but ran into slowing momentum issues, evidenced by the negative divergence. I look for PPO centerline "resets" and/or 50 day SMA tests when I see negative divergences and VAR has seen both materialize. Watch the recent price low, but I believe VAR could be poised to regain strength from here.
CNC:
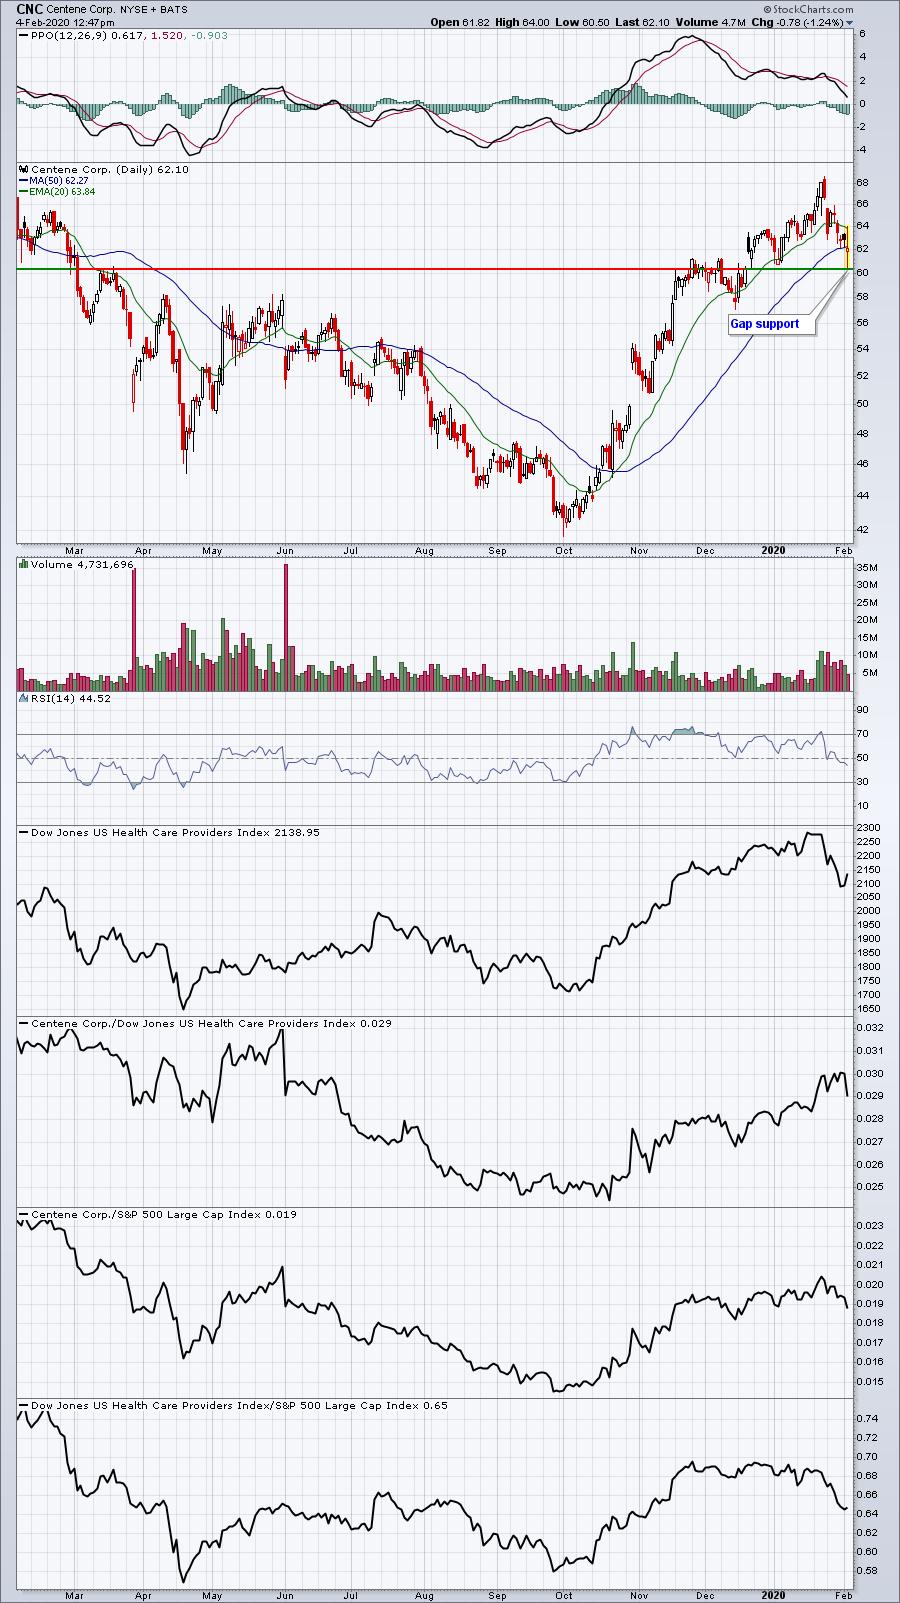
Though I didn't highlight it on the chart, CNC also suffered from slowing momentum as the recent higher prices were accompanied by lower PPO readings. Today, we're testing both gap support and the 50 day SMA, while the PPO moves back toward a centerline reset.
Earnings Reports
Here are the key earnings reports for this week, featuring stocks with market caps of more than $10 billion. I also include a few select companies with market caps below $10 billion. Finally, any portfolio stocks (or active trade alerts) that will be reporting results are highlighted in BOLD. Please make sure you check for earnings dates for any companies you own or are considering owning:
Tuesday, February 4:
DIS, BP, FISV, GILD, CB, COP, LHX, EMR, SPG, ETN, AFL, ALL, PRU, F, TDG, RACE, SIRI, ZBH, KLAC, MCK, SNAP, CNC, CMI, RCL, CMG, MCHP, CERN, MTCH, CLX, MKL, STX, WAT, IT, ATO, J, PAA, JKHY, GL, ARMK, CCK. Others less than $10 bil: DOX, NBIX, RL, PCTY, ENTG, UNM, MANH, IPHI, VIAV, BOOT
Wednesday, February 5:
MRK, NVO, GSK, QCOM, BBD, BSX, SU, GM, MET, HUM, CTSH, ORLY, AVB, IFNNY, SPOT, DTE, FOXA, AME, IAC, PAYC, CINF, TWLO, BAP, YUMC, FMC, LNC, CDAY. Others less than $10 bil: PTON, NUAN, GRUB, FEYE, RAMP
Thursday, February 6:
PM, SNY, BMY, BDX, CI, SPGI, EL, UBER, ICE, ATVI, DASTY, BIDU, BCE, REGN, YUM, TSN, MSI, FLT, WLTW, FCAU, TWTR, FTV, VRSN, BLL, K, FTNT, CDW, MTD, SGEN, NLOK, IQ, ODFL, CAH, MT, XYL, TTWO, WYNN, ALNY, PINS, MPW. Others less than $10 bil: ZEN, SNA, DXC, TPR, DNKN, SKX, HBI, SYNA
Friday, February 7:
ABBV, HMC, CBOE, CNHI, AVTR. Others less than $10 bil: CAE, GOOS, CCJ
Economic Reports
December factory orders: +1.8% (actual) vs. +1.3% (estimate)
Happy trading!
Tom