
EB Daily Market Report - Friday, February 7, 2020
Executive Market Summary
- Our major indices are lower as traders take profits to end a strong week
- We saw a very strong January nonfarm payrolls report (see below); the dollar (UUP) has reached the October high
- Dow Holdings (DOW, -3.31%) is the big loser in the Dow Jones; Take-Two Interactive (TTWO, -10.89%) is the worst S&P 500 component
- Defensive sectors are leading today's action, typical on a down day
- Energy (XLE, -1.30%) and materials (XLB, -1.03%) are the laggards, likely reacting to that dollar strength
- The bond market is begging the Fed for another rate cut to weaken the dollar and to inflate the economy
- We currently have no active trade alerts
Market Outlook
The S&P 500 typically consolidates in February, before pushing higher again in March and April. That's the typical seasonal pattern, though it certainly does not hold true every year. It's simply a tendency to be aware of. Here's the seasonal chart:
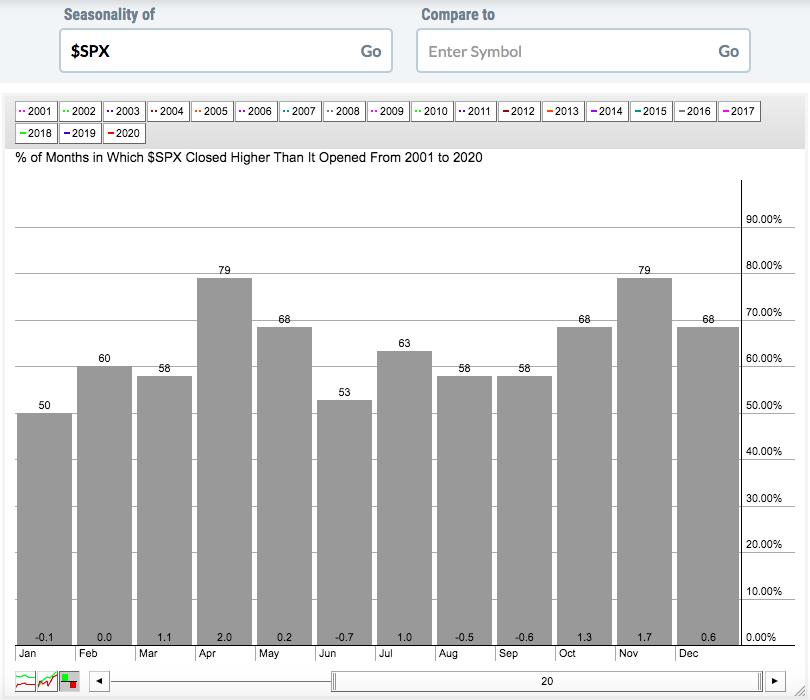
The S&P 500 has risen 60% of Februarys this century, but the average gain is 0.0%. We tend to see much more bullish action as we approach Spring.
Also, it's worth noting that today is the 7th calendar day of February. The 7th to 10th of all calendar months tends to be profit taking periods following the usual run up in price at the beginning of calendar months. That could be contributing to today's weakness as well.
Sector/Industry Focus
I found the bond market's reaction this morning to a much-better-than-expected jobs report quite interesting. Usually a strong economic report like this one would send traders scurrying out of defensive treasuries. But not today. I believe the reason once again was the very tame inflation data. The January average hourly earnings came in at +0.2%, below the expected +0.3% level. Last Friday, we saw the PCE come in well below the Fed's 2.0% target level. There is little price inflation and little wage inflation. We remain in an environment that is nirvana for equities - moderate growth, very low interest rates, and a Fed that's more likely to cut rates than to raise them.
Until we begin to see meaningful move higher in inflation, the equity bulls have the equity bears in "checkmate", in my opinion.
Active Trade Alerts
Currently, we have no active trade alerts.
Strong Earnings ChartList (SECL)
On days like today, I tend to run a pullback scan, looking perhaps for solid SECL stocks testing their 20 day EMAs. My preference is to look for opens and closes (current prices) above the 20 day EMA with an intraday low beneath the 20 day EMA. The scan looks like this:
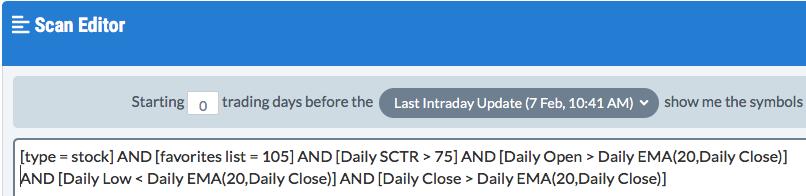
It returned just 3 stocks - RAD, TER, and WAL. Remember, we only have 129 stocks on our SECL, but I'm hoping to more than double that by this weekend as we add strong earnings from the past couple weeks. Another scan that I'll run from time to time against the SECL is "RSI between 40 and 50". Many times that will provide solid uptrending candidates in a short-term pullback. Of the three I mentioned above, RAD and TER are both consolidating, so they might encounter a bit more short-term turbulence, although I like TER a lot. WAL is interesting, however:
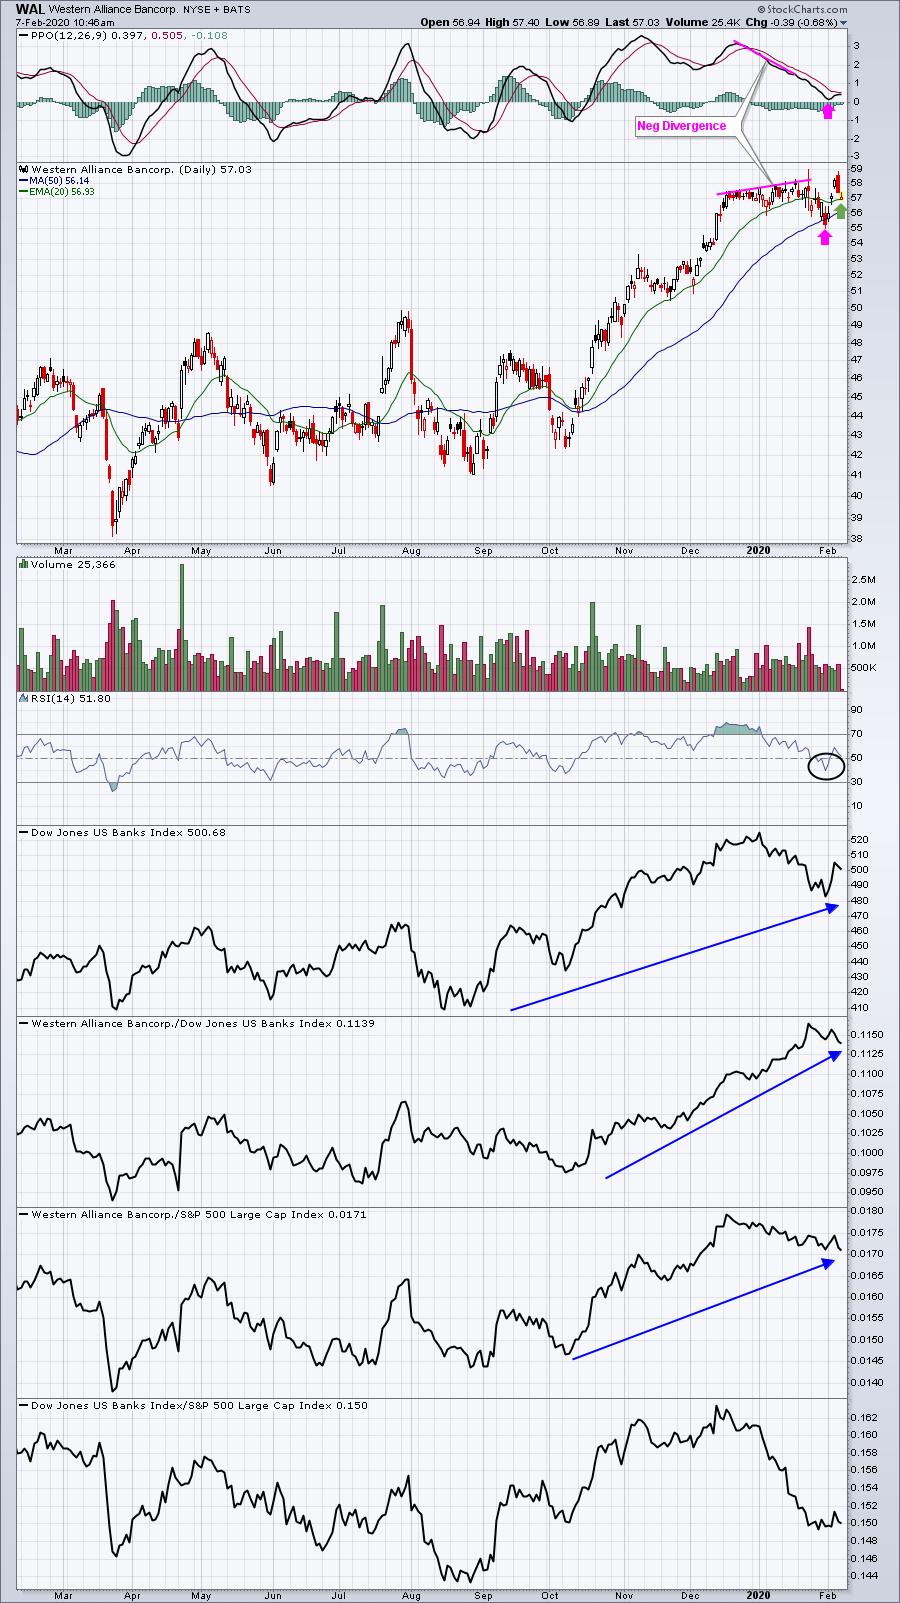
WAL is one of the best performing bank stocks and despite a rough month of bank action, it managed to break out this week before printing that short-term bearish engulfing candle yesterday. WAL is somewhat dependent on a rising 10 year treasury yield ($TNX), but building a position here isn't a bad strategy.
Movers & Shakers
I reviewed the worst performers on the NASDAQ today and two are testing critical price support levels:
MYGN:
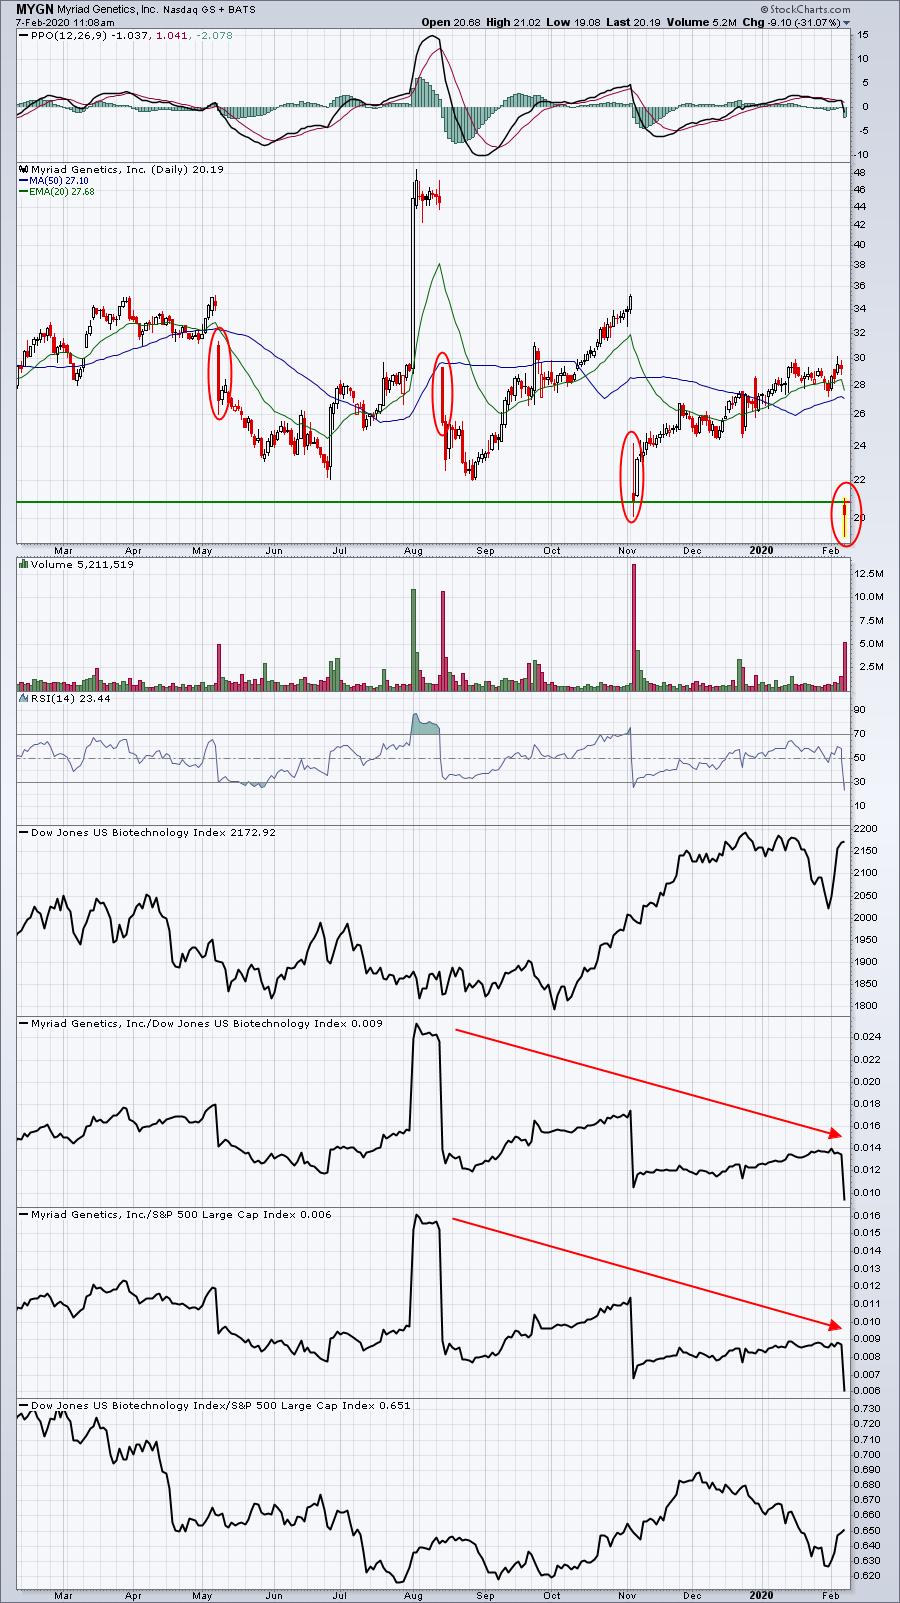
The four red circles above illustrate that old Wall Street adage, "there's never just one cockroach in the kitchen". Also, the overall downtrend vs. a biotech group ($DJUSBT) that's yet to make a major breakout is problematic as well. Finally, I don't like to see gap downs that open below the prior candle body support. I'd expect to see more selling today.
ADTN:
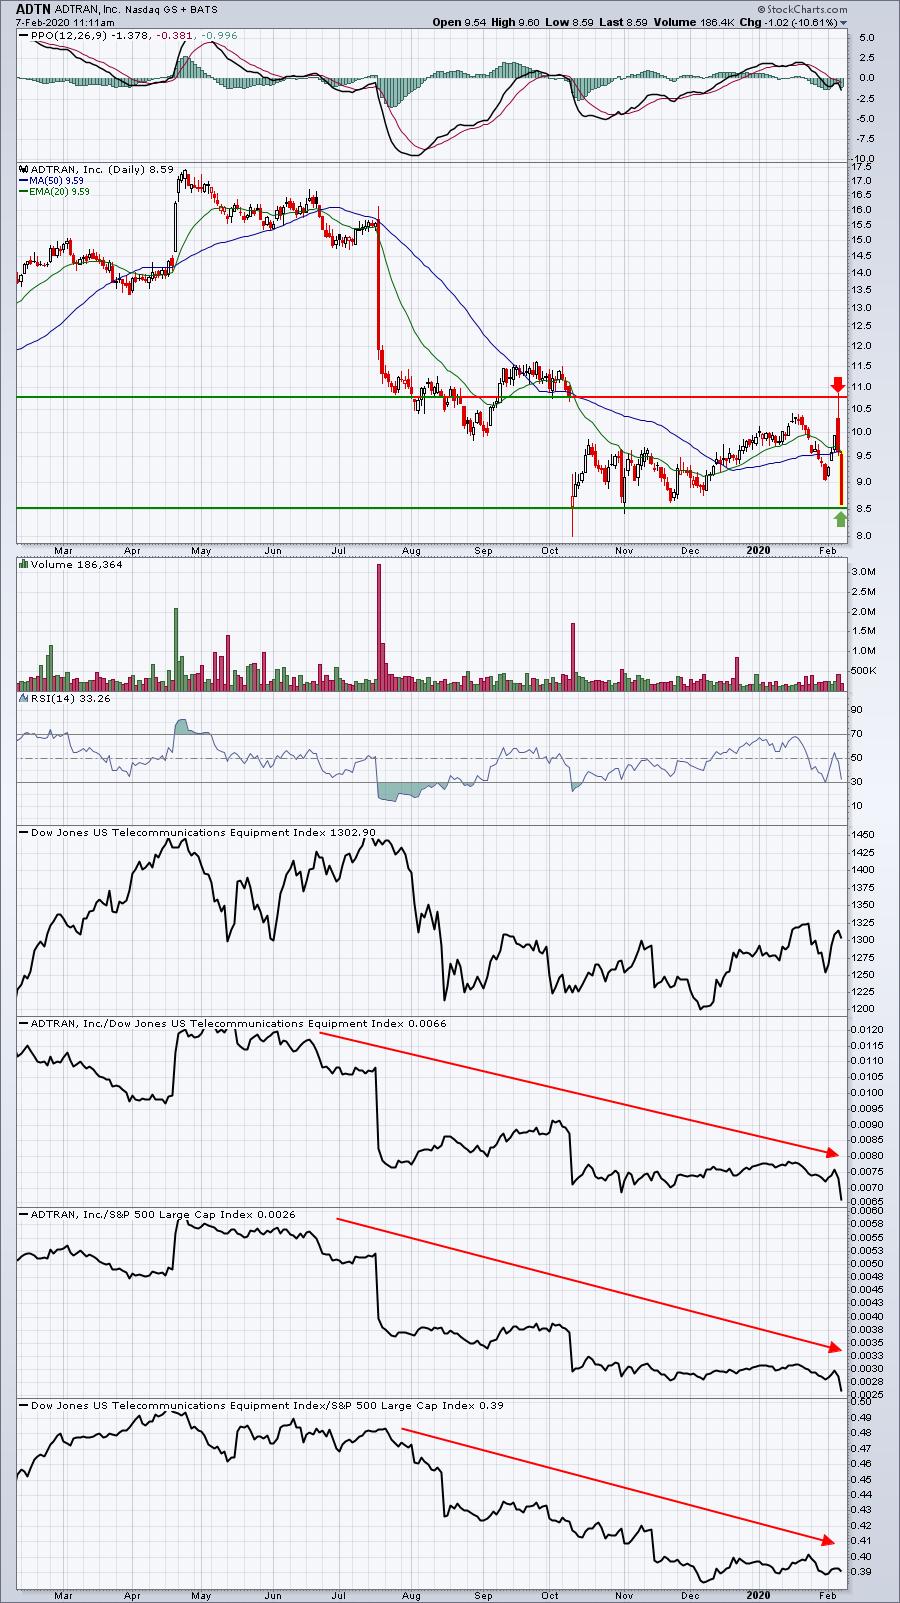
ADTN might be a bit better off than MYGN, but only slightly. The biggest difference is that ADTN didn't open beneath price support, so perhaps we'll see a rebound off the support drawn. This chart highlights why it's really important to see gap resistance cleared on a closing basis. I pointed out TWTR needing to clear its gap resistance yesterday. If failed at the close and today is trading 6-7% beneath yesterday's high.
Getting back to ADTN, check out those relative strength panels. It's ugly. I have no interest in owning a stock that Wall Street loathes, no matter how close we are to price support. It's just not my style of trading. The reason is simple. I'm worried the next cockroach may get loose in the kitchen.
Earnings Reports
Here are the key earnings reports for this week, featuring stocks with market caps of more than $10 billion. I also include a few select companies with market caps below $10 billion. Finally, any portfolio stocks (or active trade alerts) that will be reporting results are highlighted in BOLD. Please make sure you check for earnings dates for any companies you own or are considering owning:
Friday, February 7:
ABBV, HMC, CBOE, CNHI, AVTR. Others less than $10 bil: CAE, GOOS, CCJ
Monday, February 10:
ITUB, AGN, MELI, QSR, RNG, L, BIP, STE, CNA, RE, DVA. Others less than $10 bil: XPO, VOYA, MOH, JCOM, RPD, AMKR, ACB, ELY
Economic Reports
January nonfarm payrolls: 225,000 (actual) vs. 160,000 (estimate)
January private payrolls: 206,000 (actual) vs. 150,000 (estimate)
January unemployment rate: 3.6% (actual) vs. 3.5% (estimate)
January average hourly earnings: +0.2% (actual) vs. +0.3% (estimate)
December wholesale inventories: -0.2% (actual) vs. +0.1% (estimate)
Happy trading!
Tom