
EB Daily Market Report - Tuesday, February 11, 2020
Executive Market Summary
- Our major indices are rallying again today, though we're off earlier highs
- A federal judge approved the merger of T-Mobile (TMUS) and Sprint (S); both are much higher, especially S, which is up 73%!
- Crude oil ($WTIC) is up 1% to just above $50 per barrel
- Treasuries are lower, with the 10 year treasury yield ($TNX) up 4 basis points to 1.59%
- Global markets are mostly higher
- Real estate (XLRE), materials (XLB), and energy (XLE) are leading today's rally
- Biotechs ($DJUSBT) are threatening a MAJOR breakout, more on this below in Sector/Industry Focus
- We have added one trade alert today - DKS; more on this below
Market Outlook
Four months ago, with the NASDAQ threatening to break below price support near 7700, how many folks thought we'd be a little more than a month into 2020 with the NASDAQ now approaching 10000? Well, that pretty much sums up the last four months:
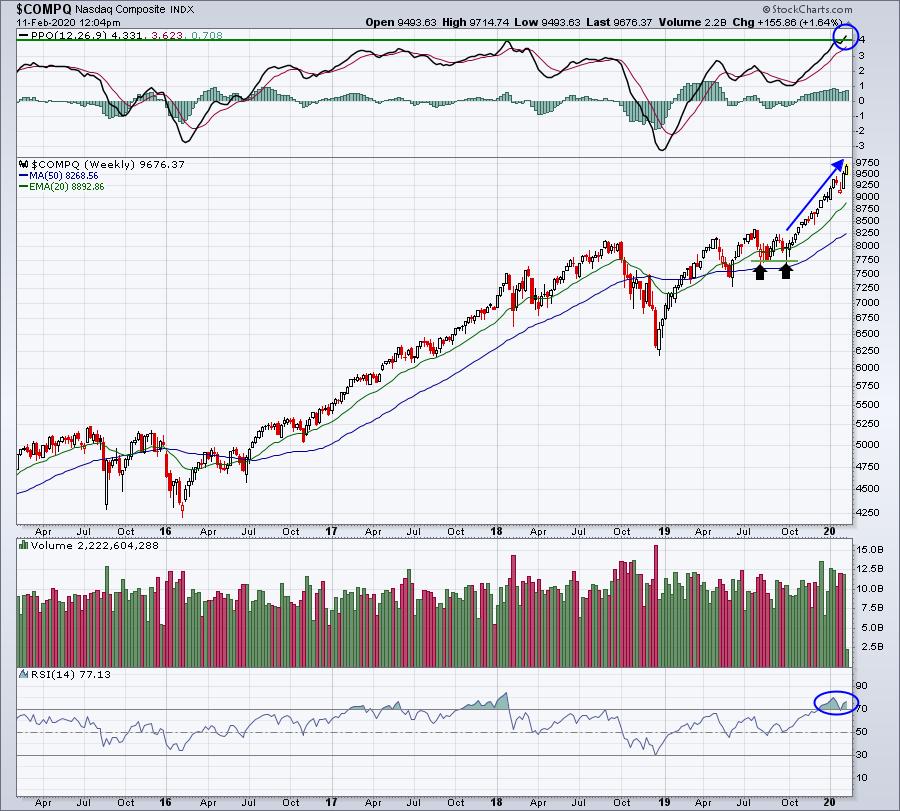
Looking at the above weekly chart and seeing the weekly RSI at 77 and the weekly PPO above 4 and at a new 5 year high, it'd be really easy to make the case to get out of the stock market and wait for things to settle down. I completely understand that line of thinking. But to counter that argument, you need to look at what the NASDAQ did during the last secular BULL market from 1981 to 2000:
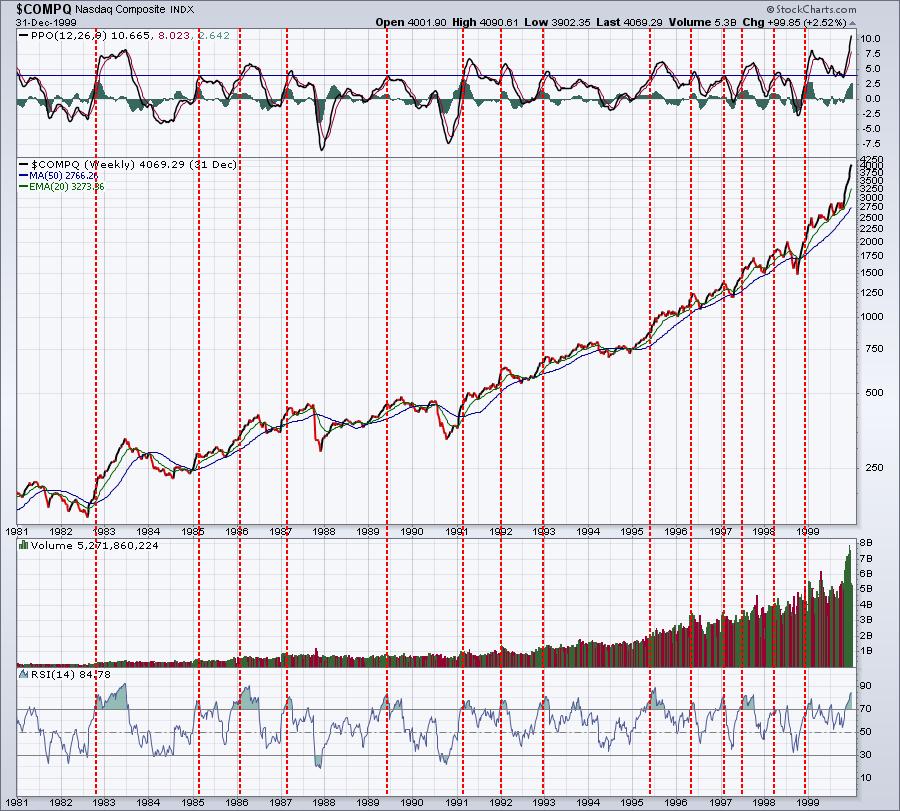
Focus on two things on the above chart. First, there's a horizontal line drawn at the PPO 4 level, which is roughly where we stand today. Then, I've highlighted the PPO reaching 4 by drawing vertical red-dotted lines so that you can review what happened AFTER the weekly PPO hit 4 during a secular BULL market. Also, check out the weekly RSIs while you're at it. Rarely did the combination of a weekly PPO at 4 and weekly RSI in the 70s result in any kind of major selloff. In fact, many times the stock market simply put its head down and kept rolling higher.
So the question that you must ask yourself is this. If you decide to get out because we've simply "run too far", what do you do in 2-3 months if we're another 10% higher? Is the risk of holding through a potential short-term pullback so great that you're willing to risk missing out on a potential superstar bull market rally?
I fully believe that longer-term buy and hold type investors should not hesitate. Stay with this bull market. It's ok for short-term traders to lighten positions occasionally, but you MUST be prepared to buy back in at higher prices if you're wrong and the short-term pullback never materializes....or doesn't fall as much as you'd like.
Sector/Industry Focus
Biotechs ($DJUSBT) are attempting a MAJOR breakout today and everyone should be aware of it. I wrote an article in my Trading Places blog, discussing the importance. Here's the chart that I posted in that article:
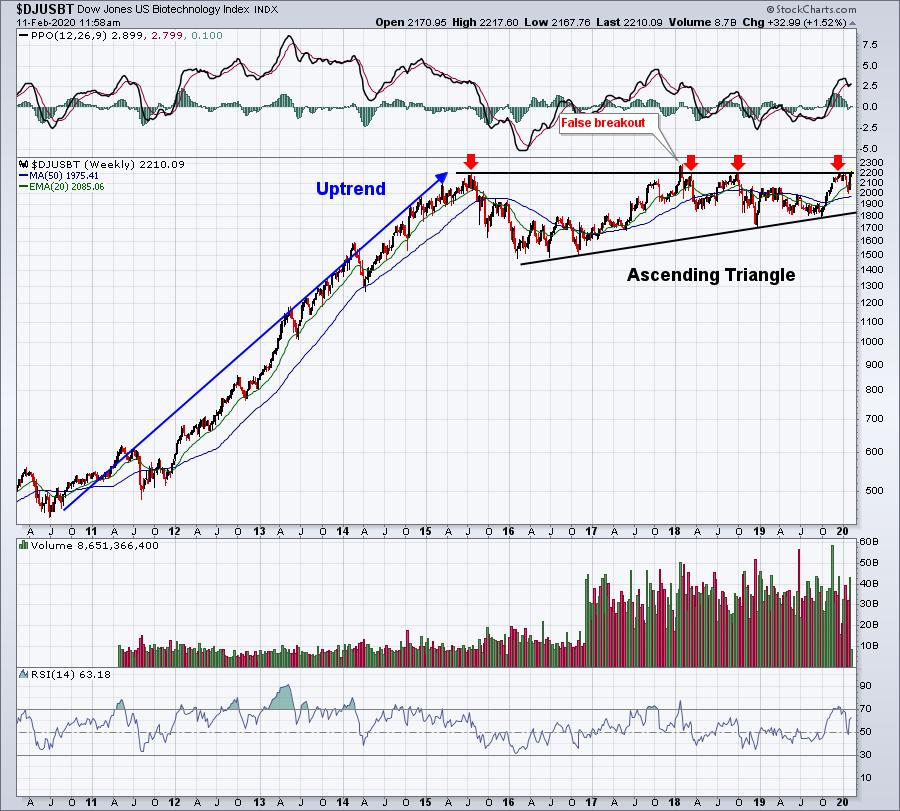
I'd really like to see a nice finish today to help confirm this breakout. To read more, you can CLICK HERE to view my blog article at StockCharts.
Active Trade Alerts
Just a little while ago, we added DKS as a trade alert. We like the potential reversal from a very key gap support level. We are entering a full position at current price, but buying in increments down to 43.75 helps to lower risk should DKS pull back later today or this week. We will exit on ANY close beneath 43.25. Our target would be near the high after earnings, or 49.50.
A chart of DKS is reflected below in the SECL section of today's DMR.
Strong Earnings ChartList (SECL)
I reviewed our SECL of 269 stocks and found a few interesting today. Here they are:
AMBA:
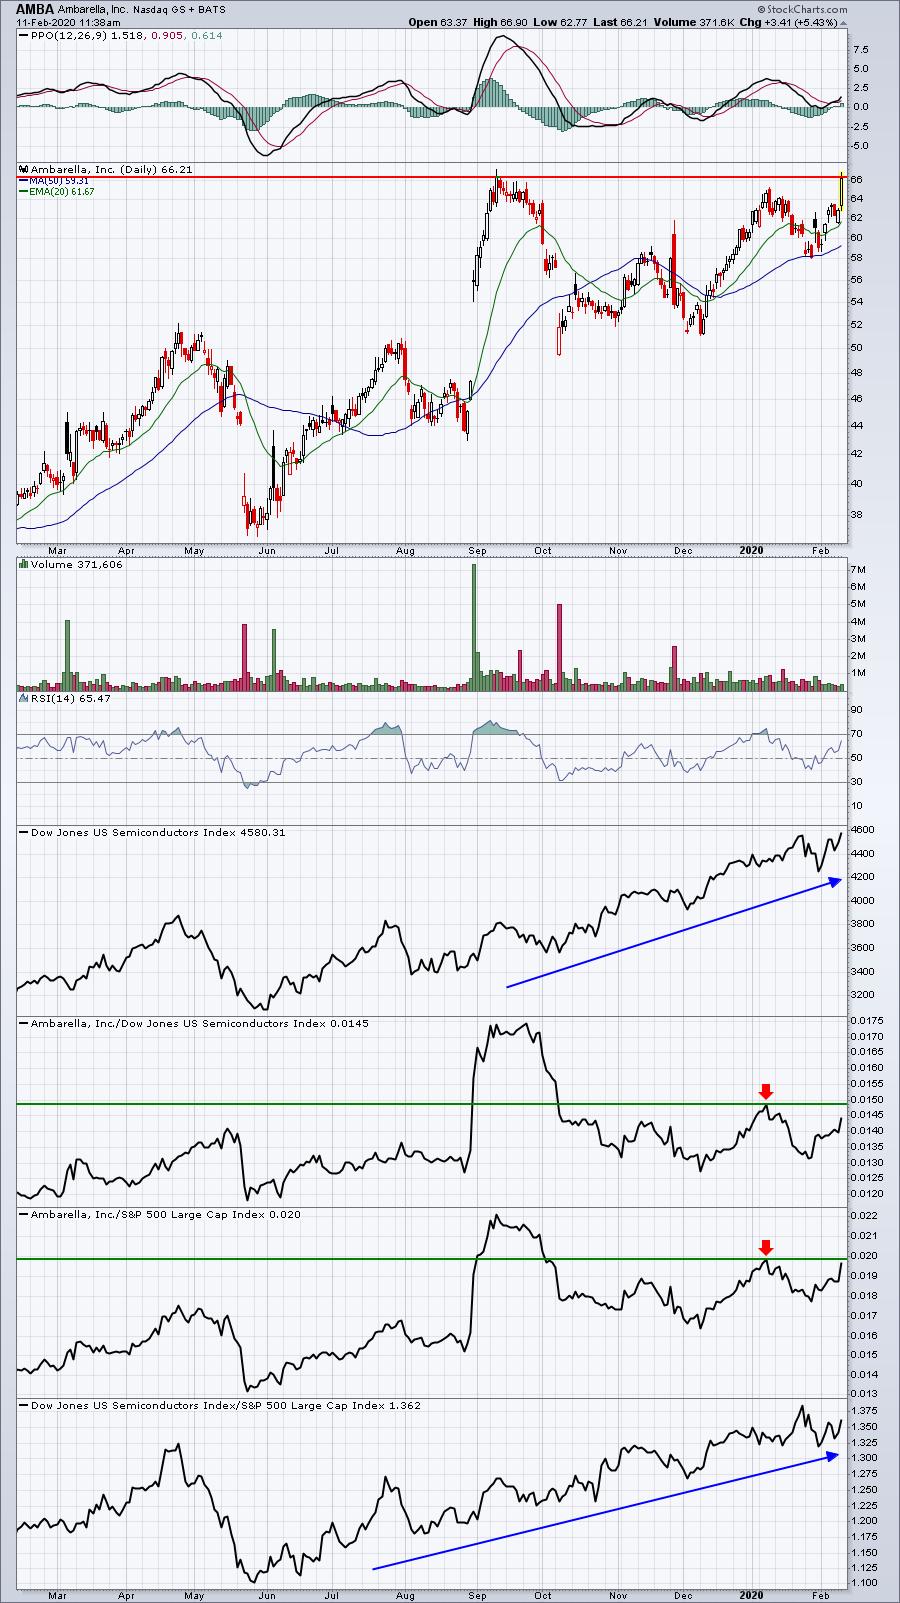
AMBA is part of a very strong semiconductor group ($DJUSSC), so a breakout is something to be aware of. However, this could be a short-term top at price resistance. Check out those two red arrows above. They mark key relative resistance. If AMBA can break out on an absolute basis, while also showing relative strength, that would be a bullish combination.
DKS:
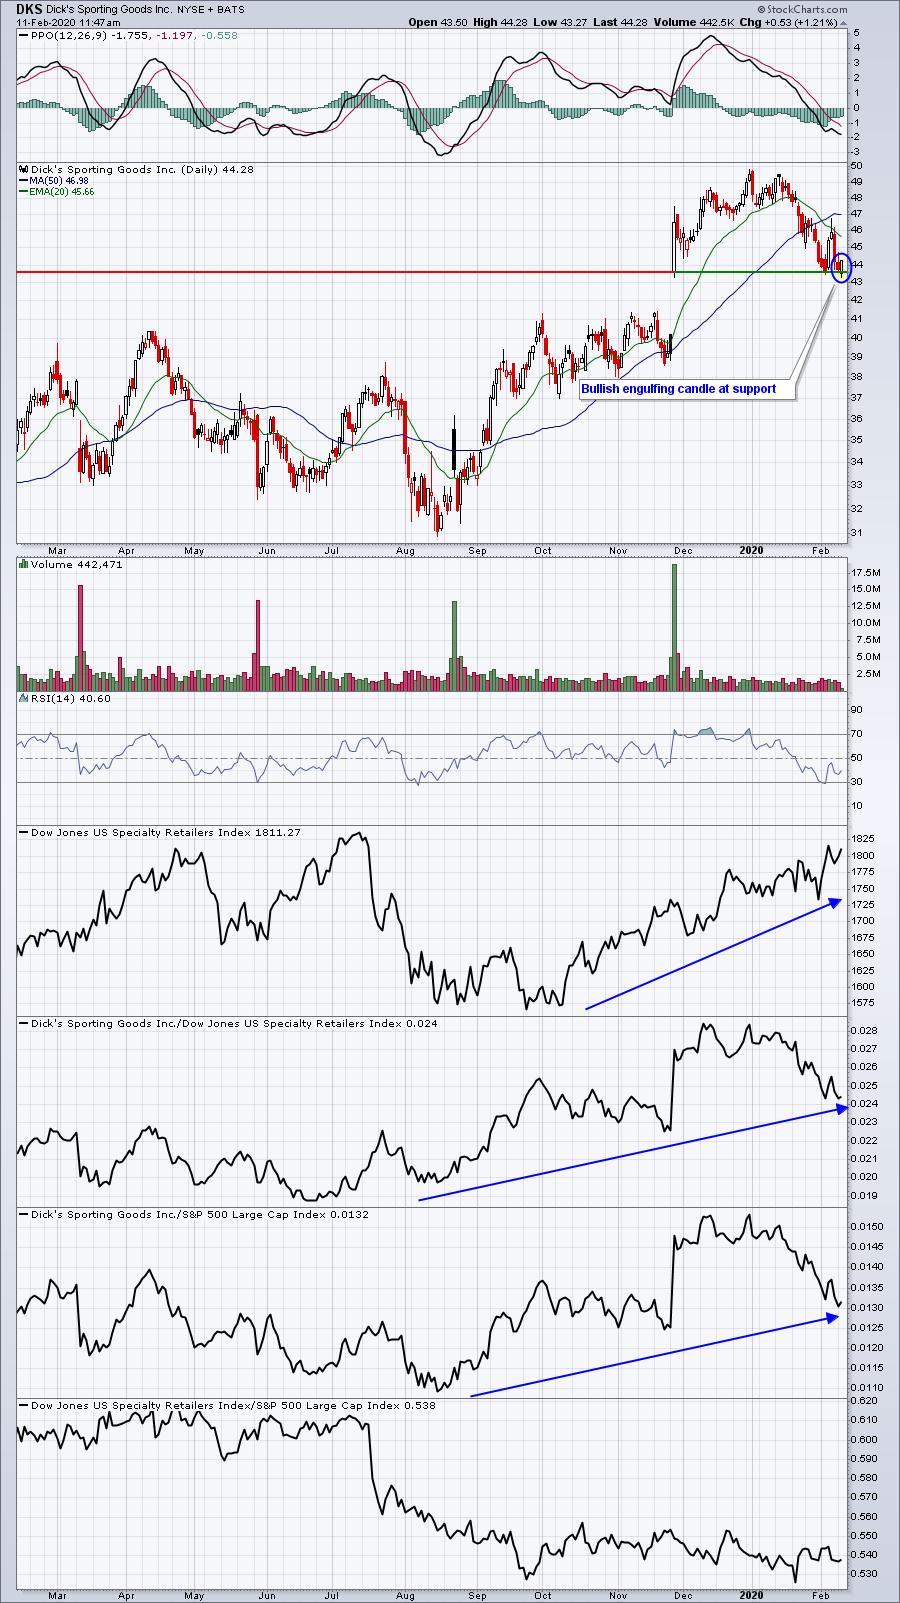
DKS was added as an Active Trade Alert within the past hour. It's fallen back to test the top of important gap support and is currently printing a bullish engulfing candle, which many times marks a bottom. Relative strength of specialty retailers ($DJUSRS) is the biggest question mark here and a reason to keep a tight stop in place.
SIG:
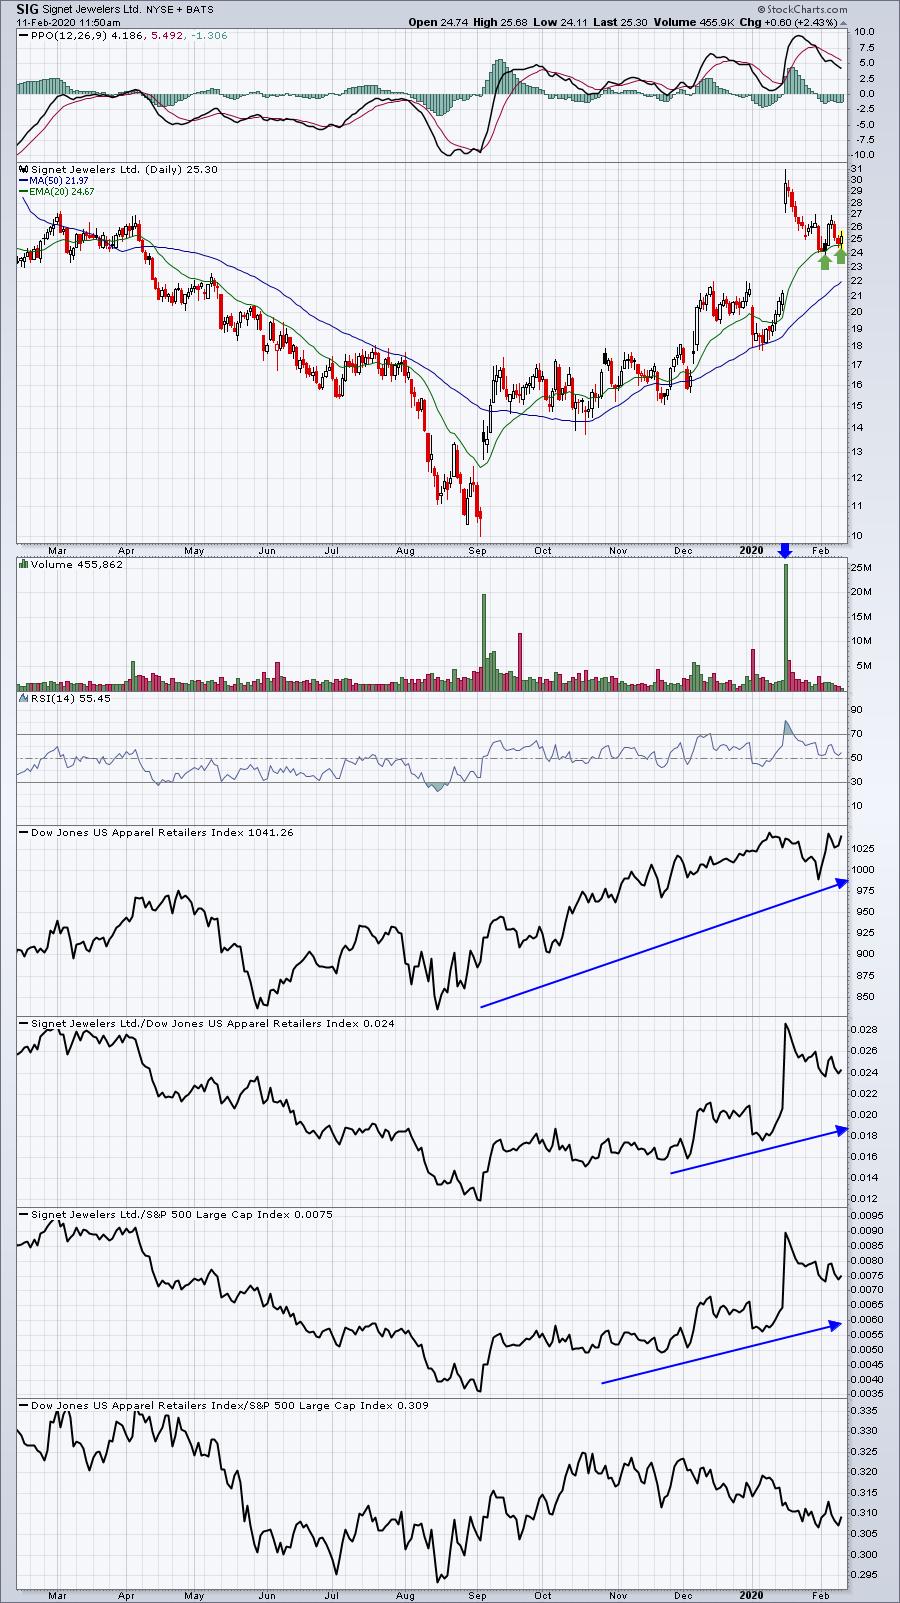
SIG had a huge gap higher after earnings came in better than expected. The pullback, so far, has been contained at the 20 day EMA, which is exactly where it's trying to reverse today.
AZO:
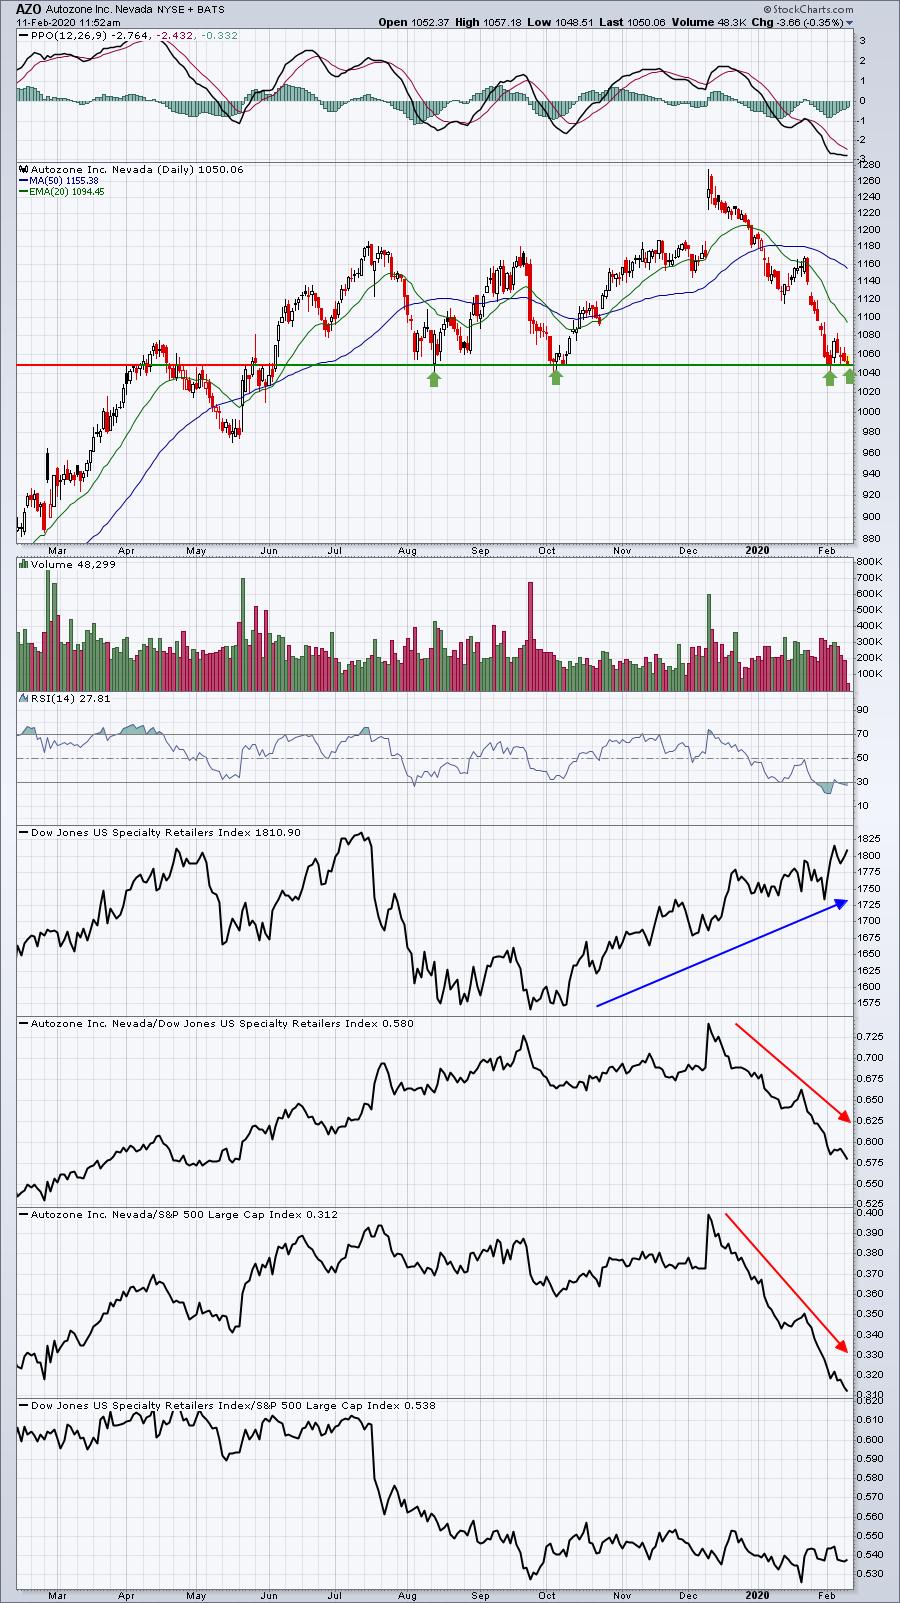
Ok, this isn't my style as I don't like trading any stock that's completely fallen apart on a relative basis. But at the same time, I feel it's worth pointing out that AZO is literally sitting right on a major intermediate-term price support level. Be very careful if price support is lost.
Movers & Shakers
I reviewed the worst performers in the S&P 500 today, looking for potential opportunities. I think I may have found one.
L:
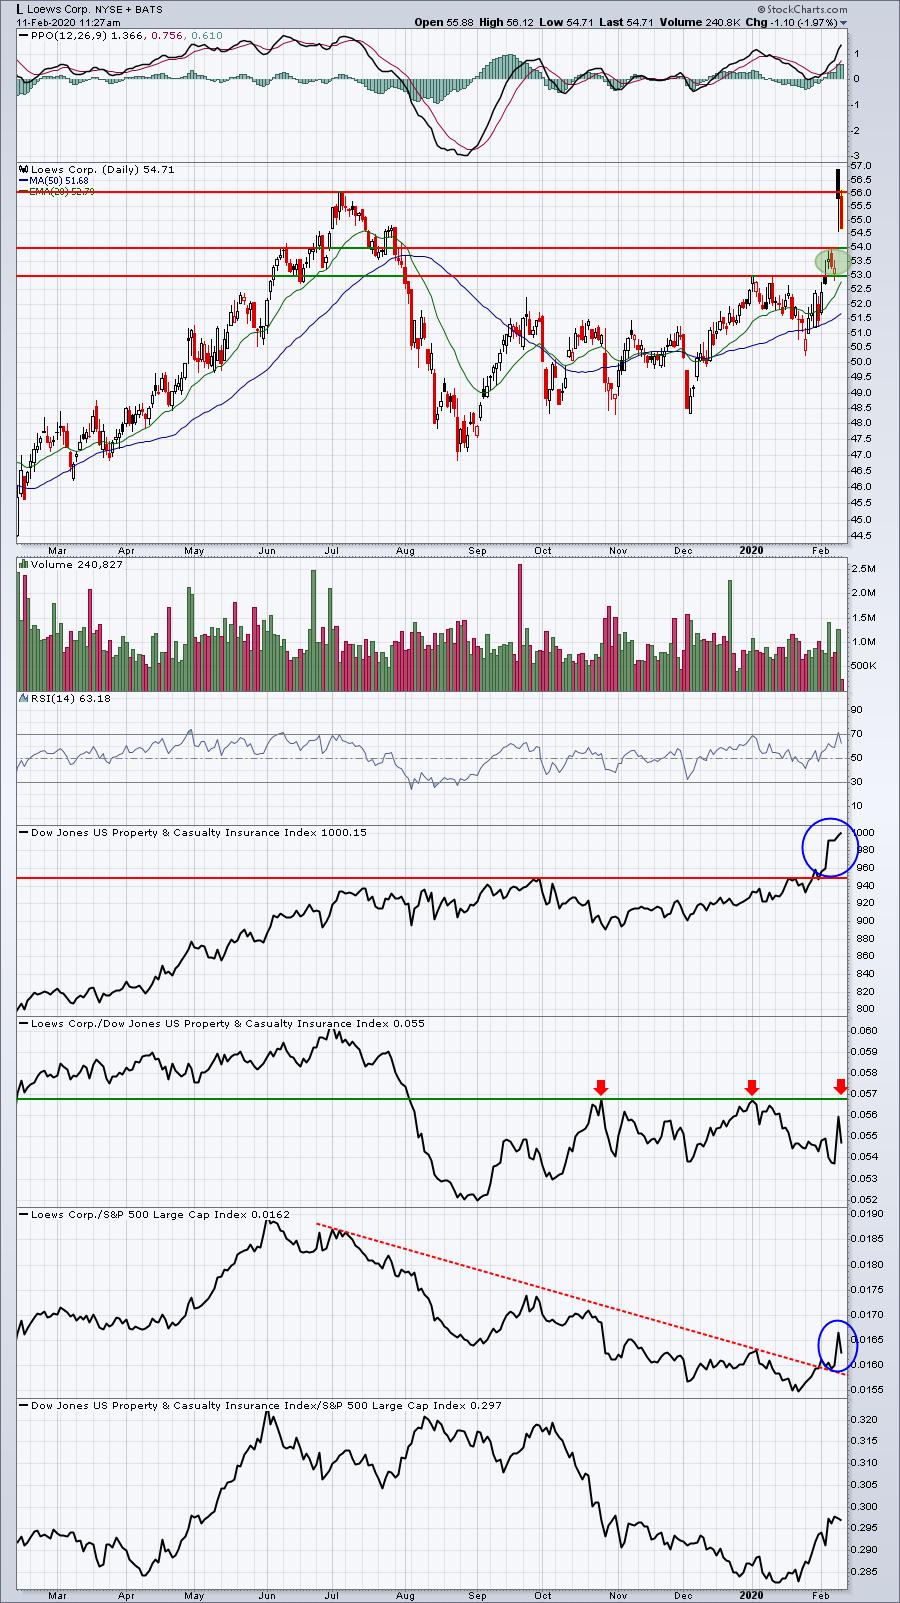
L reported quarterly results on Monday morning and beat EPS estimates (.73 vs .72). We saw a great initial reaction as L gapped higher and cleared prior overhead price resistance. Any time we see a gap higher with earnings, we must be aware that market makers are providing liquidity and likely on the short side. That's why many gaps will "fill", which means price action returns to the prior close. I suspect L will find buyers if price reaches the 53-54 price support zone. I don't know if it gets down there, but the reward to risk really turns quite solid in that zone as I would keep a closing stop beneath 53.
Earnings Reports
Here are the key earnings reports for this week, featuring stocks with market caps of more than $10 billion. I also include a few select companies with market caps below $10 billion. Finally, any portfolio stocks (or active trade alerts) that will be reporting results are highlighted in BOLD. Please make sure you check for earnings dates for any companies you own or are considering owning:
Tuesday, February 11:
D, EXC, HLT, ACGL, PEAK, AMCR, MLM, OMC, AKAM, UDR, MAS, LYFT, HAS, EXAS, WU. Others less than $10 bil: UAA, EEFT, AN, TGNA, NSP, LSCC
Wednesday, February 12:
CSCO, CVS, CME, GPN, AMAT, SHOP, MCO, EQIX, MFC, WELL, GOLD, IQV, SLF, WCN, CDNS, EFX, ATUS, MGM, SSNC, CTL, IFF, NLY, NTAP, TEVA, TYL, TAP, CVE, TRMB, REG. Others less than $10 bil: MRO, IPG, AVLR, CYBR, TRIP
Thursday, February 13:
BABA, PEP, NVDA, LIN, FIS, DUK, ZTS, WM, TRP, AIG, BCS, KHC, RSG, CCEP, DLR, DXCM, FTS, LH, ANET, INCY, EXPE, ROKU, AEM, DDOG, ZBRA, FNF, LBTYA, WST, GDDY, BIO, HII, NICE, BKI. Others less than $10 bil: MHK, AYX, IPGP, GNRC, TPX, HUN, YETI
Friday, February 14:
AZN, ENB, PPL, YNDX. Others less than $10 bil: NWL, CGC
Economic Reports
None
Happy trading!
Tom