
EB Daily Market Report - Wednesday, February 12, 2020
Executive Market Summary
- Gains abound on Wall Street once again
- Asian markets were strong overnight, as are European markets this morning; this is a global advance
- Crude oil ($WTIC) is rallying, up 2.58% to $51.23 per barrel
- Treasury sellers have sent the 10 year treasury yield ($TNX) up 4 basis points to 1.63%, further aiding equities
- Shopify (SHOP) posts blowout results, gains 12%
- Communication services (XLC, +1.07%) and consumer discretionary (XLY, +1.03%) lead all sectors
- Home construction ($DJUSHB, -1.42%) is only industry group in XLY that's lower, reacting to higher TNX
- We have one active trade alert, which is up nicely today
Market Outlook
While I remain extremely bullish U.S. equities, I do want to continue to follow key short-term developments and report those to you as they arise. A 60 minute negative divergence has emerged on all of our major indices, except the S&P 600 Small Cap Index ($SML). While I never look for major tops because of an hourly divergence, I wouldn't rule out a 1% drop on the S&P 500 as the negative divergence plays out:
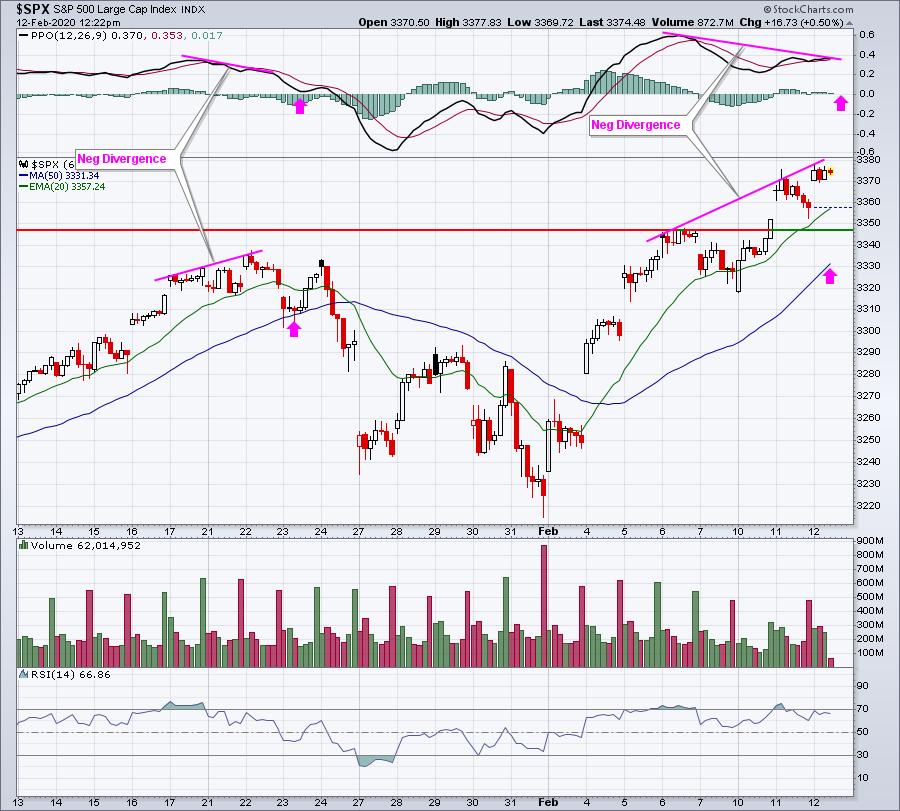
The last negative divergence on January 22nd prompted a bit of selling down to the 50 hour SMA, but that was right after options expired (historically bearish time of the calendar month) and, if you recall, there were tons of warning signs back then. Currently, this negative divergence is one of the few warnings signs I'm seeing. If we do see any weakness, I would expect it to be very short-lived. I don't put nearly the emphasis on a short-term signal like this as I would if we were seeing a consolidating pattern on the daily chart. I am very bullish the S&P 500 on both daily and weekly charts, so I'm aware of the hourly issue, but unlikely to change my strategy much as a result.
Sector/Industry Focus
Industrials (XLI) isn't the leading sector today, but it's still making a key breakout:
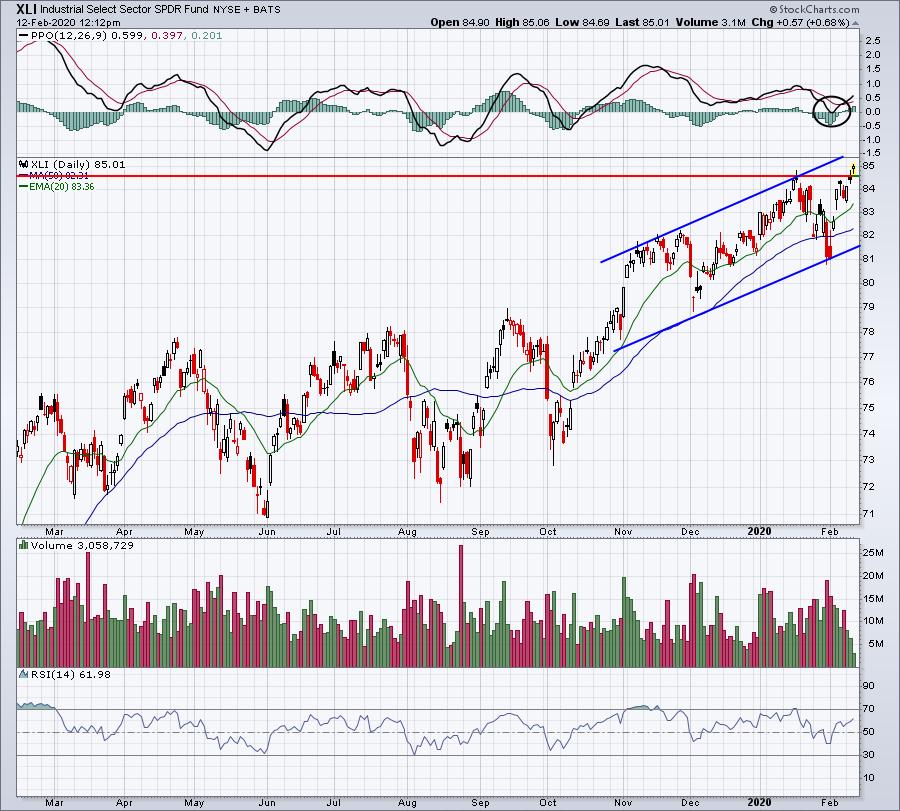
The black circle on the PPO highlights the recent centerline test, or "reset". Now we're breaking out with price momentum just beginning to accelerate again.
Active Trade Alerts
Currently, we have one active trade alert, as follows:
DKS (+2.06%) - reports its next earnings on March 10th. DKS is having a nice day after reversing on Tuesday at the top of gap support. The next obstacle to the upside will be clearing tis 20 day EMA:
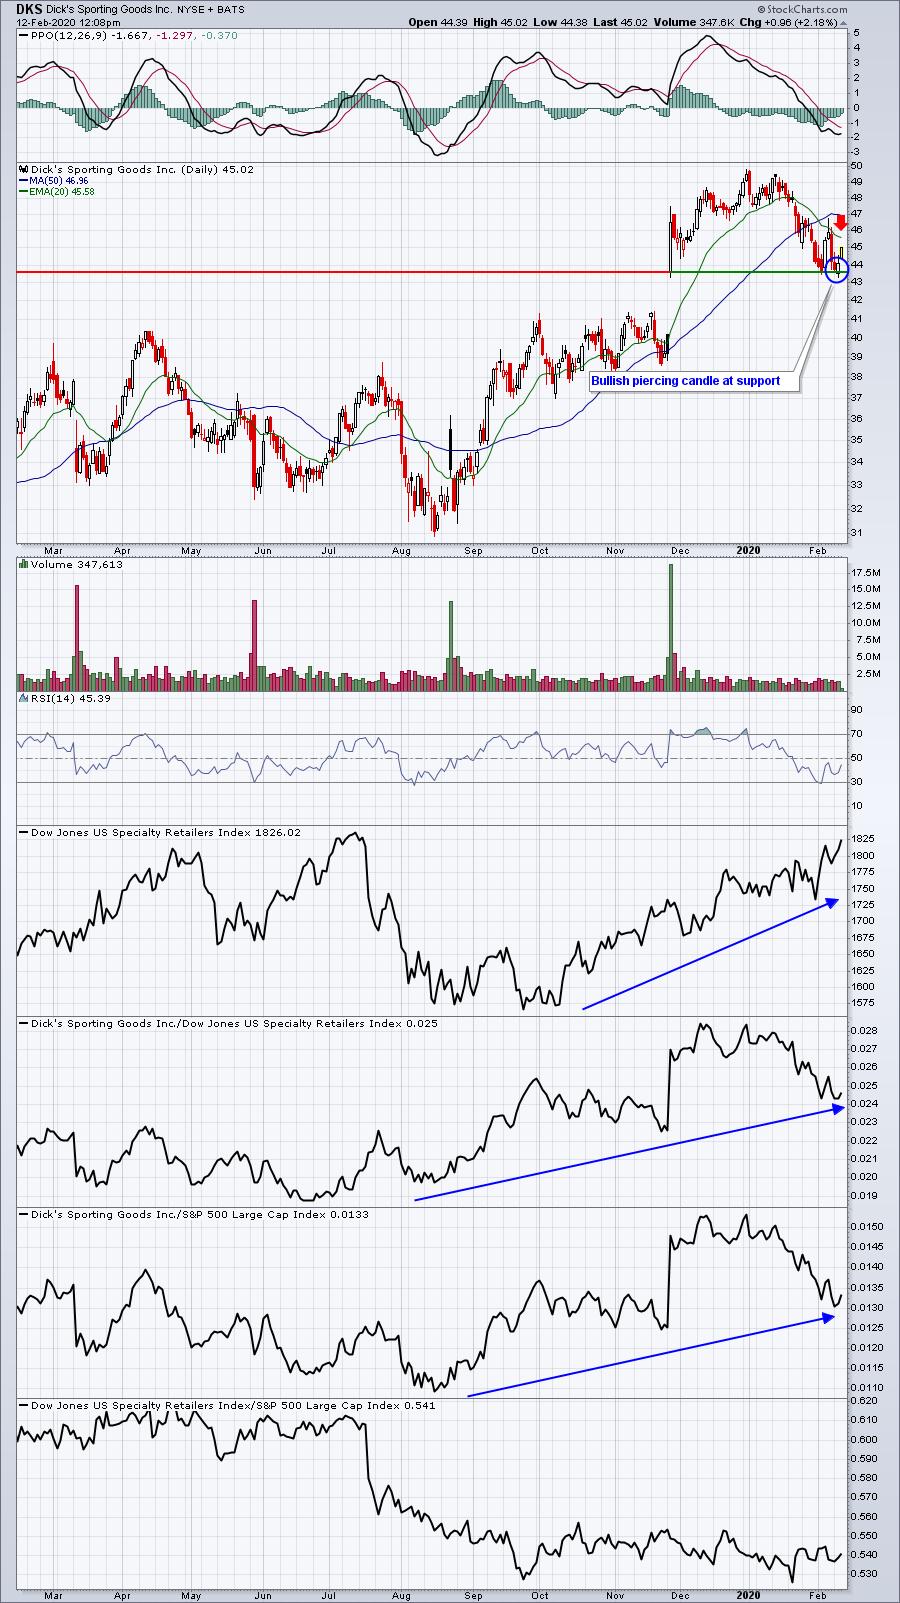
At the time of the alert yesterday, it appeared that DKS might be printing a bullish engulfing candle. As it turns out, we saw a bullish piercing candle instead. Nonetheless, both candles provide short-term bullish implications and we're seeing the result of that today.
Strong Earnings ChartList (SECL)
I reviewed the SECL for stocks with RSIs between 40-45 and there were 17 of them. CDMO is one of them and a biotech. Since I'm providing a lot of information today on biotechs, let's check it out:
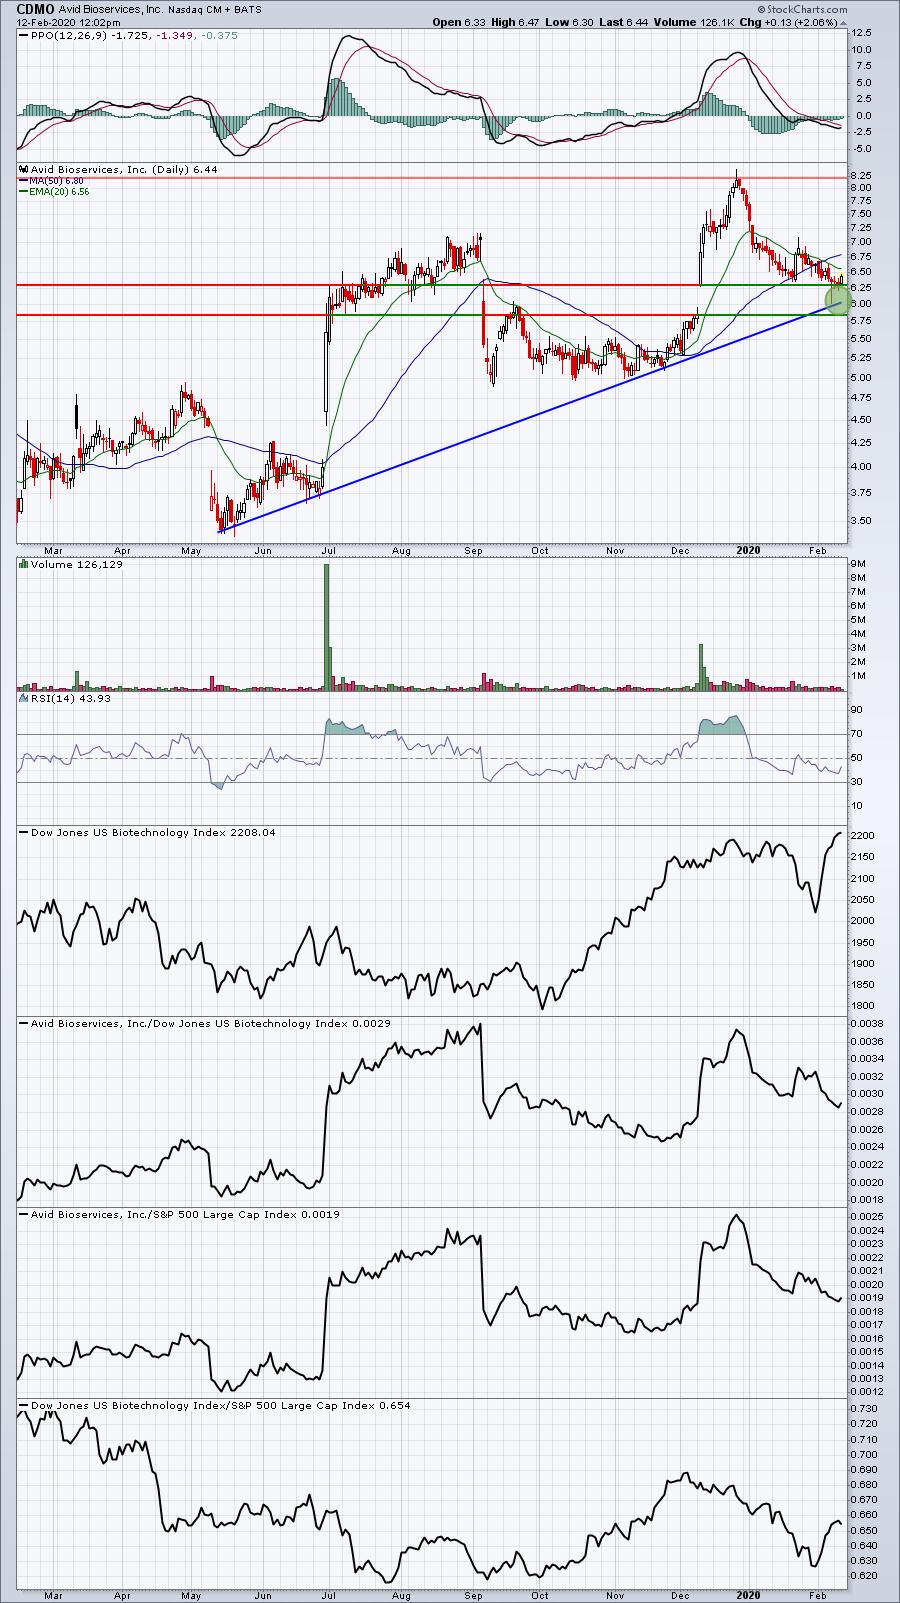
I believe I looked at CDMO recently when it printed that long tail to the downside and recovered. 5.80-6.30 seems like a very solid area of support and CDMO is attempting to rise off of this level. A move back above the 20 day EMA is what I'd be looking for. Increasing volume on that breakout would be icing on the cake.
Movers & Shakers
I was asked to provide potential trading candidates in the biotech area, so I'll take that opportunity here. First, biotechs can be a very volatile and aggressive group, so trading ETFs that track many stocks within the group probably makes more sense for many of our members. The two ETFs to consider are the IBB and XBI. The IBB is much more highly concentrated among a handful of large biotech names, so it's probably a bit safer in the sense that many companies invested in are much more recognizable names with many products. The top 10 holdings of the IBB represent roughly 50% of the ETF and include the following companies:
GILD, AMGN, VRTX, BIIB, ILMN, REGN, ALXN, SGEN, INCY, BMRN
The XBI, on the other hand, represents a much larger basket of biotech stocks. Therefore, it's a much more diversified portfolio, but will be populated by many more small cap biotech stocks. Small caps have been out of favor for the past 18 months, so that's another consideration. The top 10 holdings of the XBI represent less than 19% of the ETF with UTHR the largest holding at 2.02%.
I like both ETFs, it simply depends on your preference - larger, well-established holdings or smaller, more exciting (aggressive) names.
Individually, there are a number of biotechs that look strong to me. Here are several I'd consider:
VRTX:
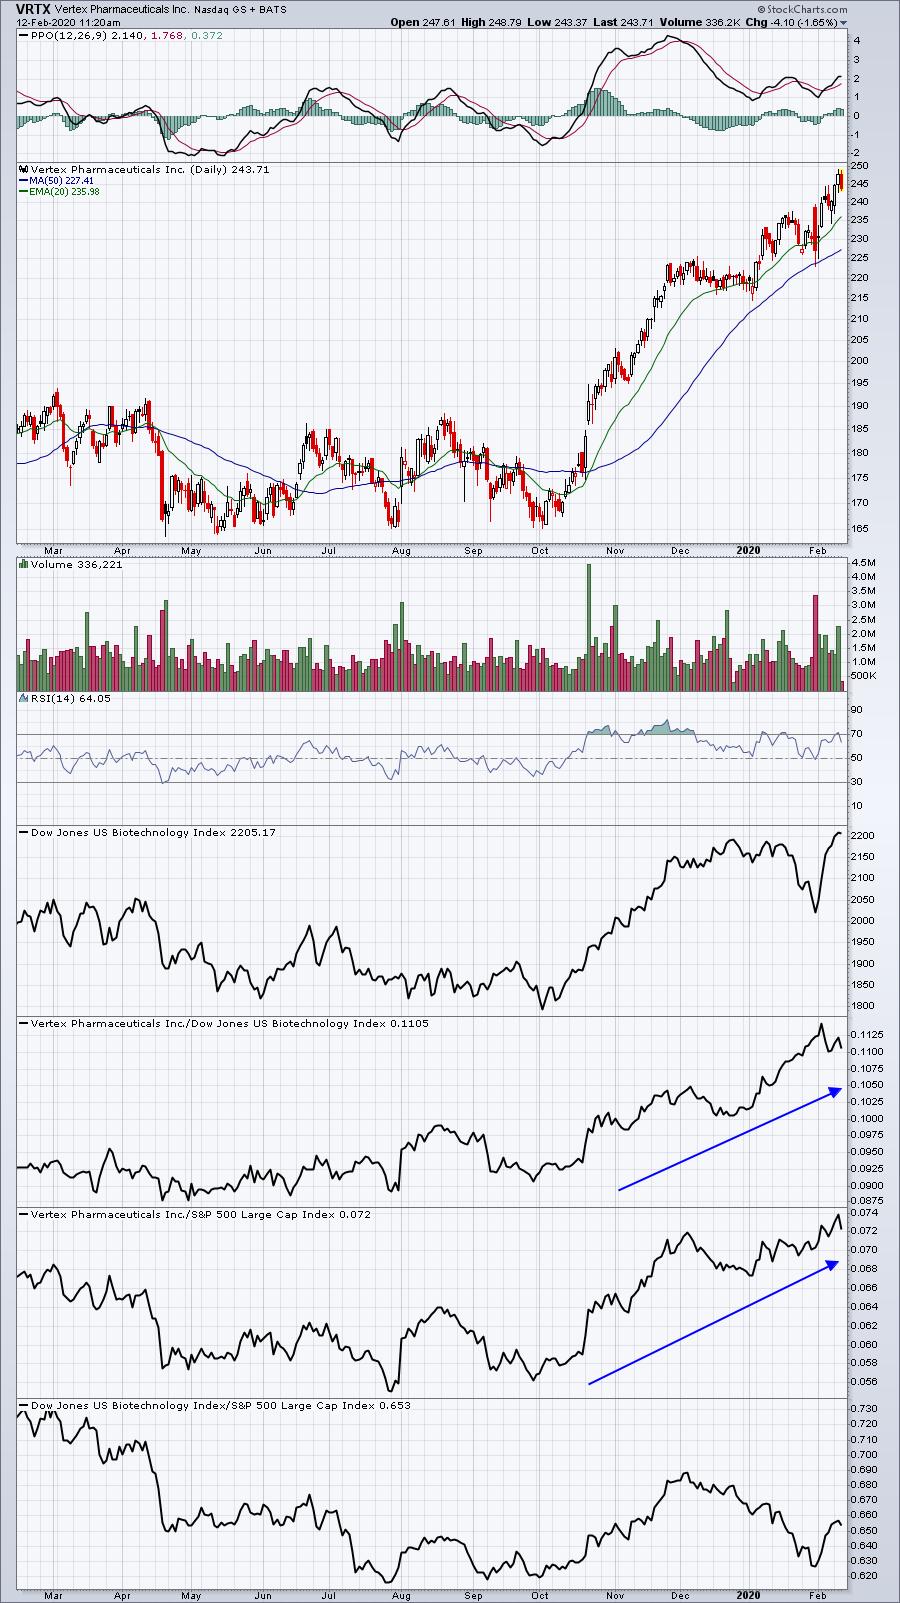
SECL stock. Great relative strength. Component stock of our Model portfolio. Weakness today is likely an opportunity.
REGN:
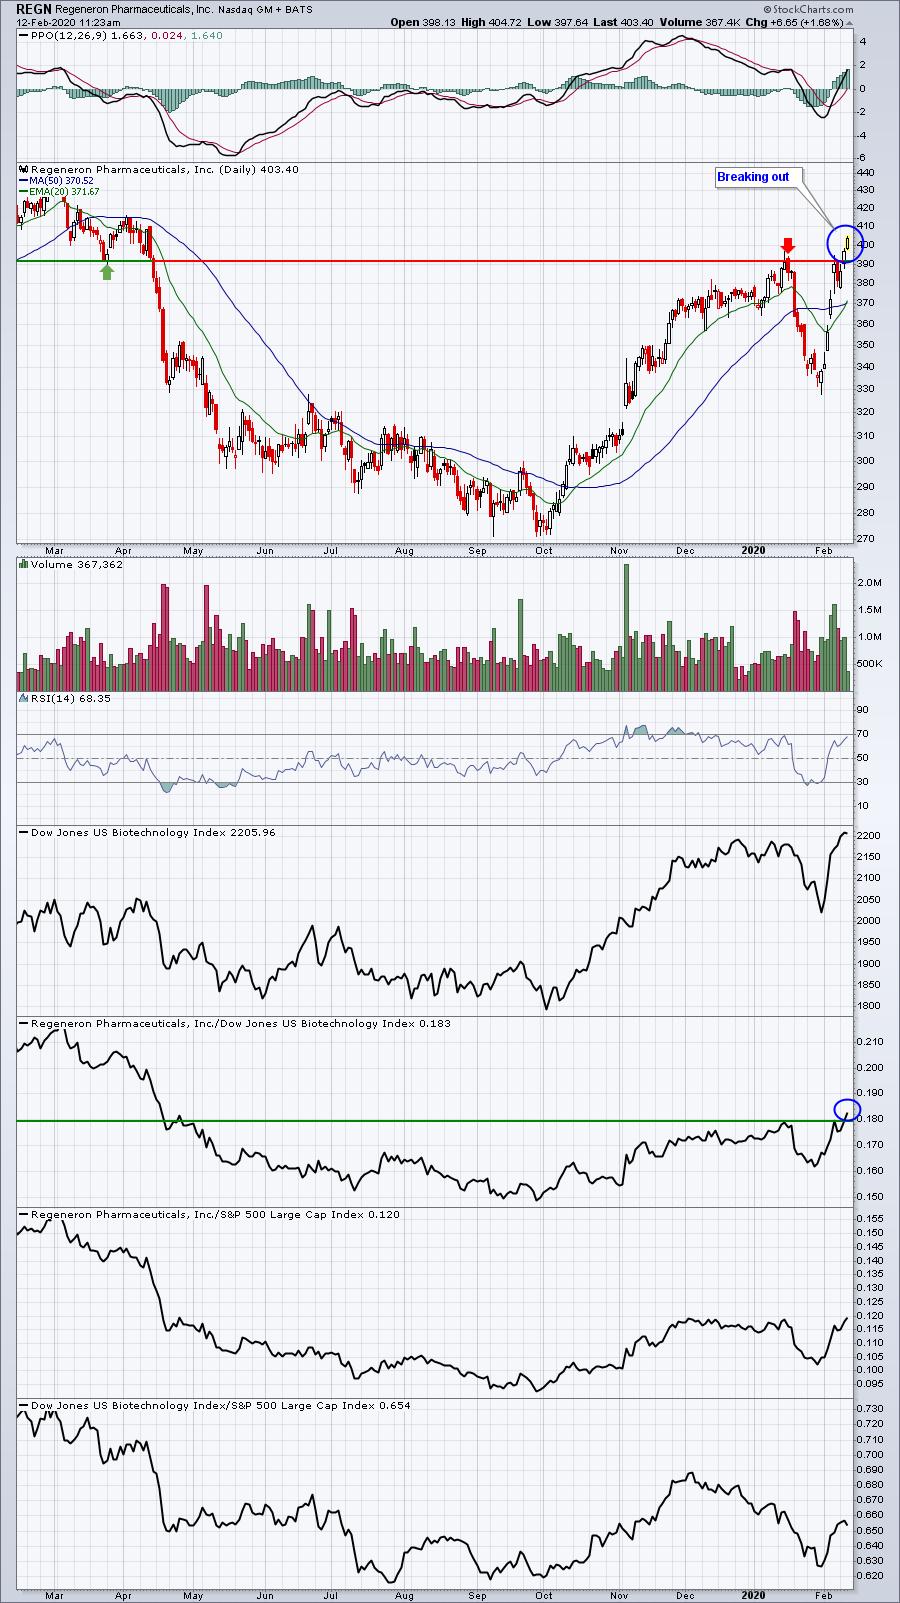
SECL stock. Breaking out on absolute and relative basis as blue circles illustrate.
ABBV:
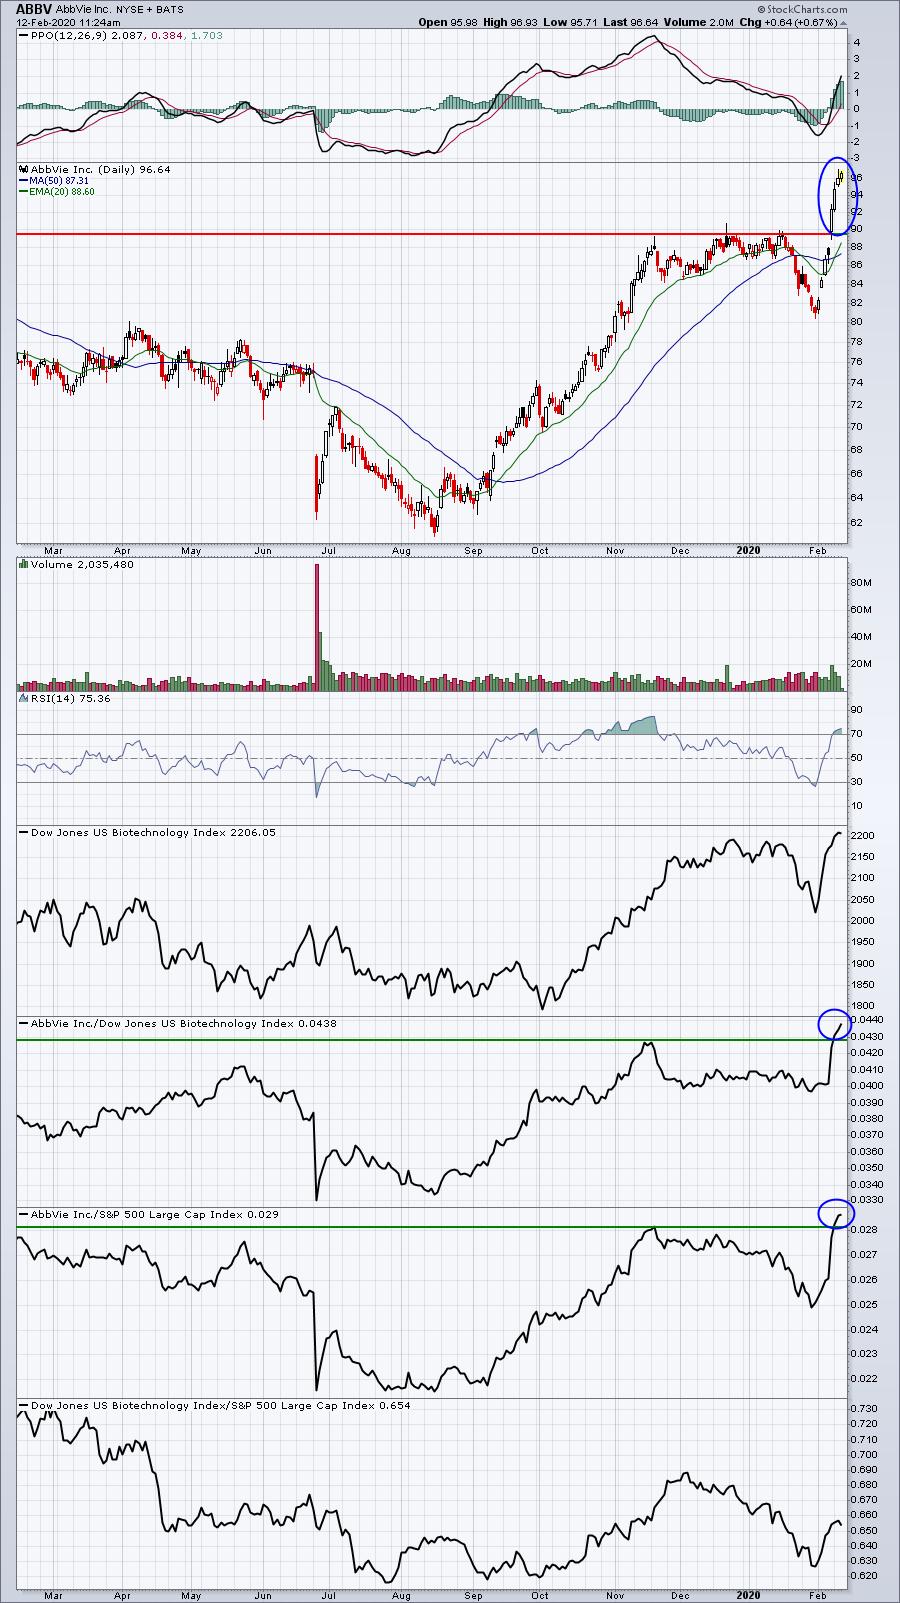
SECL chart. Excellent earnings reported last Friday. Breakout accompanied earnings on heavy volume. Emerging leader.
ALNY:
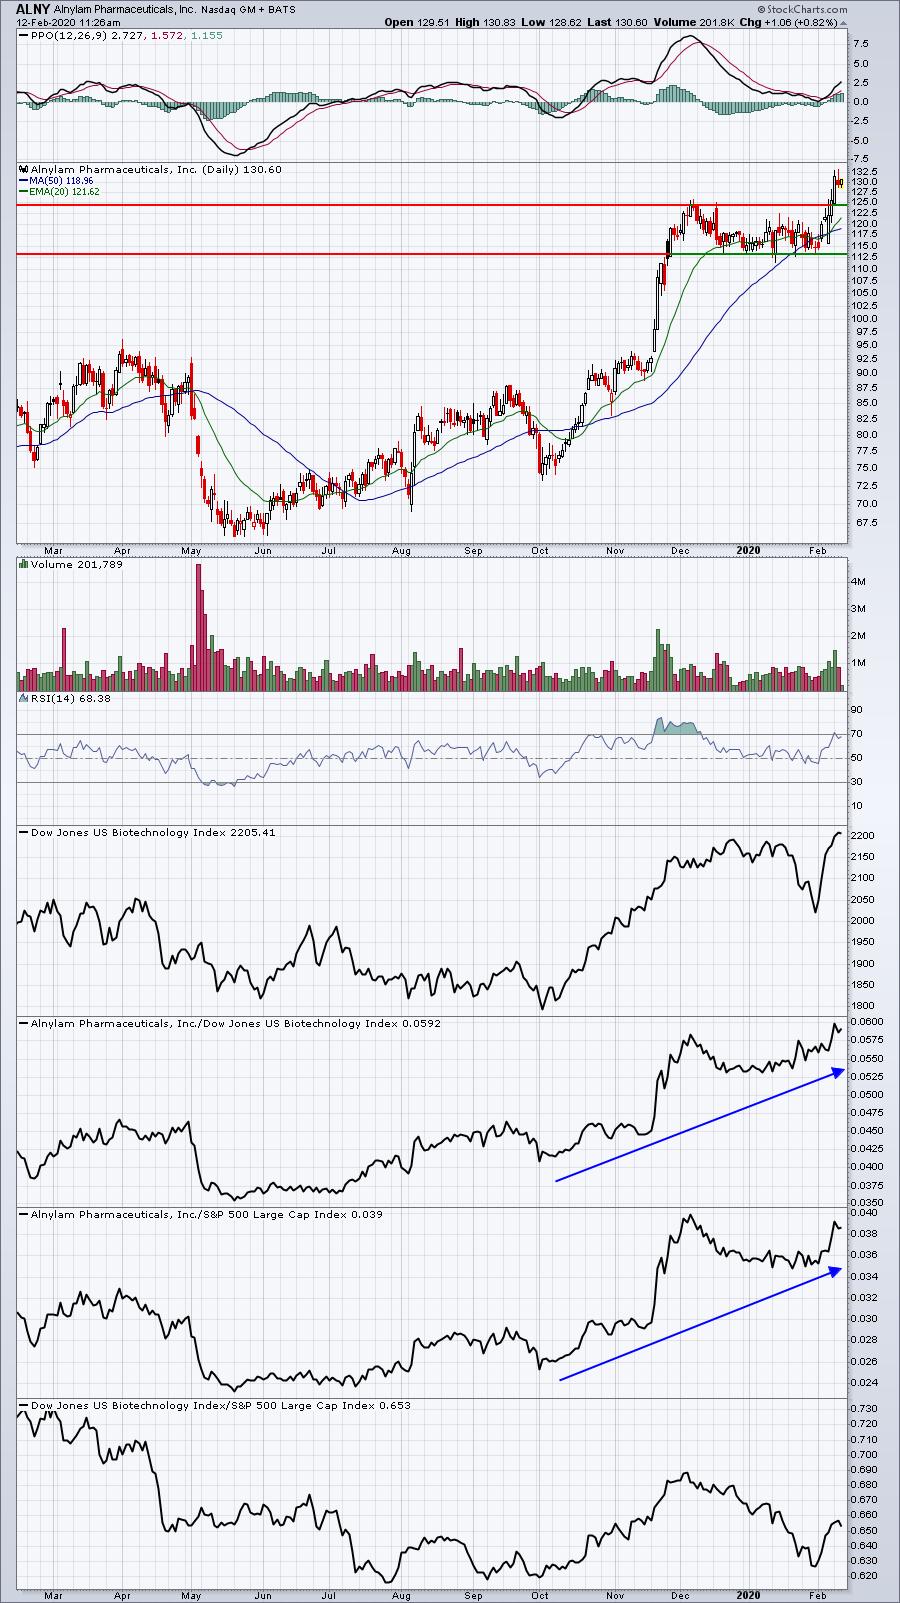
Just broke out of bullish flag pattern. Been a long-term relative strength winner in the group. Volume trends solid.
SGEN:
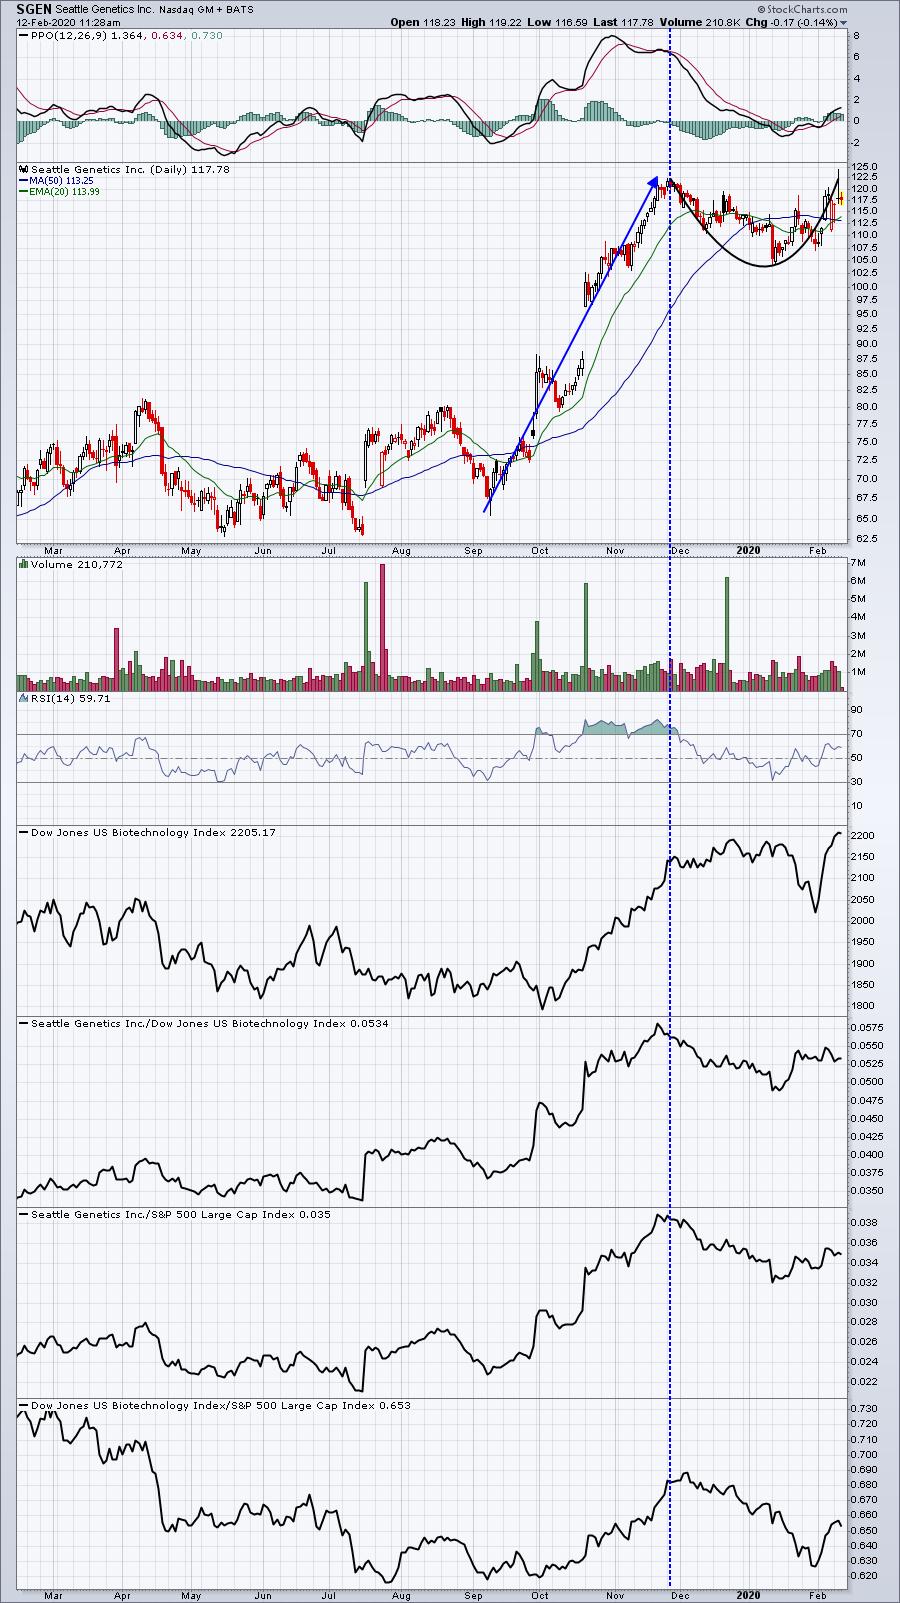
Consolidating in a cup after a massive uptrend. The vertical blue-dotted line shows that SGEN was a huge relative winner in this area when its price high was established. Has weakened on relative basis as it consolidates.
CRL:
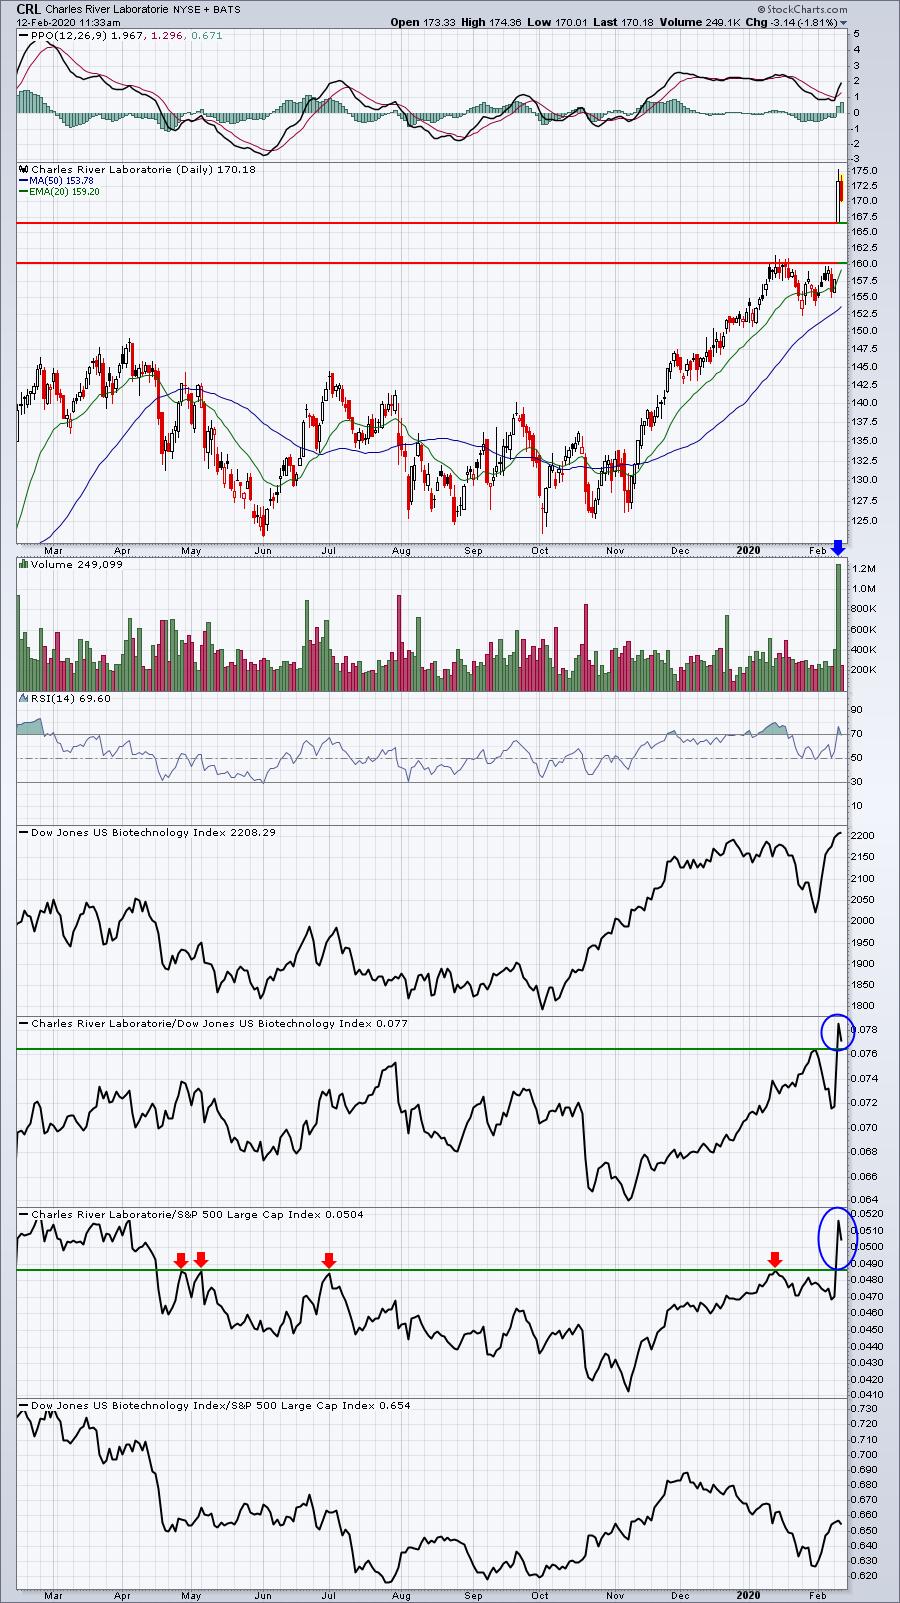
CRL had a huge day yesterday after reporting excellent earnings results. We're seeing profit taking today. There's a very good chance that the top of gap support at 166.57 holds as support. Note the relative breakouts.
ESPR:
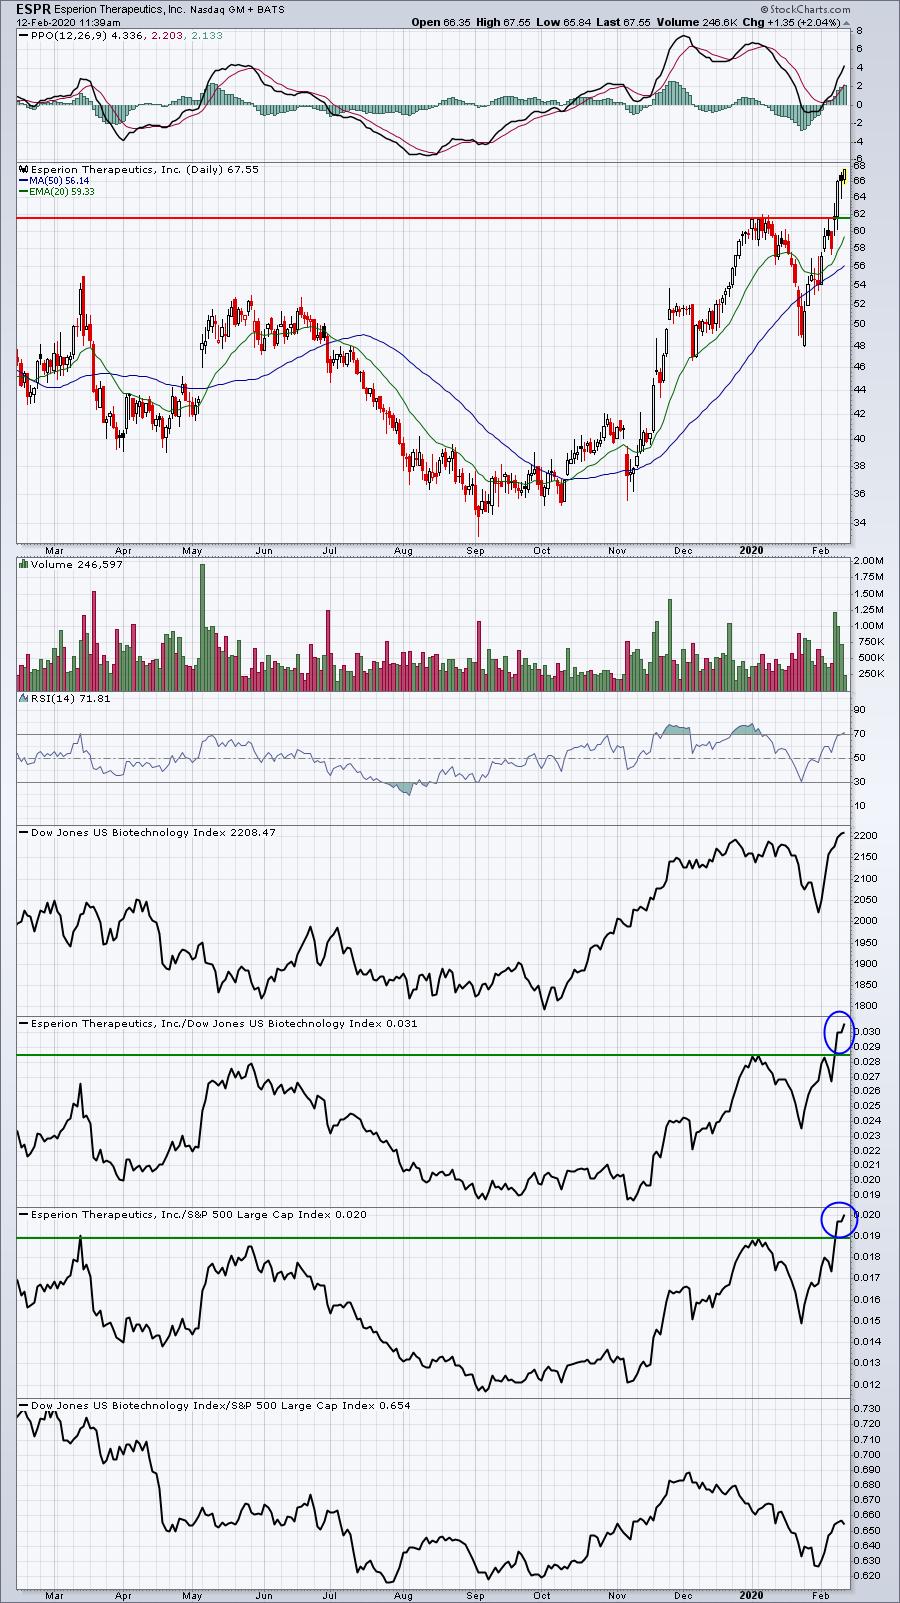
Volume trends are strong, but on weekly chart you'll see overhead price resistance closer to 80. Nice relative breakouts.
CLVS:
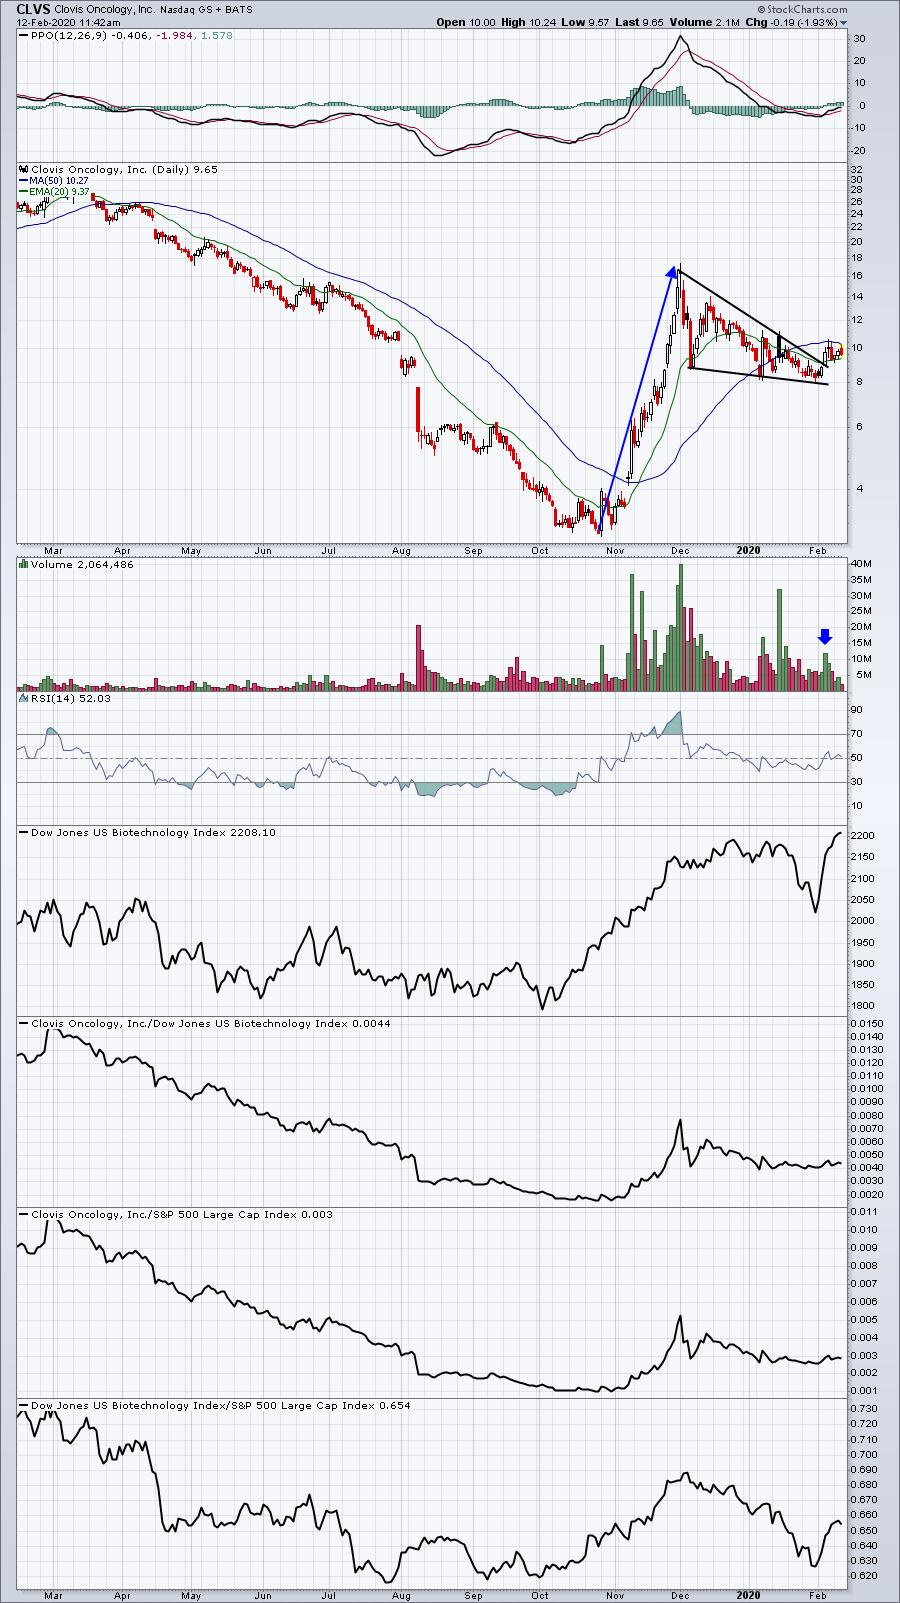
Huge performance in November, followed by a bull wedge. That appeared to broken last week on an increase in volume. A close back above the two key moving averages would be bullish confirmation. Very aggressive trade.
MNKD:
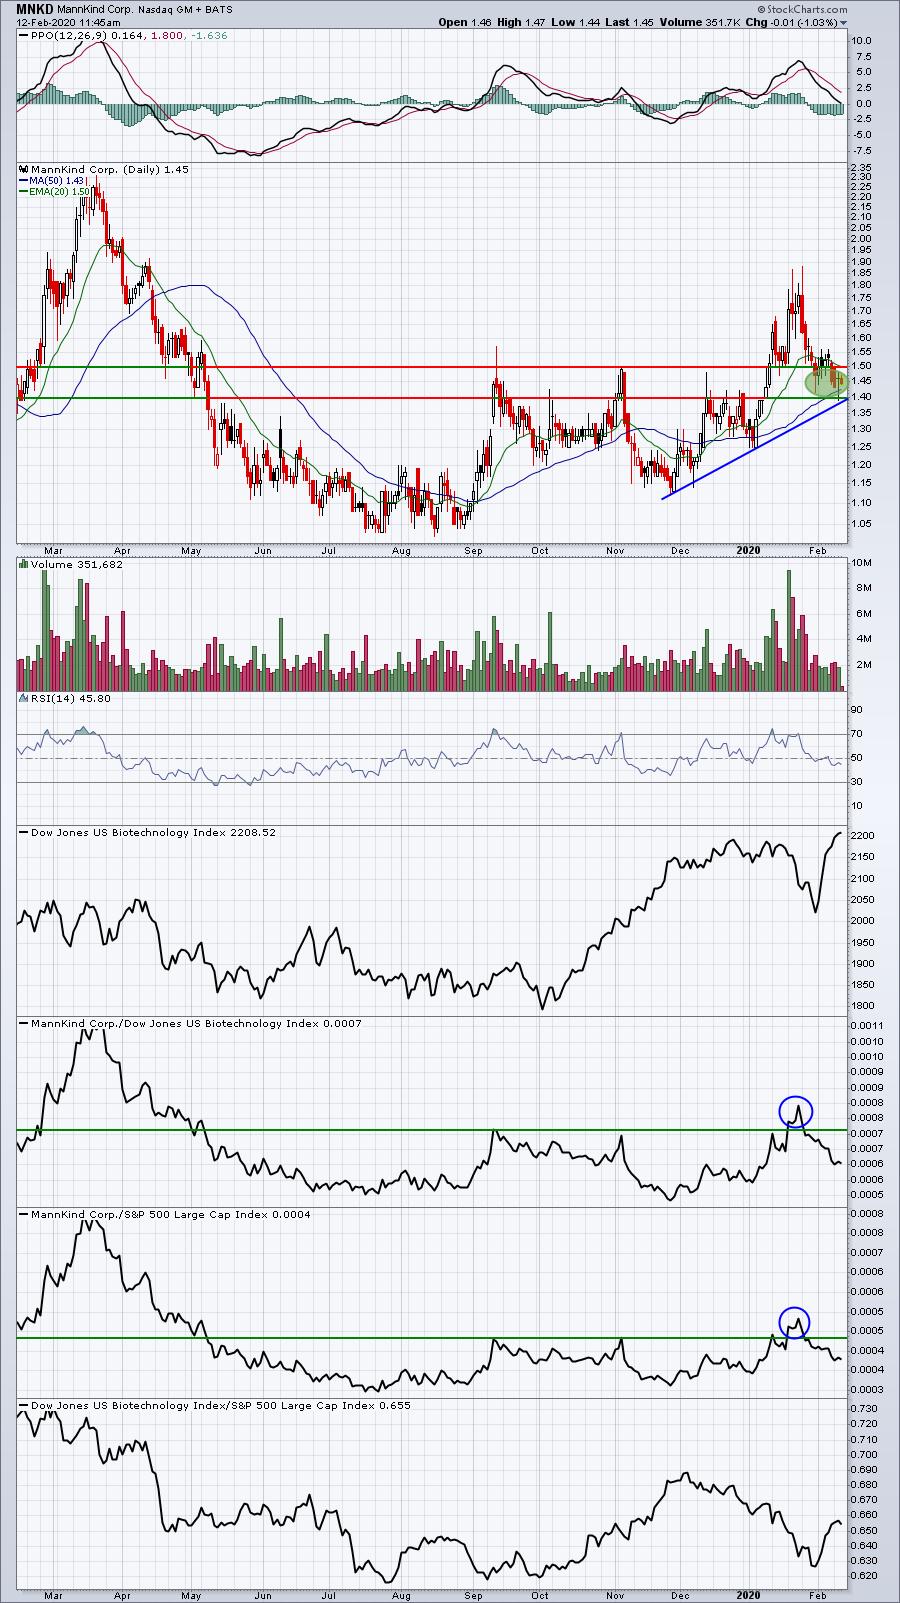
1.40-1.50 was difficult price resistance on the way up, but it was cleared with very heavy volume to confirm. Now MNKD has pulled back into that 1.40-1.50 price support, while also testing its recent uptrend line. Another aggressive stock trade, but at least this one has pulled back.
VBIV:
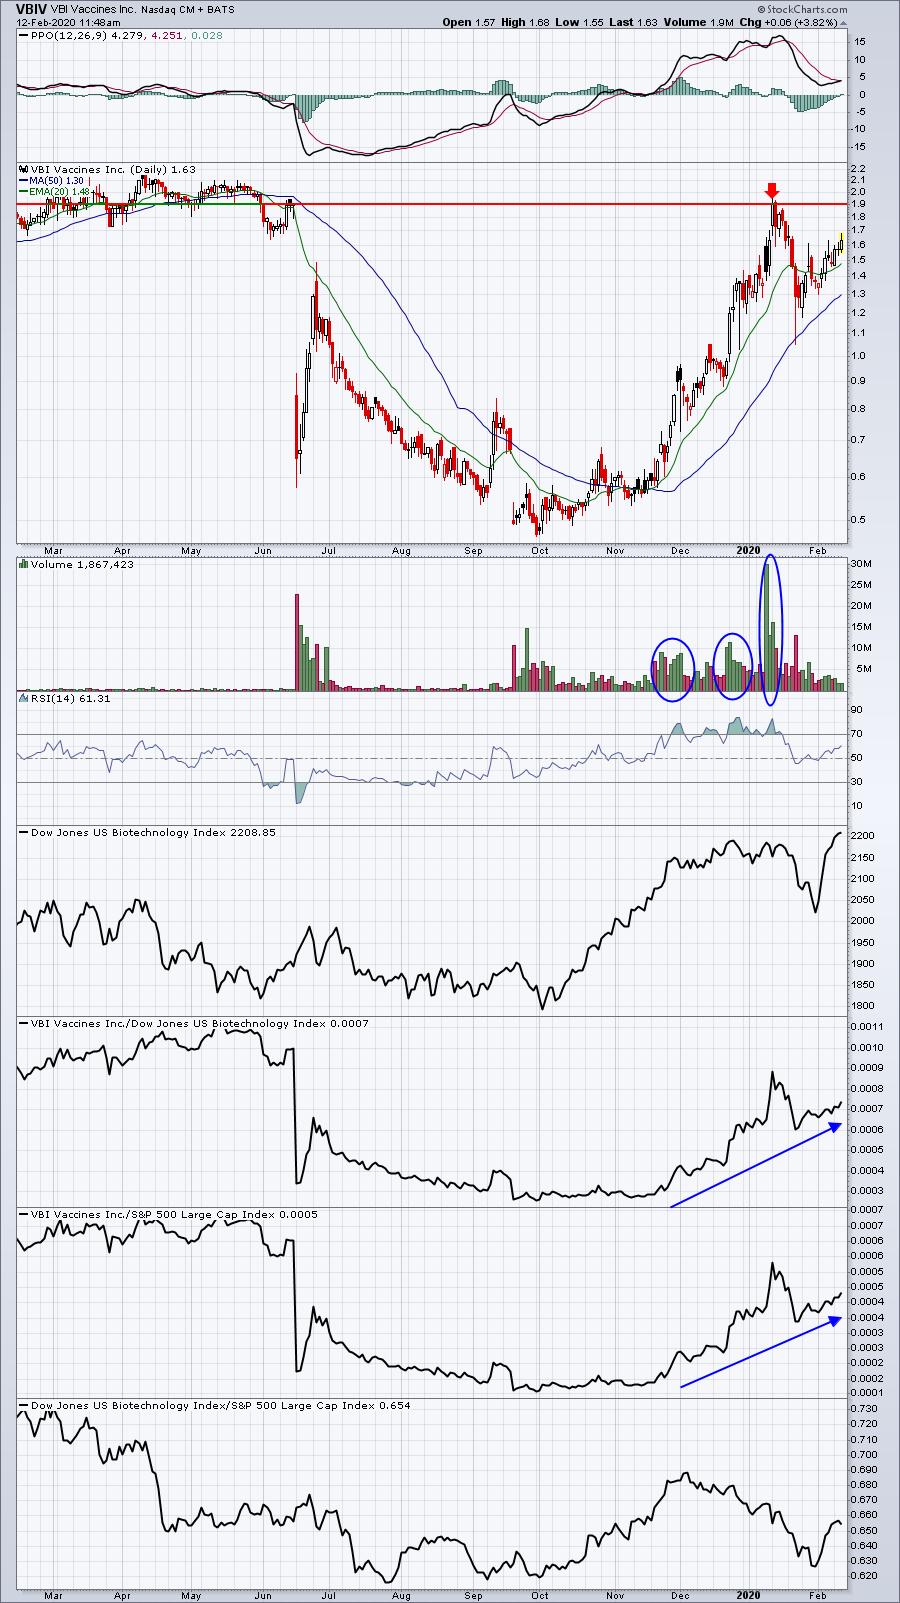
The red arrow shows the difficult getting through a major gap resistance, but after pulling back, VBIV is at it again - moving higher on solid volume. This one is extremely aggressive, but the volume trends are strong and relative strength is bullish. Any time you trade a small individual biotech company, however, you always risk the possibility of an unfavorable FDA announcement, which can crush a stock like this. For that reason, this should only be considered by those with a very high appetite for risk.
Earnings Reports
Here are the key earnings reports for this week, featuring stocks with market caps of more than $10 billion. I also include a few select companies with market caps below $10 billion. Finally, any portfolio stocks (or active trade alerts) that will be reporting results are highlighted in BOLD. Please make sure you check for earnings dates for any companies you own or are considering owning:
Wednesday, February 12:
CSCO, CVS, CME, GPN, AMAT, SHOP, MCO, EQIX, MFC, WELL, GOLD, IQV, SLF, WCN, CDNS, EFX, ATUS, MGM, SSNC, CTL, IFF, NLY, NTAP, TEVA, TYL, TAP, CVE, TRMB, REG. Others less than $10 bil: MRO, IPG, AVLR, CYBR, TRIP
Thursday, February 13:
BABA, PEP, NVDA, LIN, FIS, DUK, ZTS, WM, TRP, AIG, BCS, KHC, RSG, CCEP, DLR, DXCM, FTS, LH, ANET, INCY, EXPE, ROKU, AEM, DDOG, ZBRA, FNF, LBTYA, WST, GDDY, BIO, HII, NICE, BKI. Others less than $10 bil: MHK, AYX, IPGP, GNRC, TPX, HUN, YETI
Friday, February 14:
AZN, ENB, PPL, YNDX. Others less than $10 bil: NWL, CGC
Economic Reports
None
Happy trading!
Tom