
EB Daily Market Report - Thursday, February 20, 2020
Executive Market Summary
- Futures were slightly lower this morning, but our major indices battled back into positive territory before selling off with much more velocity
- The Dow Jones is off 1%, or nearly 300 points; other indices are following suit
- Technology (XLK, -1.78%) and communication services (XLC, -1.56%) are the weakest sectors
- Automobiles ($DJUSAU, -2.75%), specialty finance ($DJUSSP, -2.38%) and semiconductors ($DJUSSC, -2.47%) are among the weakest industry groups
- Safe havens are benefiting today - gold ($GOLD), real estate (XLRE), treasuries
- The 10 year treasury yield ($TNX) has fallen another 6 basis points to 1.51% as the bond market begs for an interest rate cut
- We have one active trade alert, which is trading just beneath its closing stop of 43.25
Market Outlook
We're near options expiration Friday (tomorrow), the market's been very strong, and those trading options have once again grown quite bullish as the 5 day SMA of the equity only put call ratio ($CPCE) yesterday neared a key low. On top of that, we're in the 19th to 25th calendar month period where the market's tendency is to drift lower. No one should be surprised that there's some selling today. Take a look at the following long-term equity only put call ratio ($CPCE), however. I like to smooth it out over 5 days as it can be quite volatile day-to-day. But if I stretch out this $CPCE reading to weekly readings instead of daily, we don't see quite the same overwhelming bullishness that we did in January:
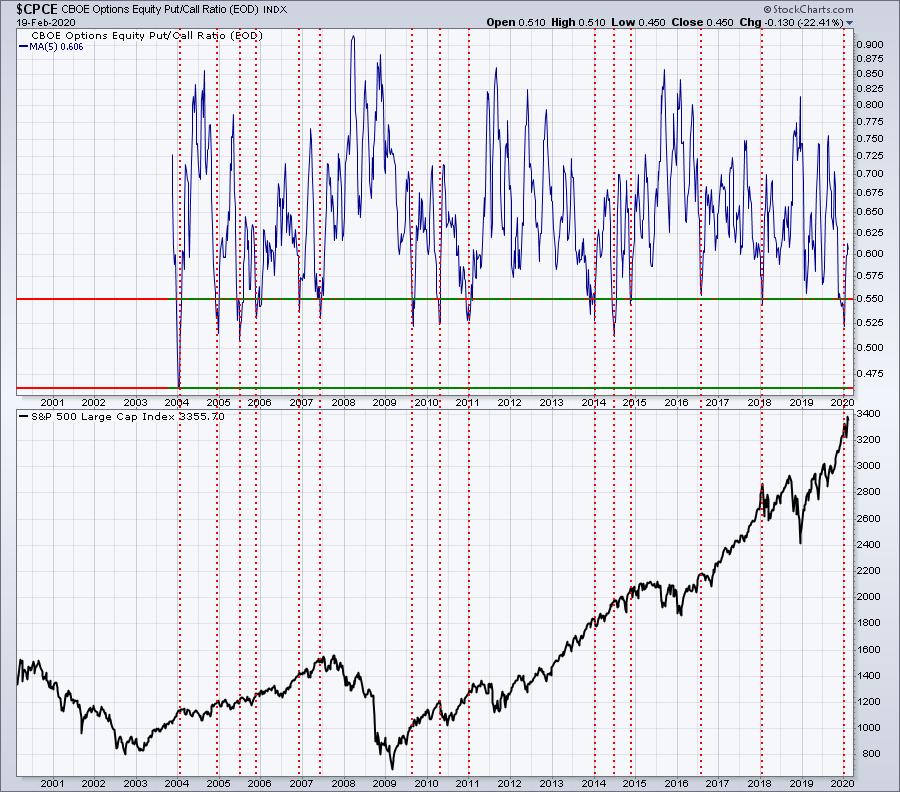
Those red-dotted vertical lines mark periods when the 5 week SMA CPCE readings fall to .55 or below. I would not view these readings, when they occur, as a major market top. Instead, they're simply a warning sign that sentiment may have moved too far in the bullish direction. Many times, a just a quick bout of selling or consolidation is enough to scare folks holding calls as option values can deteriorate very quickly.
My point is that the S&P 500 already sold off after that low January CPCE reading. I wouldn't necessarily bet on a further drop in the S&P 500. Sure it could happen, but other signals really don't line up with a major selloff. I'm expecting mild selling and consolidation before new highs print.
Sector/Industry Focus
Specialty finance ($DJUSSP), as I mentioned in the Executive Summary above, is having a rough day. Clearly though, this has been one of the best performing industry groups in 2020 thus far. Normal pullbacks during uptrends typically result in 20 day EMA tests. We've already seen several of these tests since the group began rallying hard back in October. Unfortunately, trying to time 1-3 day selloffs is a very difficult practice to master. Here's the current chart:
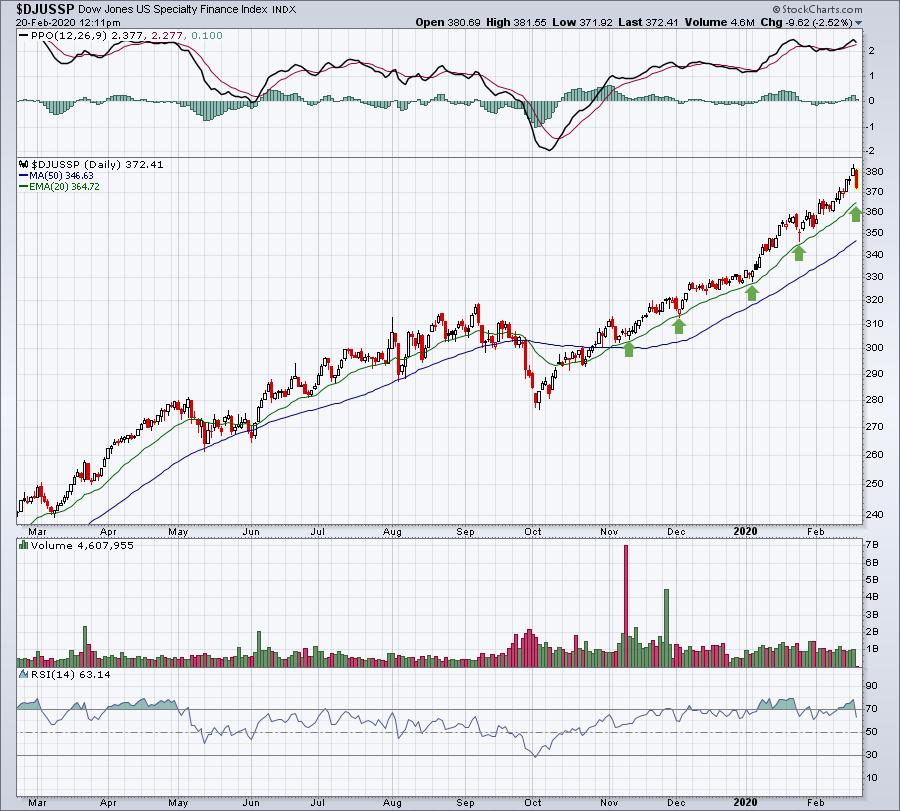
You can see that the RSI has spent a lot of time in the 70-80 range in 2020. This is welcome relief.
Active Trade Alerts
Currently, we have one active trade alert, as follows:
DKS (-0.74%) - reports its next earnings on March 10th. DKS struggled, and ultimately failed, at its key 20 day EMA resistance. Now, it's showing resiliency as it tests price support at 43.25. It did open today beneath 43.25 and it's now traded intraday below 43 for three days in a row. Remember, our closing stop is at 43.25, so any close beneath 43.25 and it comes off with a small loss.
Strong Earnings ChartList (SECL)
Our SECL now has 320 charts in it. I sorted the list in SCTR order, highest to lowest, and looked to see which of the highest ranked stocks were being hit to see if perhaps we might have a couple trading opportunities. First, here's the list I was looking at:
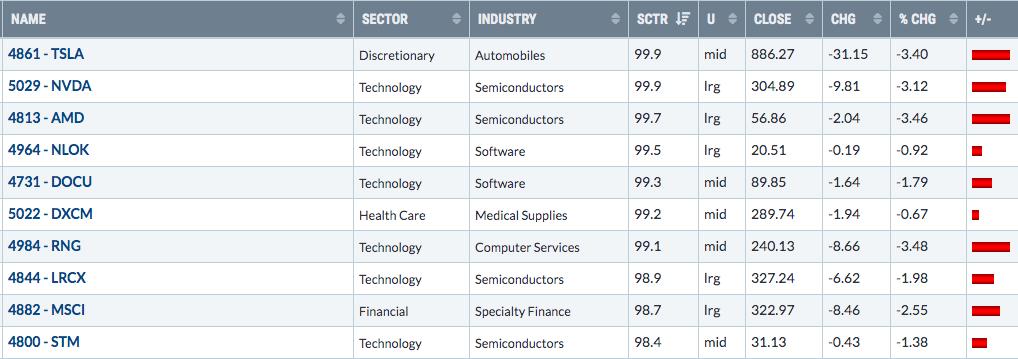
It's rather clear to me that today's selling definitely features many of the stocks that have been leading the market higher in 2020. It's also quite likely that there are a ton of in-the-money calls on several of these names, which is adding to the short-term problem. Because options expiration issues could be with us for a few more days, if I were to trade any of the names above, I'd consider slowly building a position as we could see more short-term weakness. Here are my two favorites on the list above that were not already discussed in last night's Top 10 Stocks webinar:
NVDA:
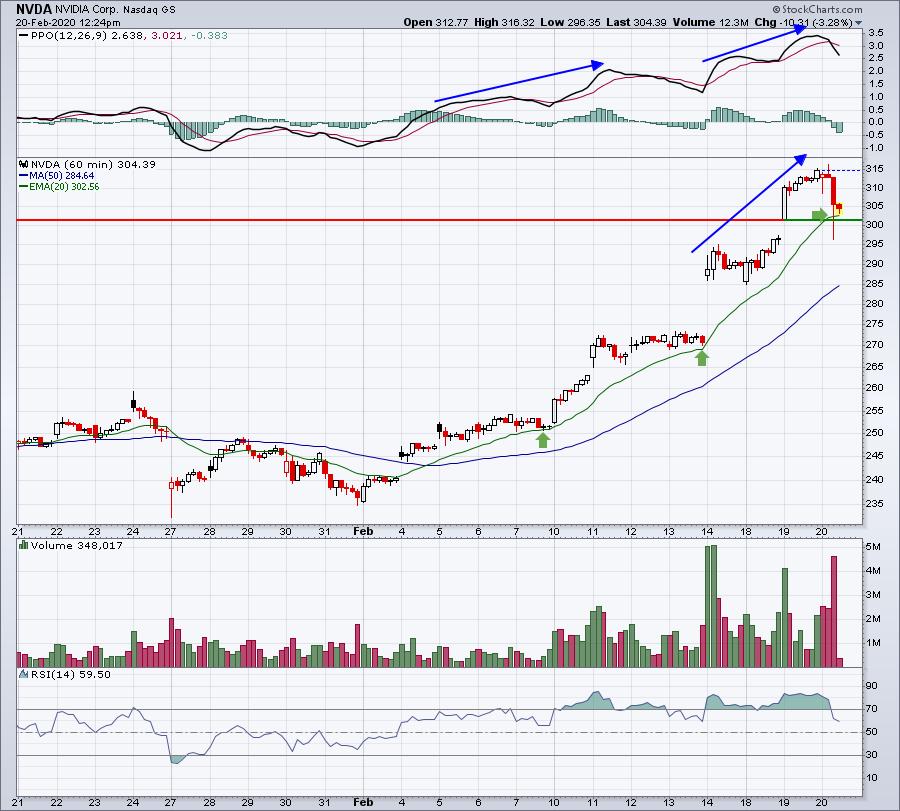
When the hourly PPO continues to rise on each price high, the 20 hour EMA tends to hold as support. Therefore, until proven otherwise, at least an initial position could be taken on NVDA at that 20 hour EMA. If that fails to hold, then the next area to watch would be the 50 hour SMA and price support, both of which are currently near 285.
NLOK:
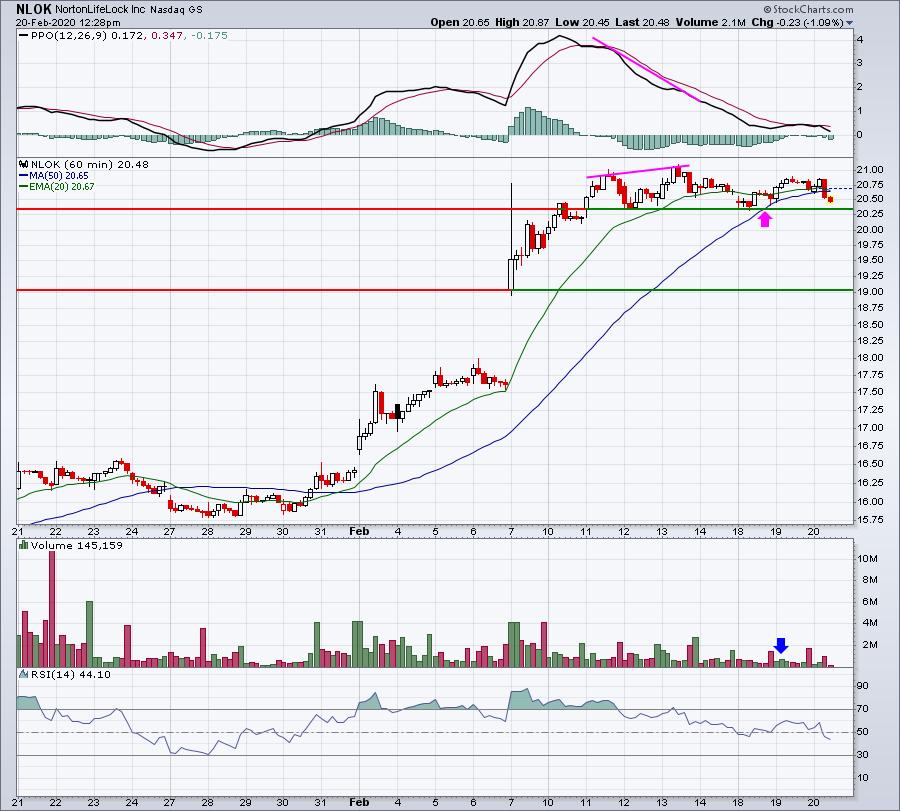
Do you see the difference in NLOK's short-term hourly chart? Here there's a clear negative divergence that helped to stall progress on the chart. Also, the last attempt to move higher was accompanied by much lower volume (blue arrow). Now NLOK has key price support around 20.30. If that support level is lost, there's a much greater short-term risk of a trip down to test key gap support just above 19.00.
Movers & Shakers
I looked at a couple of the big SCTR movers (lower) and found the following charts interesting:
IDXX:
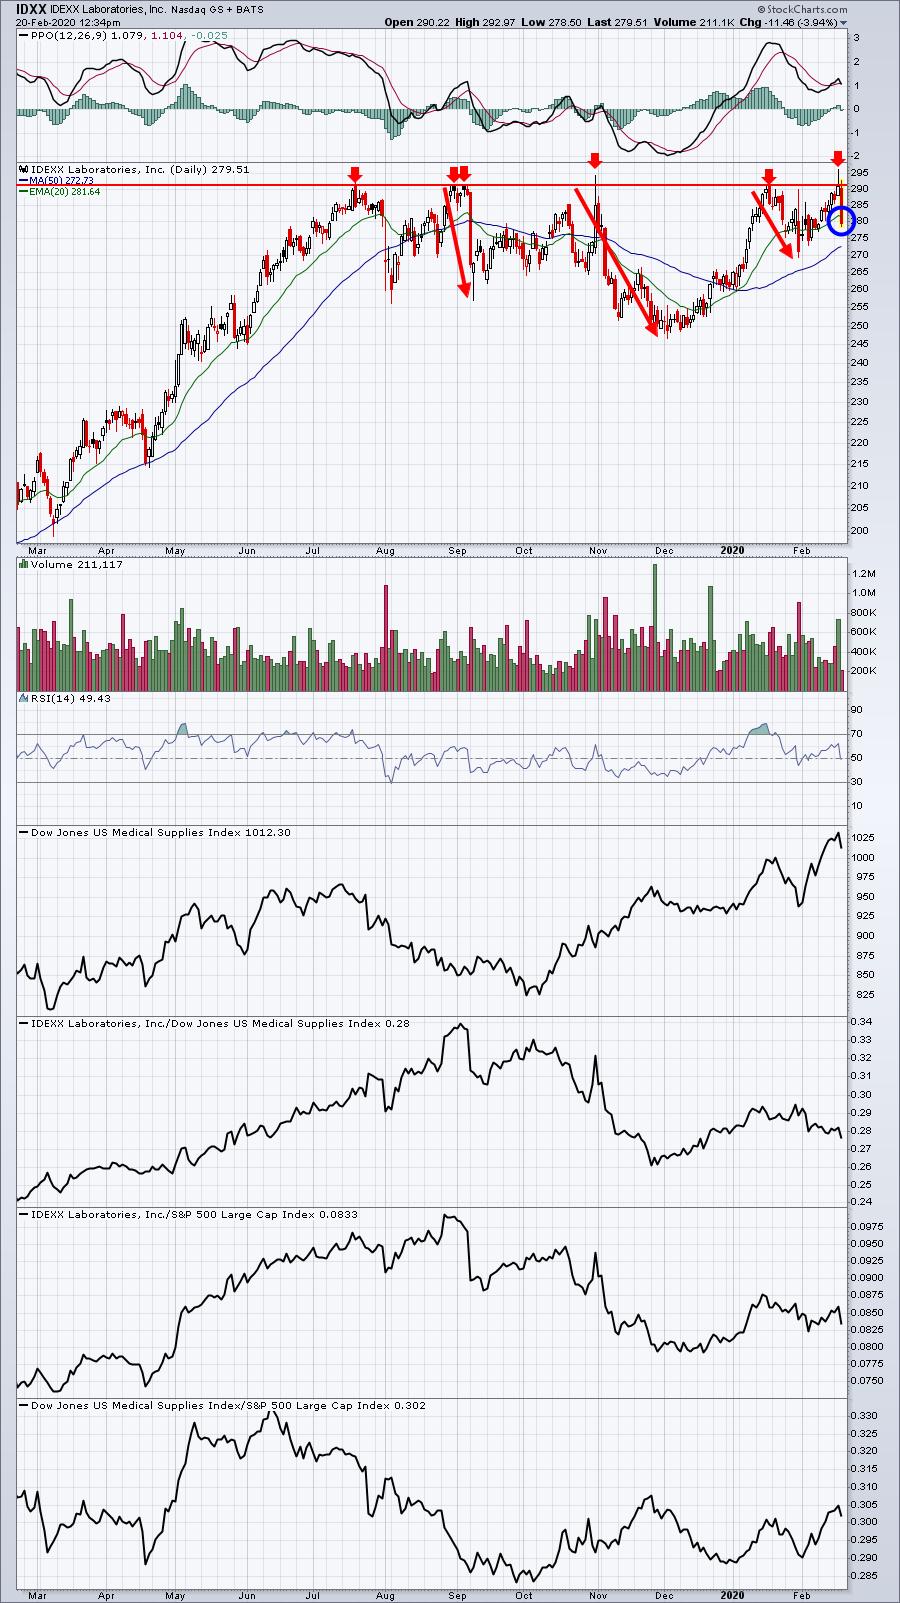
There might not be anything more difficult for some traders than to sell a winning position. Even if your intention was to sell IDXX at 291 when you bought it, when it makes that move higher, you're playing with house money and it emboldens you. But that candle yesterday needs to always be respected. You can see how many times IDXX failed at that 291 level. On very heavy volume yesterday, IDXX was in breakout mode, trading over 296 intraday. Failure to close the deal is a MAJOR warning sign. I've circled the 20 day EMA in blue. If this is truly THE uptrend that results in a breakout, the 20 day EMA should hold at today's close. If short-term moving averages do not hold, it's a signal that the period of consolidation lingers on.
If you're a short-term trader, you MUST respect these reversals/turning points on charts.
QRVO:
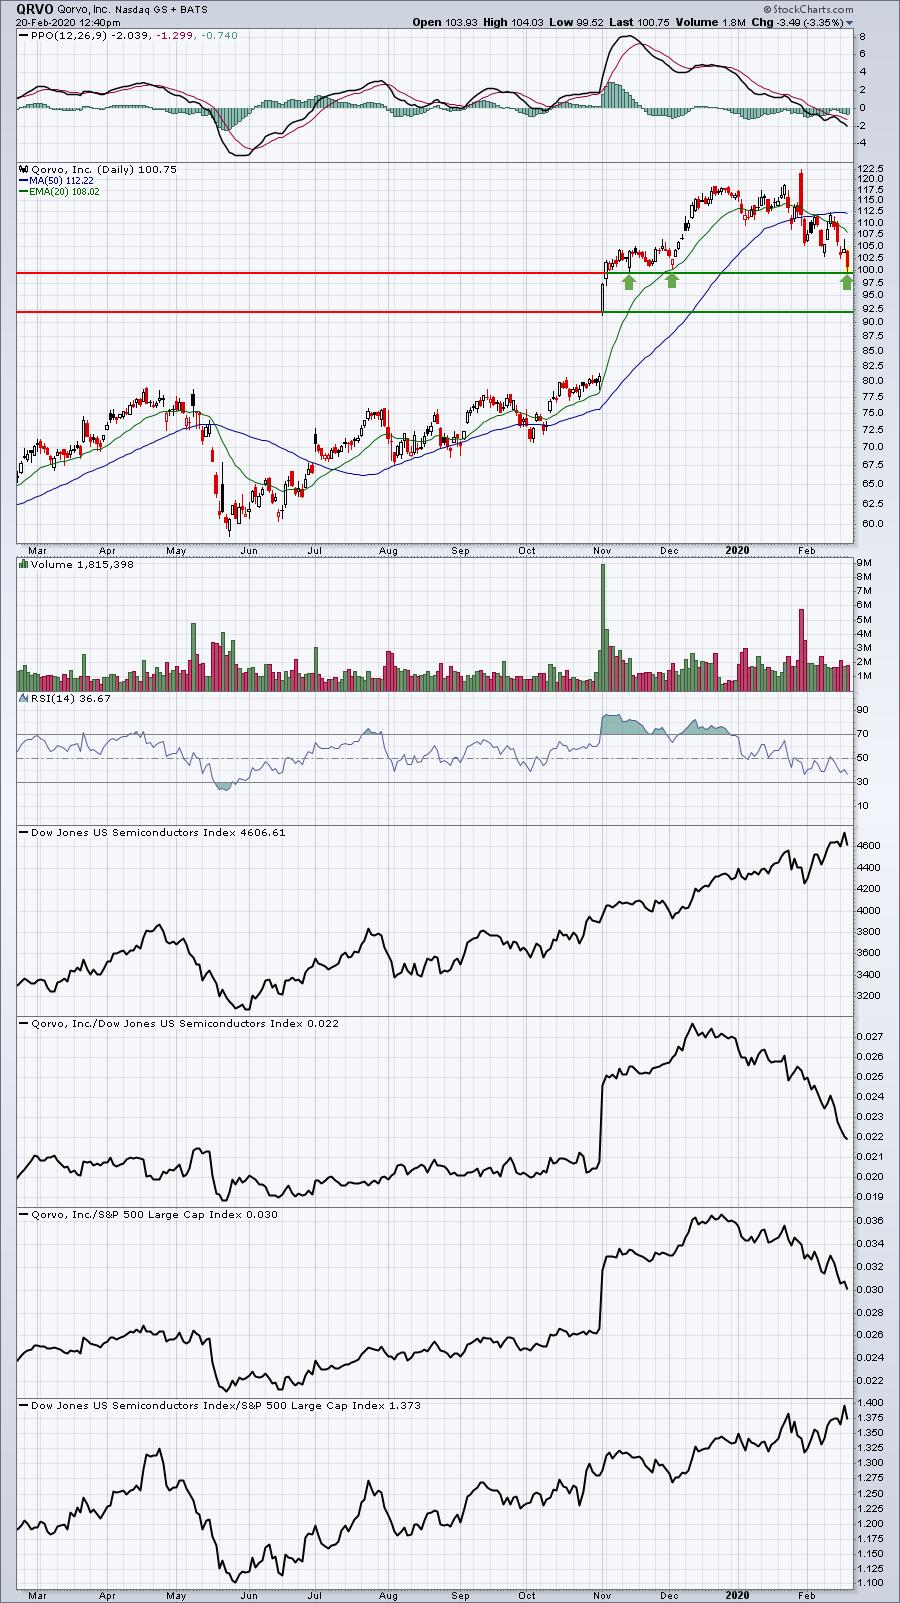
QRVO delivered one of the best quarterly earnings reports over the past couple months, in my view. After gapping higher to open near 122, QRVO has fallen significantly to test a key price support level near 100. I believe accumulating QRVO from 100 down to 92 or so makes a lot of "reward to risk" sense.
Earnings Reports
Here are the key earnings reports for this week, featuring stocks with market caps of more than $10 billion. I also include a few select companies with market caps below $10 billion. Finally, any portfolio stocks (or active trade alerts) that will be reporting results are highlighted in BOLD. Please make sure you check for earnings dates for any companies you own or are considering owning:
Thursday, February 20:
SO, AEP, NEM, SBAC, ED, ES, HRL, VTR, TFX, CIB, VIAC, EPAM, VICI, DPZ, NCLH, GLPI, HSIC, LKQ. Others less than $10 bil: LAMR, OLED, ZS, DBX, FSLR, NUVA, APPN, AAN, EHTH, ACIA, VC, FIT, HEES
Friday, February 21:
RY, DE, MGA, WPC, PNW. Others less than $10 bil: ITT, CFX, B, HMSY, SOGO
Economic Reports
Initial jobless claims: 210,000 vs. 211,000
February Philadelphia Fed business survey: 36.7 vs. 12
January leading indicators: +0.8% vs. +0.3%
Happy trading!
Tom