
EB Daily Market Report - Friday, February 21, 2020
New Feature
Under "Earnings Reports" near the bottom of each day's DMR, I am beginning to highlight relative strength leaders that will be reporting earnings the next day. Those stocks will be highlighted with an asterisk (*).
Executive Market Summary
- Futures were lower this morning and there's definitely been a downward bias throughout the session
- Gold ($GOLD) is benefiting from increased fear levels - volatility is discussed below
- Crude oil ($WTIC) has backed off from $54 per barrel
- The 10 year treasury yield ($TNX) is approaching major yield support, down 5 basis points to 1.47%
- The stock market is also defensive today with real estate (XLRE), consumer staples (XLP), and utilities (XLU) the only sectors in positive territory
- Technology (XLK, -1.90%) is being hit the hardest, led by selling in semiconductors ($DJUSSC, -2.51%)
- We have one active trade alert, which is trading just beneath its closing stop of 43.25
Market Outlook
The S&P 500 is getting its first key test on its daily chart. When an index, a sector, an ETF, a stock, etc. shows accelerating momentum in the form of a rising PPO, I look for 20 day EMA tests to hold. Therefore, I wouldn't be surprised at all if U.S. equities move higher off of today's earlier low:
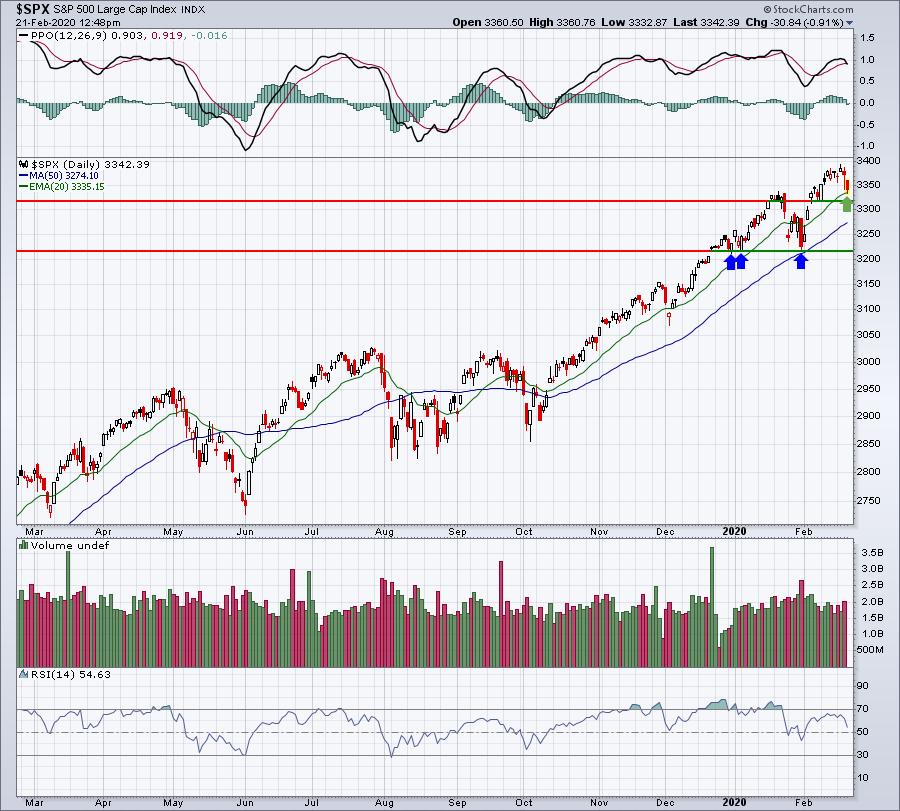
The green arrow marks the 20 day EMA support being tested today. The initial horizontal line is the first line of price support defense of the bulls. After clearing the January high, we pulled back and established price support just below 3320. If we fail to hold both of these support levels, then we could see an acceleration of selling down to a much more significant intermediate-term price support level near 3215. This level is important not only on the daily chart, but it also coincides with the rising 20 week EMA as illustrated below:
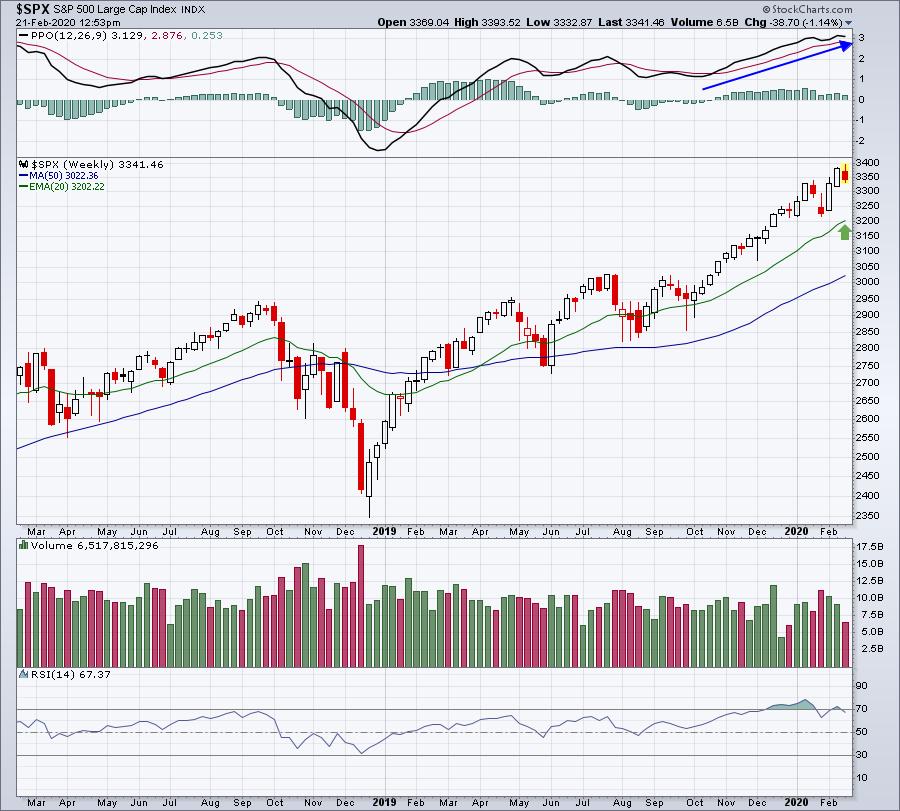
While I am extremely bullish U.S. equities over the balance of 2020 and beyond, knowing for certain in the short-term how much selling we might experience is difficult. We are in the 19th to the 25th period of the calendar month, which historically has a tendency to move lower. The Volatility Index ($VIX), featured below, is on the rise and that means traders are growing more nervous. Quick selloffs occur as the VIX gets higher and higher, so there's a chance we see selling escalate. Personally, I'd use weakness to accumulate the best stocks, the recent leaders. Consider the portfolio stocks that were added earlier this week as possible trading candidates, along with stocks featured below.
Sector/Industry Focus
Let's take a look at the VIX:
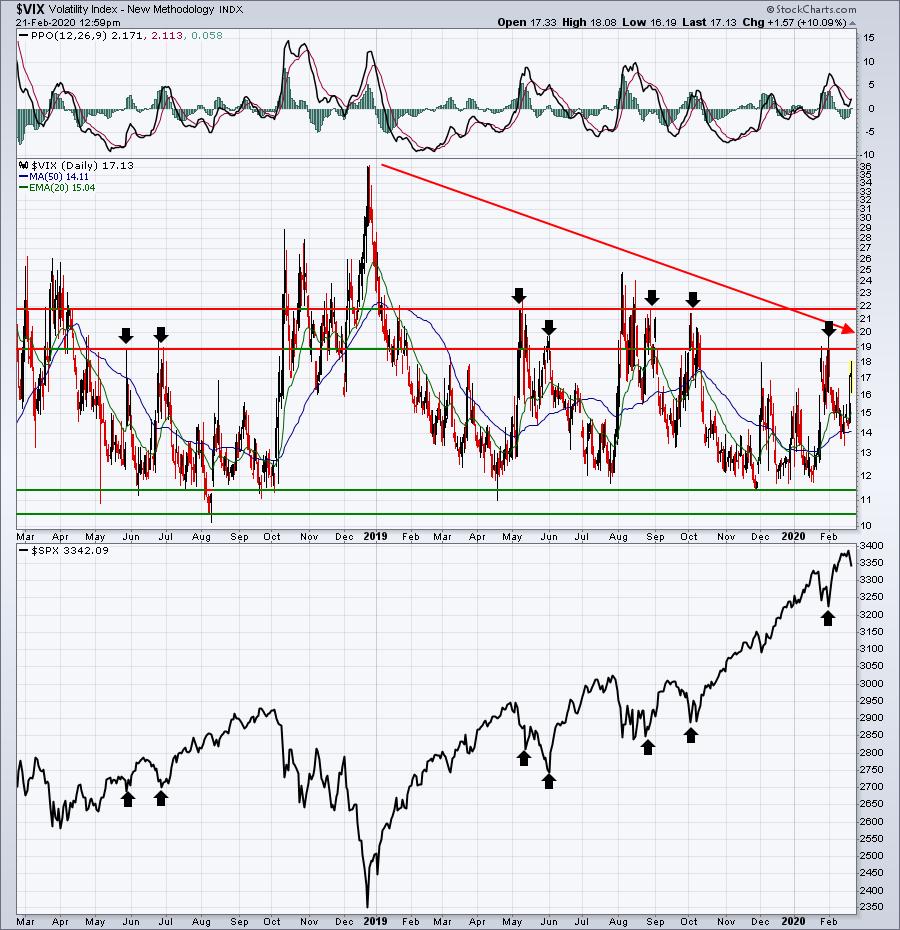
Overall fear levels dropped throughout 2019 as trade war headlines died down. Recently, fear has been associated with coronavirus headlines. We are very likely going to print an important short-term bottom in the S&P 500 as the VIX tops. From the chart above, you can see that the majority of key VIX tops has been in the 19-22 range. I'm not saying that the VIX must get there on this trip, but if it does, it's likely to mark a significant bottom in the S&P 500. The problem is that you must be willing to accept some risk by entering stocks at current levels. If we're off by 2 or 3 days in marking an S&P 500 bottom, it could represent another 3-5% drop in that benchmark. I don't believe we're going that low near-term, but if we fail to hold the very short-term price and moving average support levels I discussed earlier, than the odds begin to grow that we'll see more selling.
A reversal in the VIX one day with a long tail to the upside will likely be our signal that the worst is behind us.
Active Trade Alerts
Currently, we have one active trade alert, as follows:
DKS (-0.74%) - reports its next earnings on March 10th. DKS set a fresh recent intraday low earlier today, but is once again attempting to make a comeback. We're maintaining our closing stop at 43.25. So if DKS closes below that level today, we'll remove it as an active trade.
Strong Earnings ChartList (SECL)
We're definitely getting a better "reward to risk" opportunity to enter some of the SECL stocks given the market's weakness the past couple of sessions. I've highlighted key support levels on component stocks of our four portfolios, so I'll focus on a few others that I found appealing:
AYX:
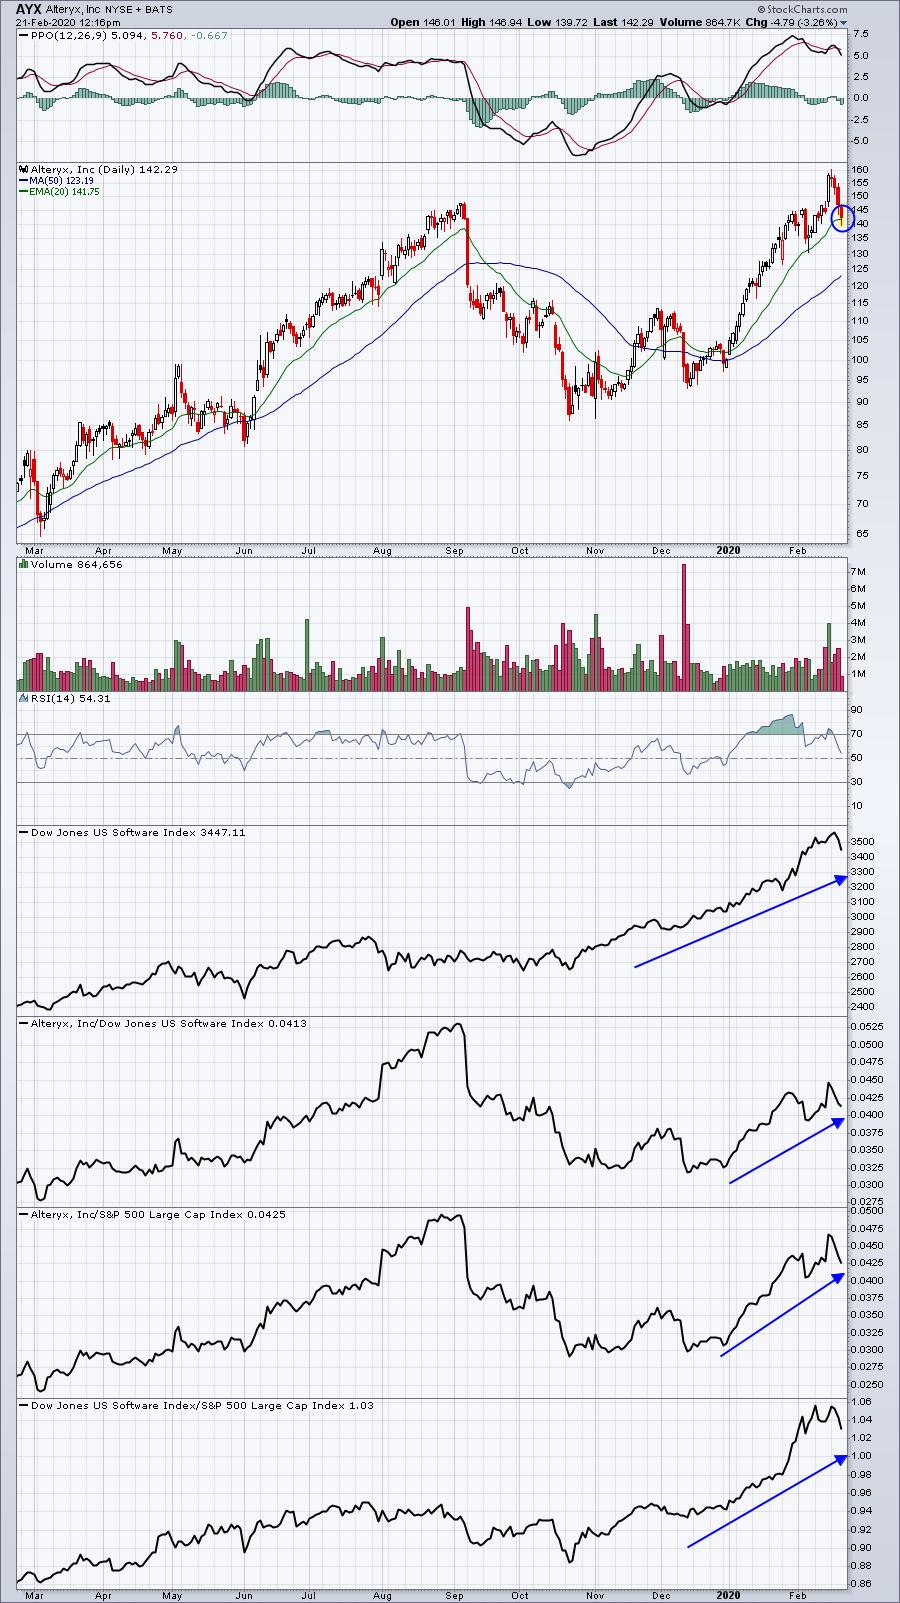
The good news here is that AYX has pulled back 10% or so from its recent high and is now testing its rising 20 day EMA. The bad news is that there's a negative divergence in play, so be careful if that 20 day EMA is lost on a closing basis. An intraday stop beneath today's earlier low wouldn't be a bad idea to simply minimize risk.
MS:
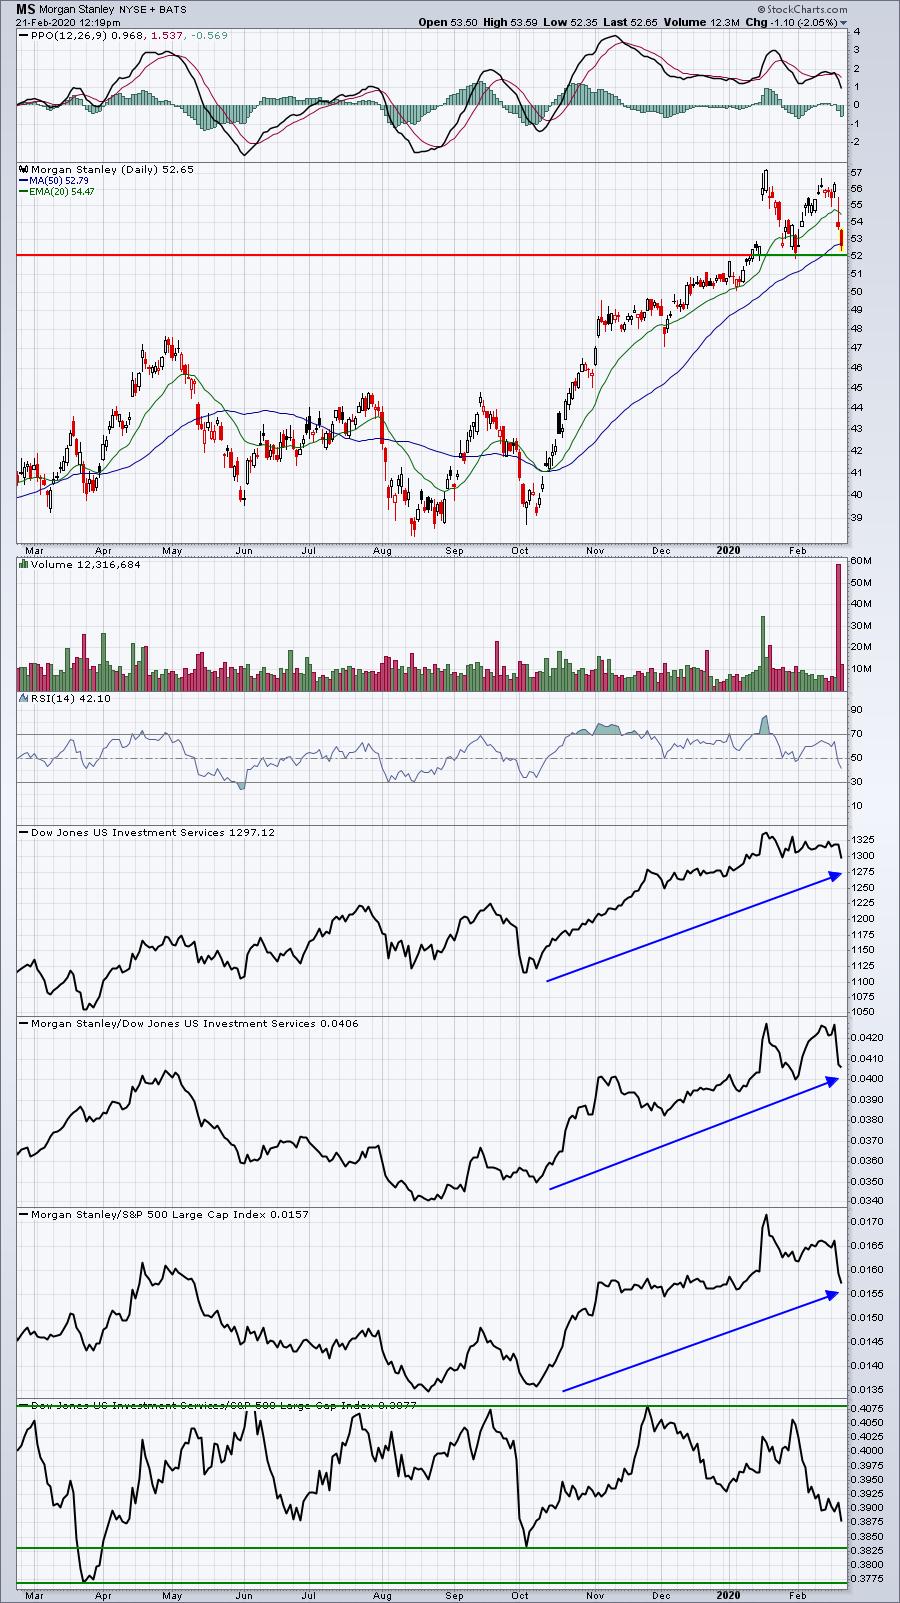
MS had an excellent quarterly earnings report recently, but it's announcement to buy E*Trade (ETFC). Just about any time you see an all-stock deal like this one, the acquirer drops on the likelihood that it will be dilutive to earnings. Many times, that initial selloff can provide an opportunity. MS is trading down near a key short-term support where it could find a number of buyers. Again, it would be easy to keep a tight stop in place here.
TER:
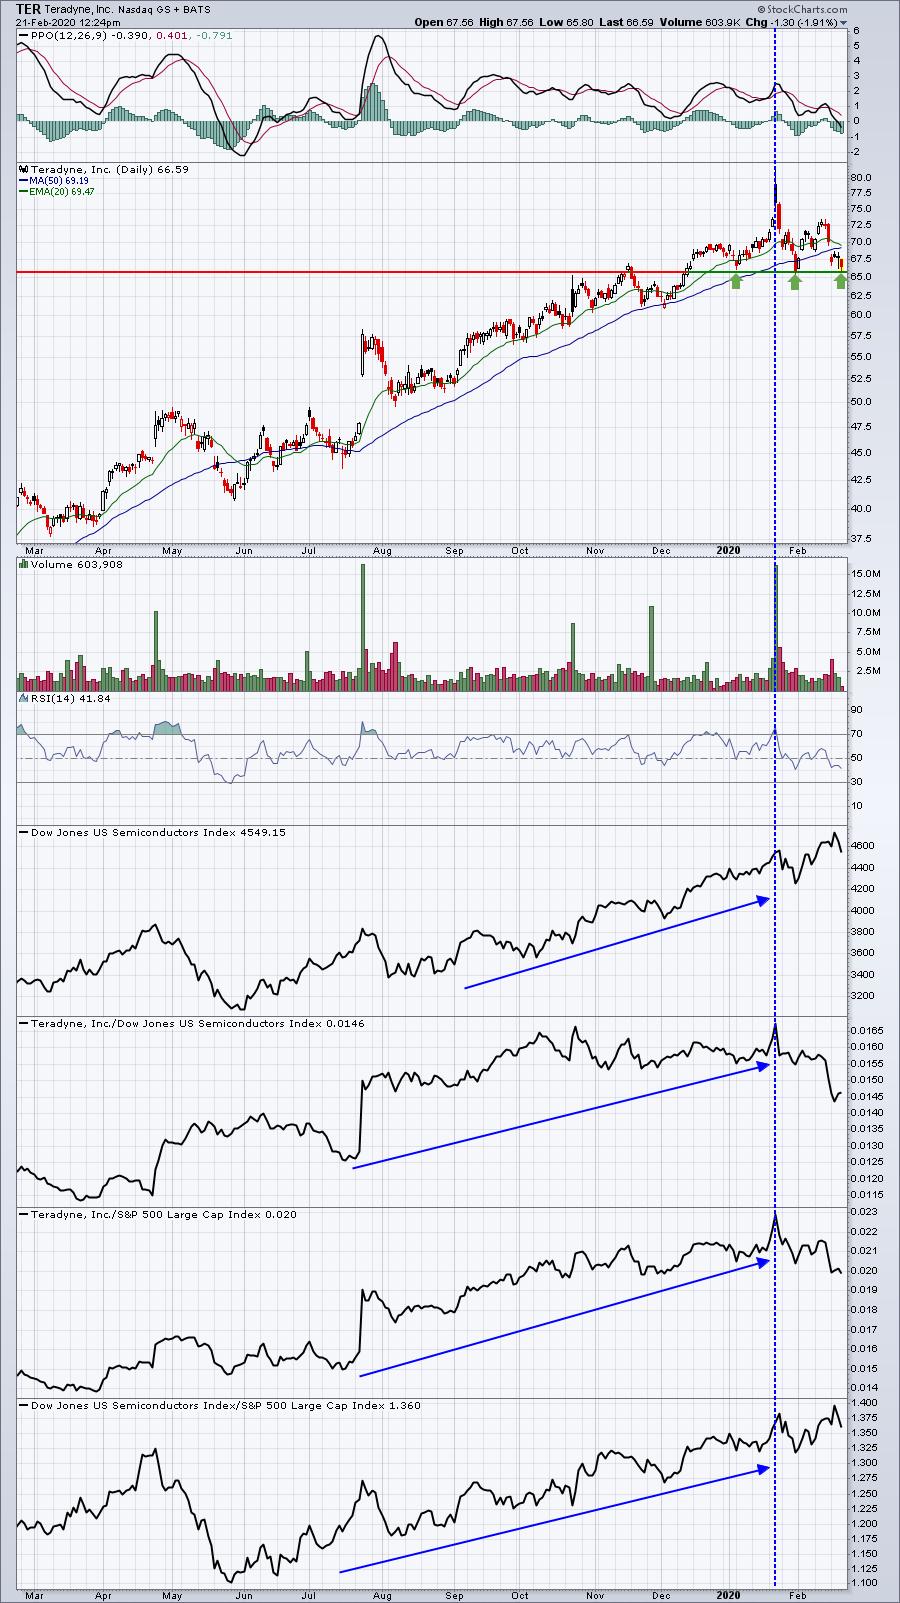
TER exploded higher with its last quarterly earnings report and was one of the best looking semiconductors at the time of that report. Check out its relative strength on the day it reported results. It's since been consolidating and today reached a key area of price support, illustrated by the horizontal line. Once again, a tight stop could be used to guard against large losses. This could easily be a major turning point for the stock.
UTX:
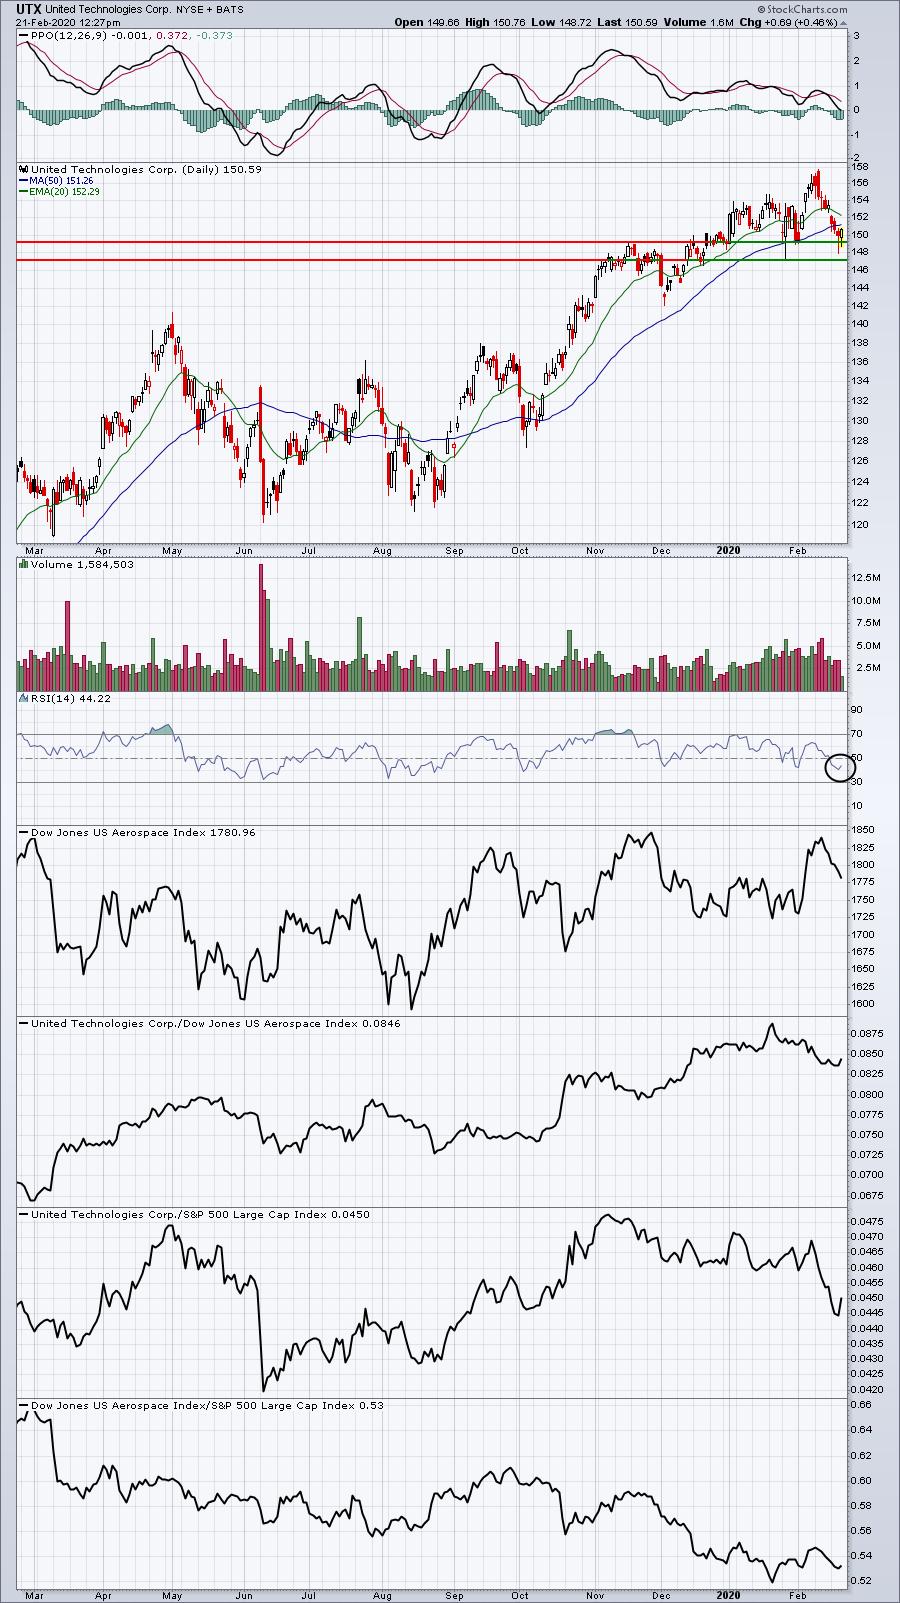
UTX hit price support the past couple days and it's done so with a daily RSI at 40 - that's a level that many times marks a bottom in an uptrend. Like the others, UTX is a leader among its peers and provides limited risk from the current price level.
Movers & Shakers
Here are a couple of interesting charts from some of today's big movers:
DE:
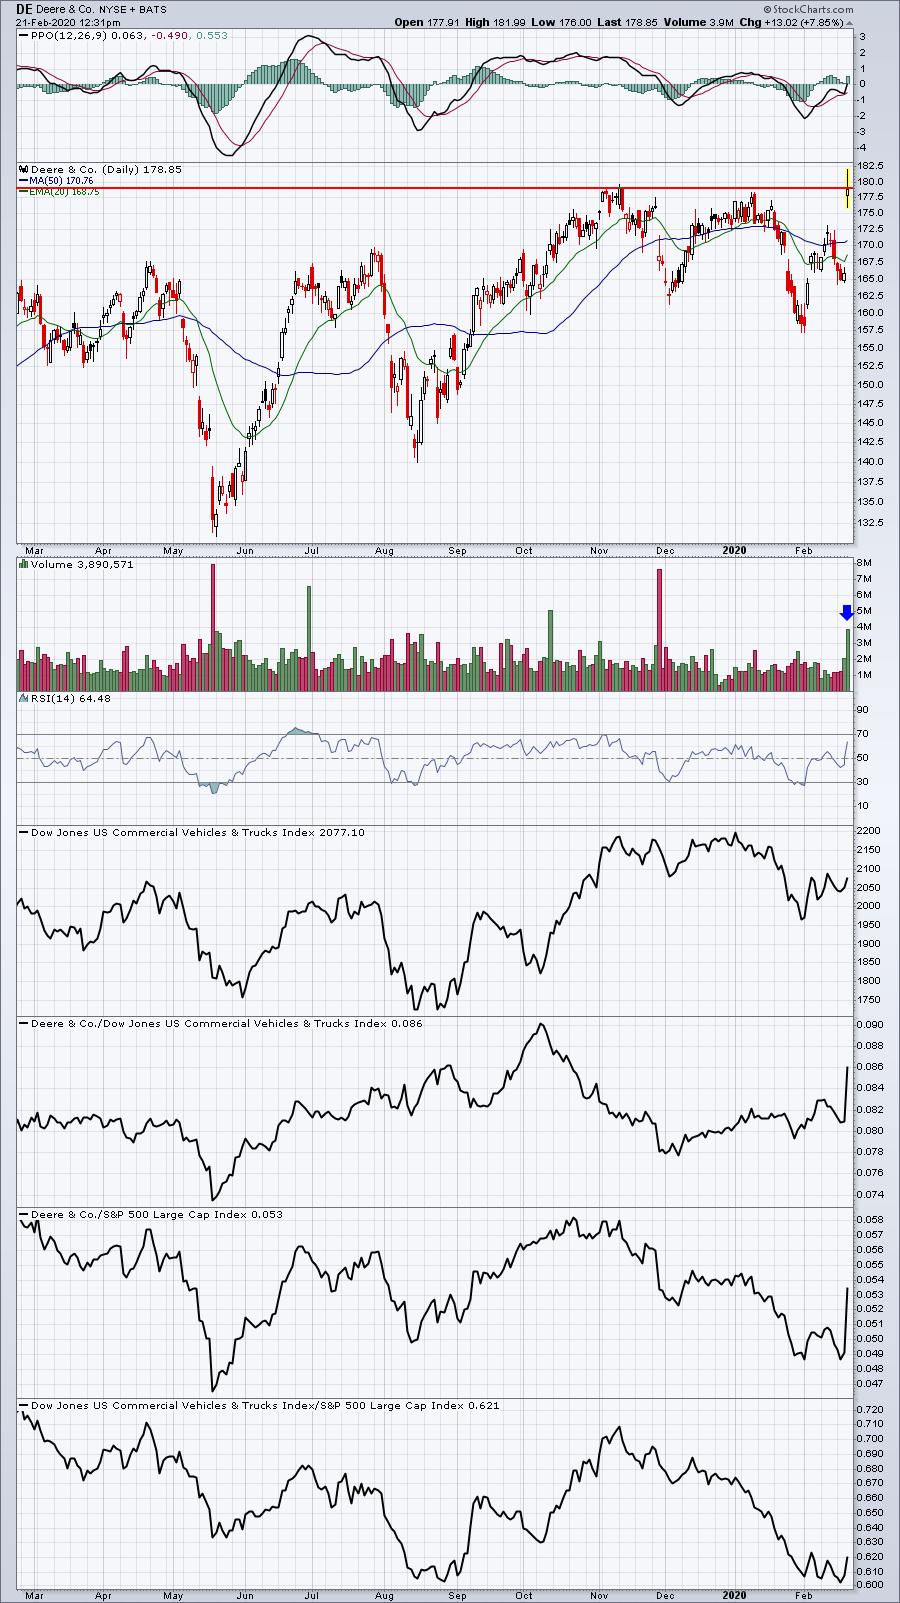
DE's earnings report was excellent, but it failed to open above key candle body price resistance at 179.02. That's usually a bit of a warning to me that we should be careful if an intraday breakout attempt fails. Thus far, the earlier move on DE to 181.99 hasn't held and DE currently trades right near 179. Barring a strong finish today, I suspect we'll see DE trade lower in the next few days. It depends on today's close in my view, especially given the enormous volume of shares traded today. 179.03 and above would be much more bullish than the alternative.
MNKD:
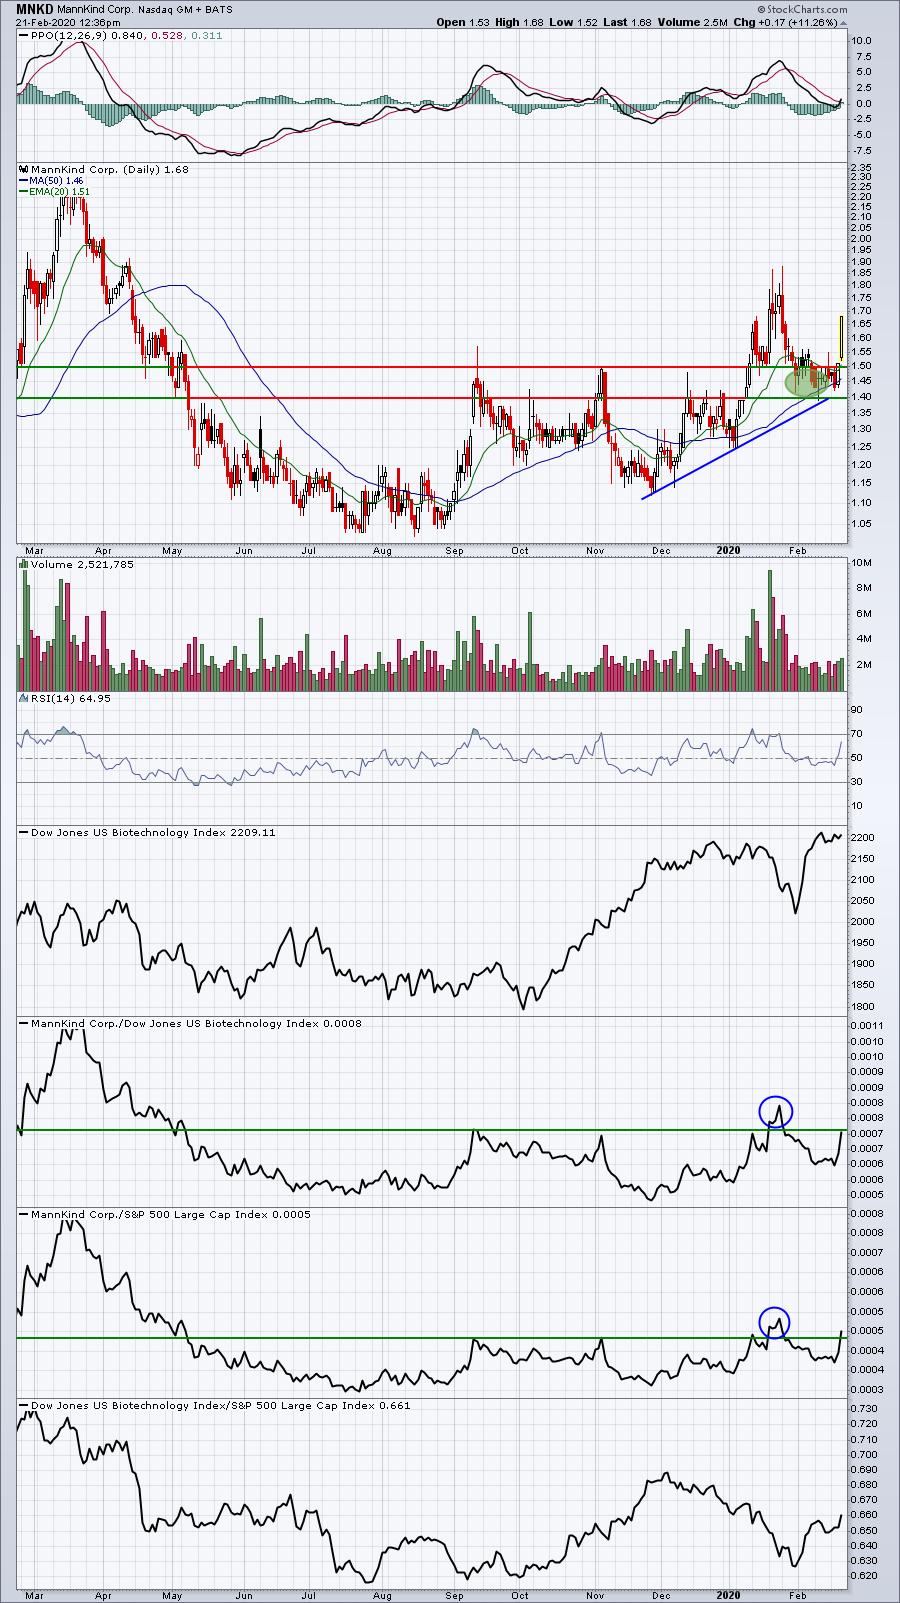
On February 12th, I highlighted the biotechnology group ($DJUSBT) and provided close to a dozen of my favorite stocks in the space. MNKD was one that had pulled back and was consolidating in an important area between 1.40-1.50. Volume began to pick up Thursday afternoon as MNKD managed to finally close above the 1.50 price resistance zone. More technical buyers are jumping in today, sending shares higher by more than 11%. 1.76 is the next price resistance level to be aware of.
Earnings Reports
Here are the key earnings reports for this week, featuring stocks with market caps of more than $10 billion. I also include a few select companies with market caps below $10 billion. Finally, any portfolio stocks (or active trade alerts) that will be reporting results are highlighted in BOLD. An asterisk (*) is placed next to stocks that are showing excellent relative strength heading into their respective earnings report. In my judgment, I'd expect strong results and guidance, although correctly predicting which way a stock might gap after an earnings report is much more difficult. If you decide to hold a stock into earnings, please understand the significant short-term risk that you are taking. Please be sure to check for earnings dates for any companies you own or are considering owning:
Friday, February 21:
RY, DE, MGA, WPC, PNW. Others less than $10 bil: ITT, CFX, B, HMSY, SOGO
Monday, February 24:
INTU, HPQ, OKE, PANW, KEYS. Others less than $10 bil: TREX*, TNDM*, THC*
Economic Reports
February PMI composite flash: 49.6 (actual) vs. 52.5 (estimate)
January existing home sales: 5,460,000 (actual) vs. 5,450,000 (estimate)
Happy trading!
Tom