
EB Daily Market Report - Monday, February 24, 2020
Webinar Today
Based on the price manipulation last week, we decided to host an impromptu webinar, "Understanding Max Pain and New Earnings Feature", which will begin today at 4:30pm EST. The room will open no later than 4:00pm EST and everyone is invited. If you cannot make the webinar LIVE, we'll record it and make it available to you later this evening.
To join the webinar later this afternoon, you can click on the following room link:
If you have any problems accessing the room using the above link, you can go to www.earningsbeats.com and join from the link on our website.
New Feature
Under "Earnings Reports" near the bottom of each day's DMR, I am beginning to highlight relative strength leaders that will be reporting earnings the next day. Those stocks will be highlighted with an asterisk (*).
Executive Market Summary
- Futures were significantly lower as the number of coronavirus cases surges and in countries outside of China
- It's been a flight to safety today as treasuries rise with the 10 year treasury yield ($TNX) falling to 1.36%, very close to all-time lows
- The S&P 500 hit 3224 today, just 10 points above the January low of 3214; that's a key technical support level to watch
- All 11 sectors are lower, although there's relative strength in utilities (XLU, -0.58%) and real estate (XLRE, -1.34%); all other sectors are down at least 2%
- Energy (XLE, -4.28%) and technology (XLK, -3.67%) are the hardest hit sectors
- Our only active trade alert, DKS, was stopped out on Friday's close below 43.25
Market Outlook
In our last DMR on Friday, I looked at a couple key price support levels to watch. The very short-term support was easily cleared to the downside by this morning's huge gap down at the open. The intermediate-term support level identified on the weekly chart could still offer up hope for the bulls:
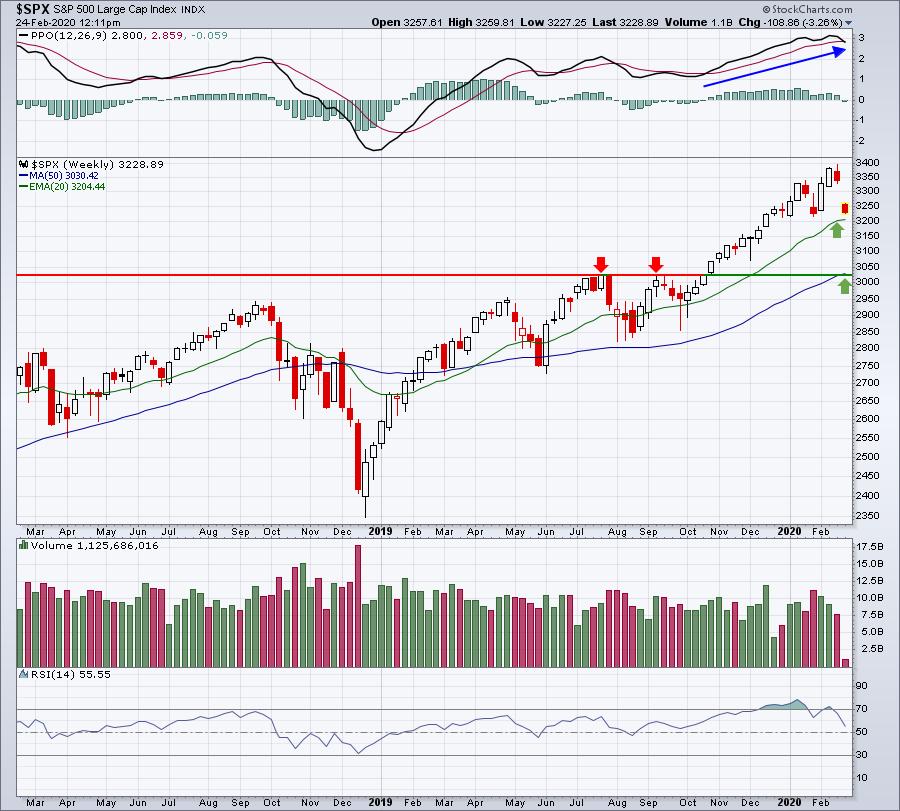
If we see a selloff into today's close, I would not be shocked to see a price test of 3025, which is where we broke out from in October. Remember, impulsive selling does not even consider technical support. Why? Well, think about the best technical traders on the planet - market makers. If they're not supporting the market and providing liquidity, support levels will not hold. It's that simple.
I want to be very clear about one thing, because I've already fielded a few questions from members. I remain very bullish. Short-term selling and increased fear levels do not change the fabric of a secular bull market. Think back to Q4 2018. The S&P 500 dropped 20% in three months. While I grew very cautious of that move lower and was very critical of the Fed, I quickly moved back to a bullish stance as market conditions rebounded.
Technicians are at a huge disadvantage when fear ramps up, because of the irrational market behavior during those times. I feel quite confident that the current fears will subside and the U.S. equity market will move back to all-time highs in 2020. But do we drop another 10% first? I don't have the answer to that question. I also have no way of knowing when or whether the coronavirus will be contained. I will watch sentiment readings and pass along my thoughts as conditions warrant. One thing to watch for is a reversal back to the upside on heavy volume. It could happen later today, or it might be a few days. That reversal in the S&P 500 will likely leave a HUGE tail to the upside in the Volatility Index ($VIX). Many times that will mark important market bottoms.
Sector/Industry Focus
Airlines ($DJUSAR) were already having a difficult time and had been lagging the overall market long before fears began ramping up due to the coronavirus. But this is an industry group that quite obviously is being impacted by these fears:
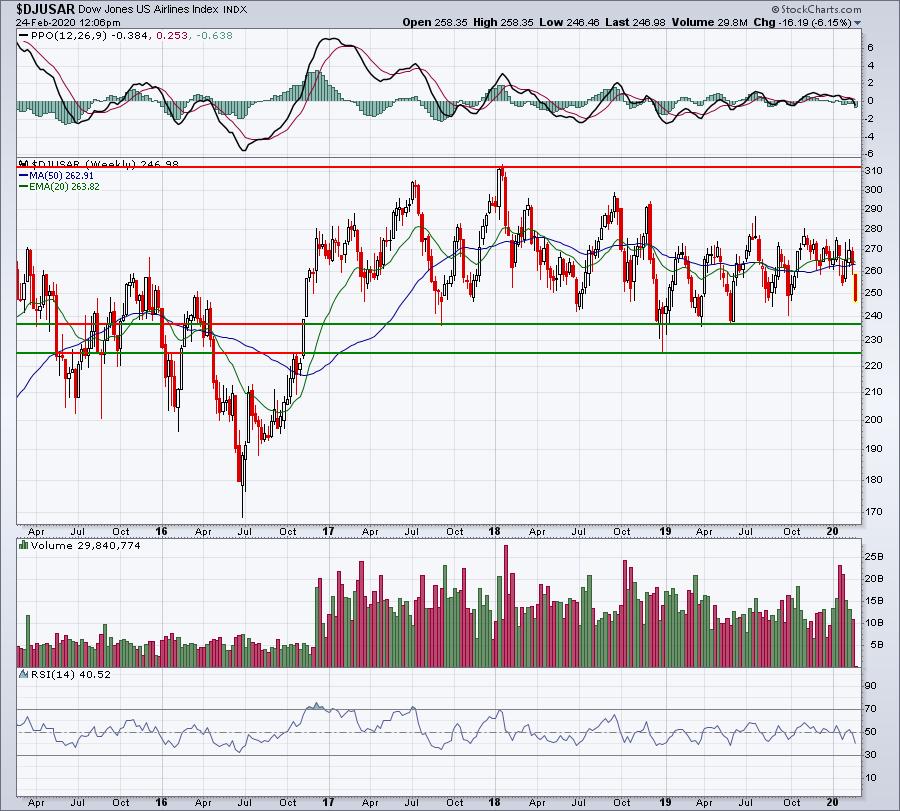
It's doubtful that coronavirus fears will simply disappear overnight or later this week, so I'd be looking for additional weakness in the DJUSAR to perhaps test the 3 year support zone in the 225-240 area. If that support is lost, I'd expect fear to drive the group back as low as 2016 prices.
Active Trade Alerts
We were stopped out of our only active trade alert on Friday. Here's a recap of our former alert:
DKS (-2.50%) - reports its next earnings on March 10th. DKS closed beneath our closing stop on Friday after flirting with that level for several trading sessions. Our closing stop was 43.25 and DKS closed at 42.36, well below that level.
Strong Earnings ChartList (SECL)
I'm not looking at buying anything right now. After the options maneuvering last week and the big move higher today in the VIX, I want to watch the action later today before I make any judgments. If you're anxious to begin moving into equities at lower prices, I completely understand. Go with your favorite stocks and perhaps begin to slowly build positions. If we reverse higher and the fears diminish, buying back higher wouldn't be a horrible alternative. This is not a perfect science, so consider mapping out a game plan and sticking to it.
Likewise, if you feel like you need to be on the sidelines, move to cash. Do what's comfortable. While I remain quite bullish longer-term, it's very difficult to predict when or where the market reverses and moves higher in the very near-term.
Movers & Shakers
There are obviously a great number of movers and shakers today as the overall market is under much more selling pressure. As a trader, I find it very difficult to rationally trade an irrational market. Irrational market to me is defined as a market with a Volatility Index ($VIX) above the 17-20 area. The VIX opened today at 22.25 and is currently at 23.56. Impulsive selling can occur at any time with a VIX at this level. Like I indicated above, an intermediate- to long-term trader (swing/position trader) could buy into positions slowly as the VIX rises, but determining how far the S&P 500 might drop from its current level is very difficult.
When the market environment changes and becomes as risky as it is now, I'd trade less, not more.
Earnings Reports
Here are the key earnings reports for this week, featuring stocks with market caps of more than $10 billion. I also include a few select companies with market caps below $10 billion. Finally, any portfolio stocks (or active trade alerts) that will be reporting results are highlighted in BOLD. An asterisk (*) is placed next to stocks that are showing excellent relative strength heading into their respective earnings report. In my judgment, I'd expect strong results and guidance, although correctly predicting which way a stock might gap after an earnings report is much more difficult. If you decide to hold a stock into earnings, please understand the significant short-term risk that you are taking. Please be sure to check for earnings dates for any companies you own or are considering owning:
Monday, February 24:
INTU, HPQ, OKE, PANW, KEYS. Others less than $10 bil: TREX*, TNDM*, THC*
Tuesday, February 25:
HD, CRM, AMT, BNS, BMO, EC, TRI, PSA, CSGP, AGR, HEI, LNG, PODD. Others less than $10 bil: CZR*, PLNT*, TOL, M, DAR*, NVRO*, BLD*, FRPT*, INSP*, PRFT*
Economic Reports
None
Happy trading!
Tom