
EB Daily Market Report - Tuesday, February 25, 2020
Executive Market Summary
- Futures rebounded this morning and our major indices began the day on a bullish note
- That early strength evaporated, however, and now we're seeing around 1% losses on key indices
- Small and mid cap stocks are lagging badly
- The usual safe haven suspects are outperforming as treasuries (TLT) lead and gold (GLD) is outperforming (though lower)
- Defensive sectors are leading, although all 11 sectors are down for a second consecutive session
- Crude oil ($WTIC) has fallen nearly 2% and is again nearing $50 per barrel as the oil market is anticipating a global economic hit from the coronavirus
- We have no active trade alerts at this time
- We would suggest short-term caution for active traders, especially those who prefer long trades as the S&P 500 is trading beneath January lows and the VIX is into the mid-20s, a combination that could lead to bouts of impulsive selling
Market Outlook
I'm bullish. I've remained bullish throughout many short-term corrections. But that doesn't mean that I will completely ignore the environment around me. The VIX is gaining steam to the upside and when the VIX is high, we MUST remain on high alert for impulsive bouts of selling that are not rational. How do you prepare for that? Well, from my perspective, I'm a short-term trader. Cash is king and the preservation of cash is extremely important. I don't like making emotional trades. So I've made the decision to cut down the number and size of my trades considerably and I do not plan on being an active trader in the very near-term - at least until the dust settles.
I'd rather miss a reversal and some upside than to hold during a big decline. Honestly, I don't know how anyone, with any precision, can call market movements in periods like this. So I'd rather be on the sidelines, or mostly on the sidelines. I have not changed my bullish stance on the market, nor on the big picture environment, which still includes strong earnings growth, low inflation, lower interest rates ahead, etc. I wouldn't change my strategy if I was a "buy and hold" type investor. I believe this will pass in time. But having a long-term mentality as a short-term trader can prove devastating during very brief periods and I'd rather avoid that possibility. Here's a chart of the VIX:
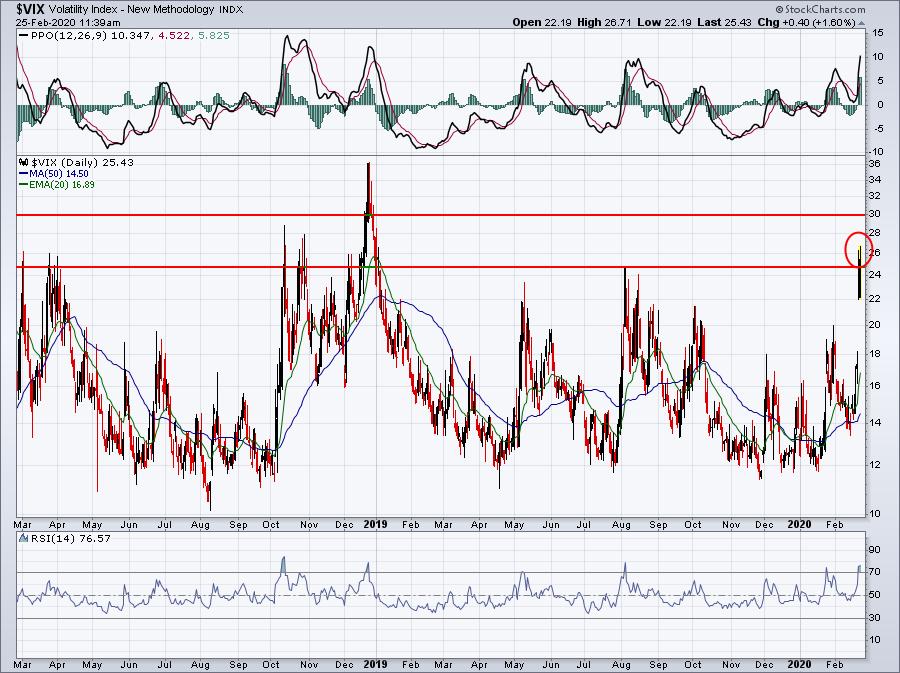
From a bullish perspective, we'd want to see a long tail to the upside print and the VIX close back near the lows of the day in order to begin to feel better about a bottom in place. Technically, we're seeing the S&P 500 lose important price support today, so a weak finish could lead to further downside near-term:
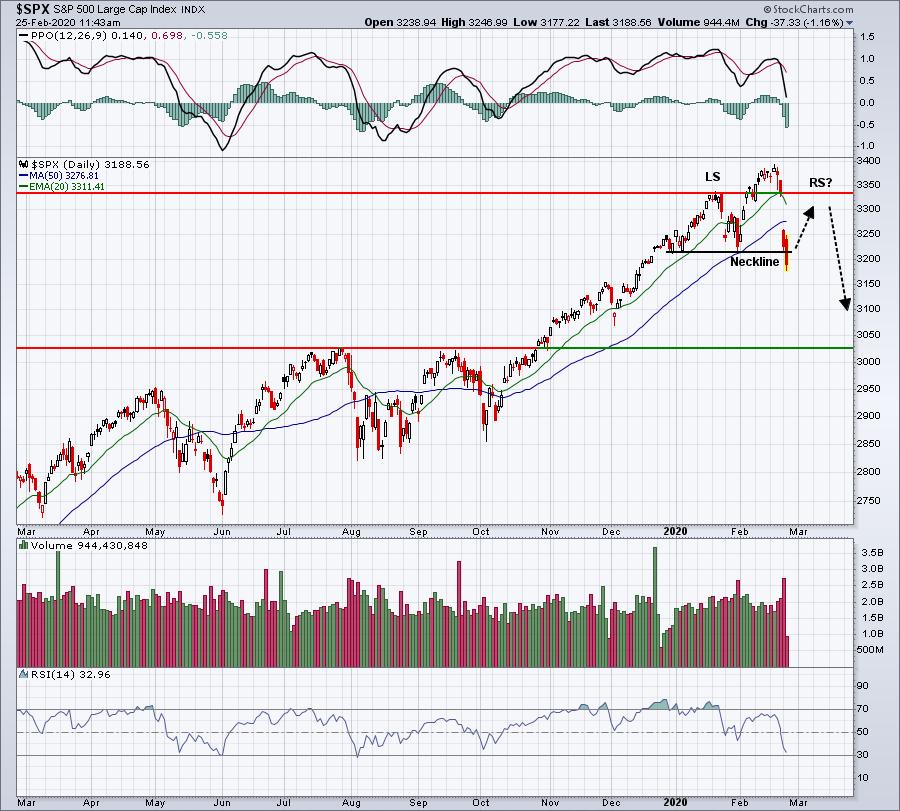
There are two bearish scenarios here. First, we hold support on today's close and bounce to potentially print a right shoulder in a topping head & shoulders pattern. Today's low moving beneath the January low is a bearish development in my view. A recovery this afternoon could lead to a bounce. The second, more bearish development would be a breakdown today that includes impulsive selling. That, in turn, would send the VIX higher and open the door to short-term panic.
The obvious bullish development is holding short-term support and returning to all-time highs. Considering how much we ran higher, combined with the increasing fear levels, makes this scenario less likely at this point, but still possible
It makes sense to be more cautious in the very near-term to let the market settle down.
Sector/Industry Focus
Banks ($DJUSBK) are breaking down today to multi-month lows and a weakening banking group is never a great signal for the market:
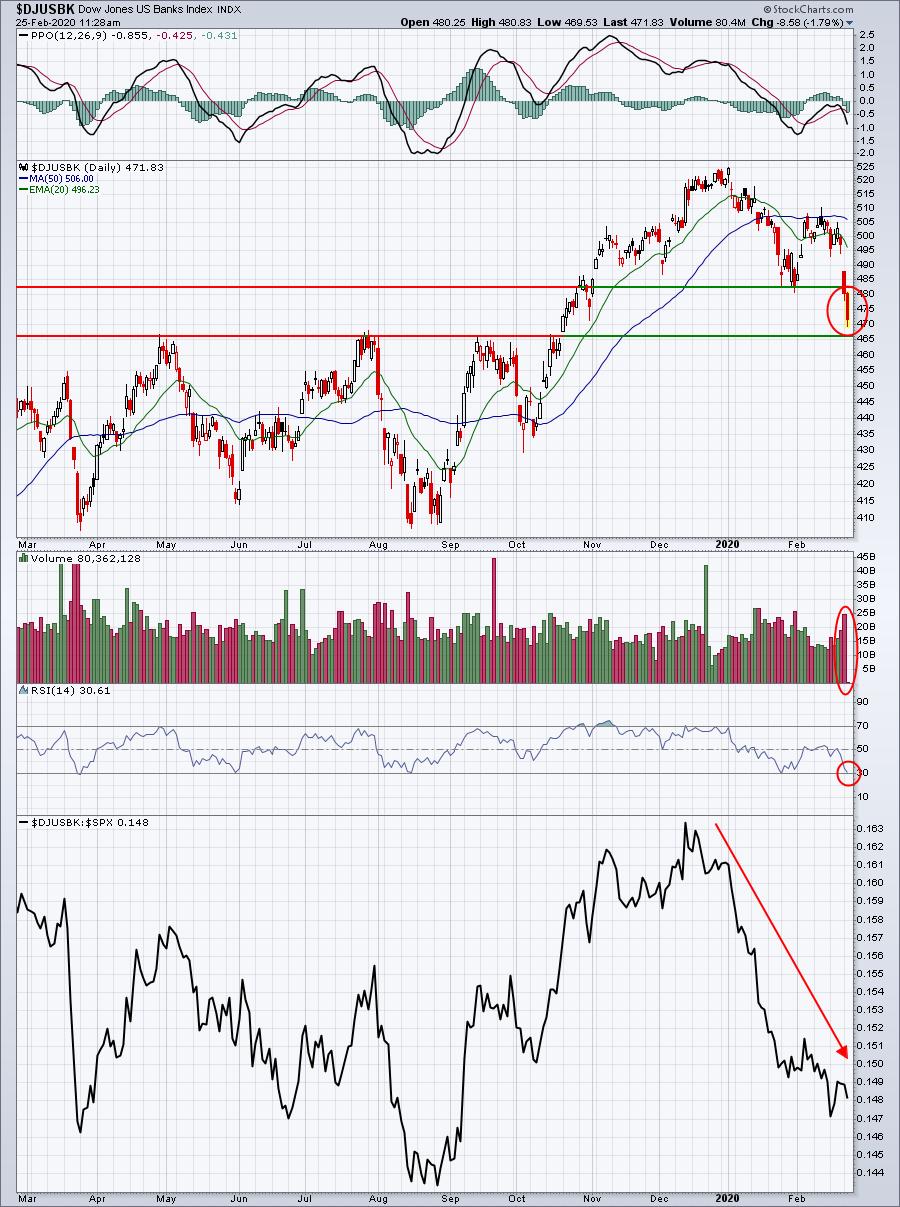
I've circled the pieces of this puzzle that bother me. Breaking below recent price support with volume expanding is not a good combination. Also, note the PPO is rolling over in negative territory and the RSI is down to 30. We don't typically see daily RSI readings down to 30 in an uptrending chart.
The weekly chart is more bullish, so if we can manage to hold onto 460-465 support, then we could see a turnaround.
Active Trade Alerts
We have no active trade alerts at this time.
Strong Earnings ChartList (SECL)
There is no doubt that many stocks on our SECL look much better technically than they did just a few days ago. Overbought conditions have been relieved and reward to risk scenarios are much better. But here's the problem. The Volatility Index ($VIX), at last check, was near 26. Yesterday's close was 25.03, its first close above 25 since the Q4 2018 cyclical bear market. I despise trying to trade a highly volatile market as fear trumps technical support levels. You might think you're entering at a great price - and in a rational market that's exactly what it would be. But in a market with a VIX in the mid-20s, we can throw rational market behavior out the window. If I traded anything, which I'm not, I'd use only intraday stops and be prepared to be whipsawed out of positions. I'd also consider taking profits much more quickly and moving back to the sidelines.
Again, I'm not interested in trading right now, but here's an example of a stock on our SECL and the strategy I'd consider if I traded:
SUM:
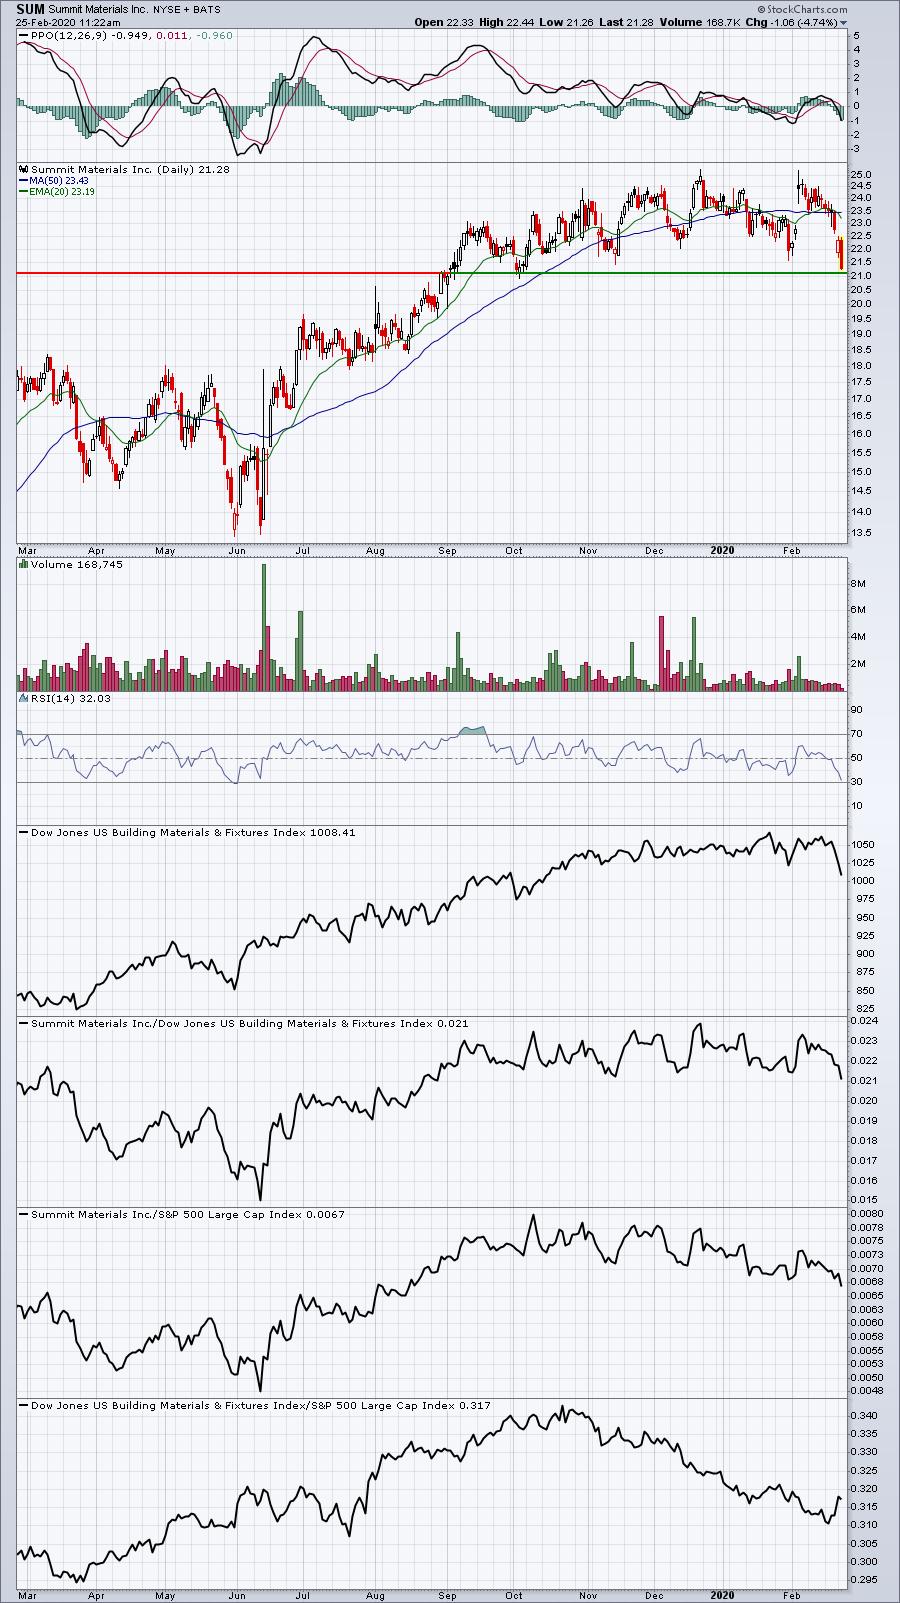
Let's say SUM drops below the horizontal support line at about 21.15 and hits 20.90, then recovers back to 21.16 or higher later in the day. One strategy could be to buy this "false breakdown" as it moves back above that support level in hopes that it holds. But I'd keep an intraday stop below that earlier low 20.90 and I probably would exit into the close. We already saw a 900 point gap down on the Dow Jones yesterday. Holding overnight in a highly volatile market can be troublesome as well.
Movers & Shakers
While I wouldn't be an active trader in this increasingly volatile market environment, here are two stocks moving lower and technically breaking down today:
NWL:
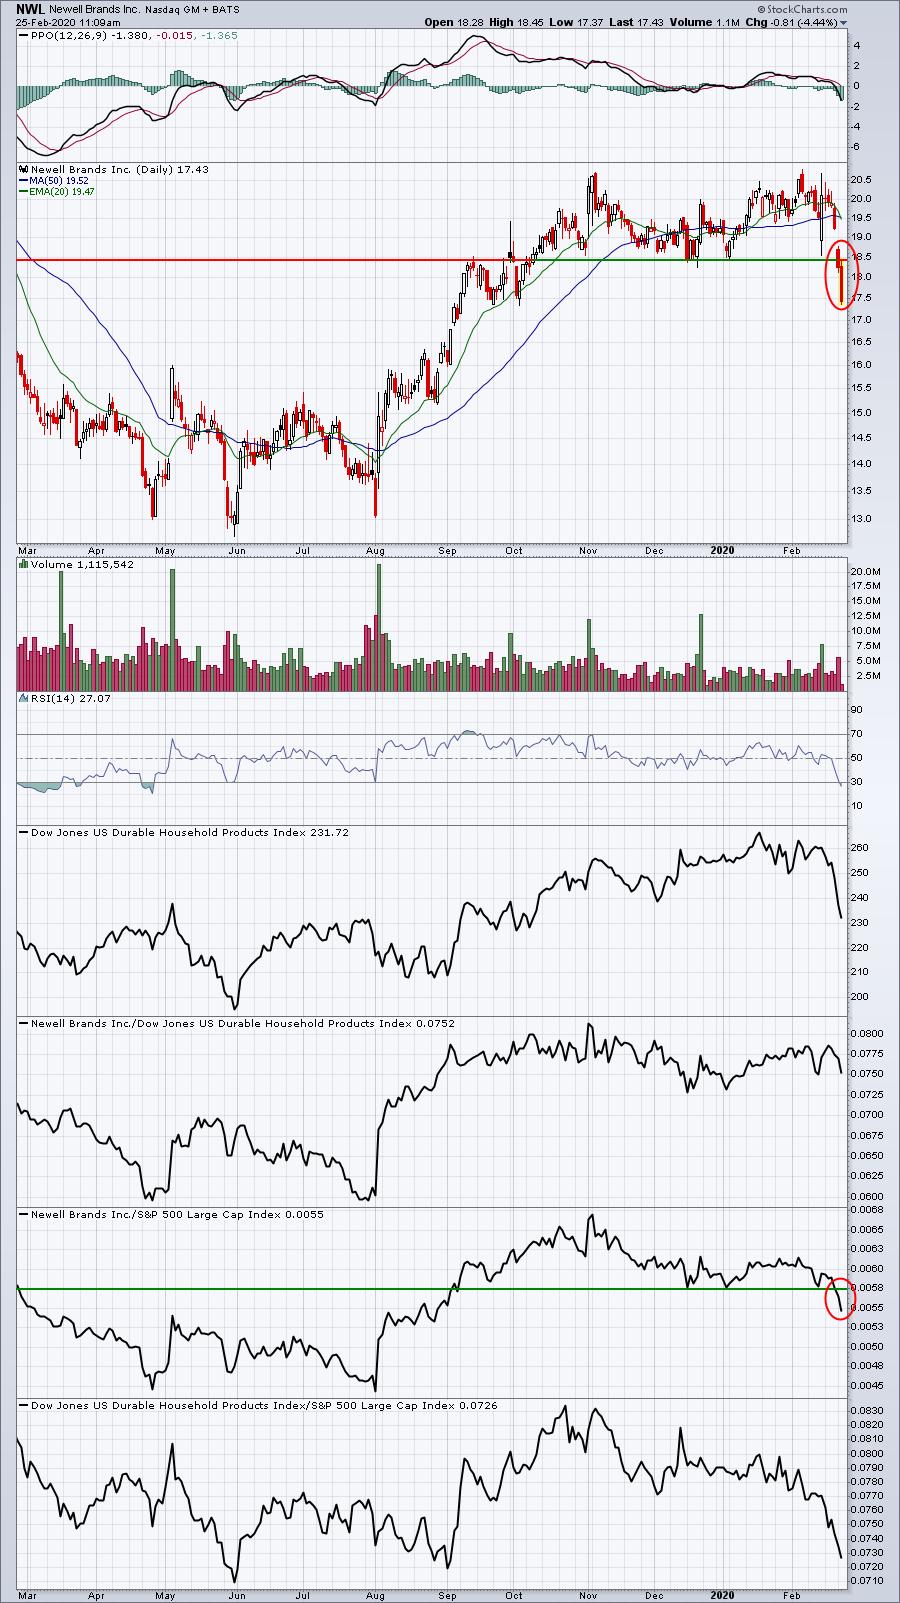
Volume picked up yesterday as NWL traded back below 18.50, which was a clear violation of recent price support. I'd expect to see 18.50 act as key price resistance moving forward.
BAC:
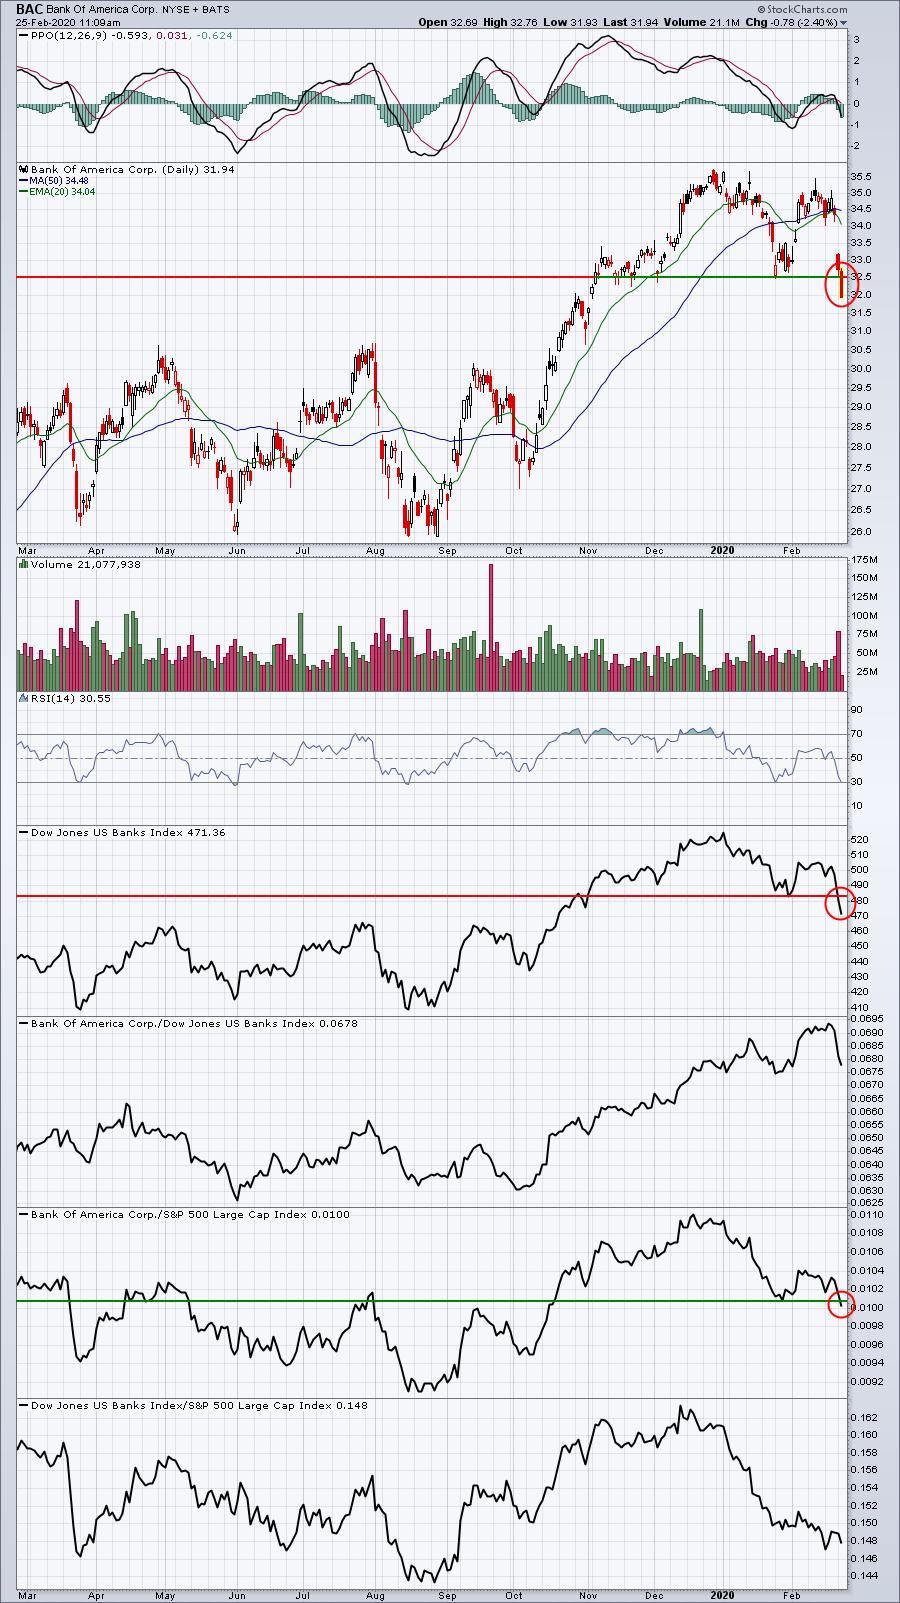
Banks ($DJUSBK) have broken to their lowest level since mid-October and BAC is breaking down on several levels. The most important support has been price support at 32.50. Barring an afternoon recovery and the printing of a hammer or doji, it appears that a key member of the banking group could be at a technical disadvantage.
Earnings Reports
Here are the key earnings reports for this week, featuring stocks with market caps of more than $10 billion. I also include a few select companies with market caps below $10 billion. Finally, any portfolio stocks (or active trade alerts) that will be reporting results are highlighted in BOLD. An asterisk (*) is placed next to stocks that are showing excellent relative strength heading into their respective earnings report. In my judgment, I'd expect strong results and guidance, although correctly predicting which way a stock might gap after an earnings report is much more difficult. If you decide to hold a stock into earnings, please understand the significant short-term risk that you are taking. Please be sure to check for earnings dates for any companies you own or are considering owning:
Tuesday, February 25:
HD, CRM, AMT, BNS, BMO, EC, TRI, PSA, CSGP, AGR*, HEI, LNG, PODD*. Others less than $10 bil: CZR*, PLNT*, TOL, M, DAR*, NVRO*, BLD*, FRPT*, INSP*, PRFT*
Wednesday, February 26:
LOW, BKNG, TJX, CCI*, MAR, NTES*, CM, SQ*, PEG, ANSS*, AEE*, BMRN, CVNA*, KOF, SJM, UHS, WTRG, NI, VER, APA. Others less than $10 bil: TDOC*, NXST*, WEN*, ERI*, UTHR*, CLGX*, MNTA*
Economic Reports
December Case-Shiller HPI: +0.4% (actual) vs. +0.5% (estimate)
December FHFA house price index: +0.6% (actual) vs. +0.3% (estimate)
February consumer confidence: 130.7 (actual) vs. 132.5 (estimate)
Happy trading!
Tom