
EB Daily Market Report - Wednesday, February 26, 2020
Executive Market Summary
- Futures rebounded early and U.S. indices are attempting to rally
- Asian markets were lower overnight, while we're seeing mixed action in Europe
- The 10 year treasury yield ($TNX) is up just 1 basis point to 1.34%, however; that suggests caution
- Gold (GLD), which usually benefits from fear-driven equity selloffs, is seeing profit taking today
- Technology (XLK, +1.96%) is leading today's rally thus far, but it was the hardest hit during the selloff
- The Volatility Index ($VIX, -8.08%) is down a bit; watch it into today's close as S&P 500 selling combined with a spiking VIX could lead to one more round of impulsive selling
- We have no active trade alerts at this time
Market Outlook
In my experience, the bond market tends to get things right more often than the stock market. I've illustrated recently how the S&P 500 typically performs much better during periods when the 10 year treasury yield ($TNX) is rising. When the TNX is dropping, money is rotating into treasuries and that weighs on stocks. So when looking to see whether today's early strength in U.S. equities holds, I'll be looking at a number of factors. One is the relationship between the TNX and the stock market. If the latter is moving higher, but the former is falling, I'm not going to feel very comfortable that stock gains will hold. Just looking at a very simple 5 day chart, the first key test for equities is actually a big test for the TNX:
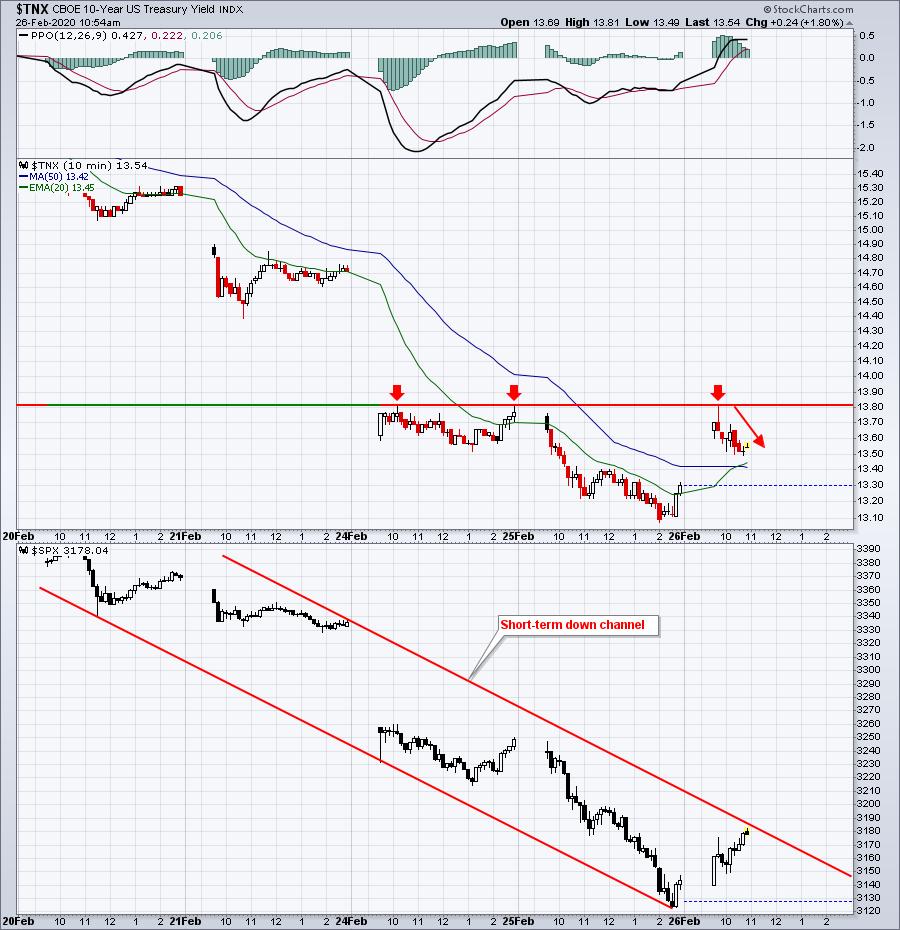
If money doesn't rotate from treasuries, the odds of this reversal lasting is much less, in my opinion.
Sector/Industry Focus
A second thing to watch is the sector performance throughout the day. The current sector leaderboard looks pretty good, but if it weakens throughout the day, that would be a signal of professionals using the early strength to reposition their holdings. Again, right now it looks pretty good:
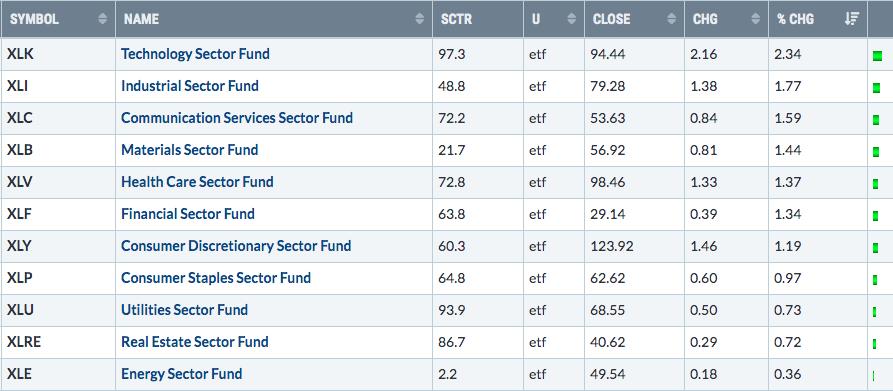
We want those aggressive groups like XLK, XLI, and XLC leading and defensive groups lagging. If this mix starts to change, I'd grow much more skeptical that the rally will last.
Active Trade Alerts
We have no active trade alerts at this time.
Strong Earnings ChartList (SECL)
It's not my style to try get involved on the long side this early in an initial recovery attempt. The whipsaw action can be devastating. It could turn out that the worst is behind us, but I'd like to see a few confirming signals of that before getting aggressive at all. Personally, if I did anything, I'd trade the sector or index ETFs, which helps to minimize risk somewhat. Of course, if another onslaught of impulsive selling hits, they'll go down also - just not as much as many individual stocks.
I realize that a lot of daily charts have taken a beating technically, but that's generally required to get the type of pullback needed on weekly charts. Before I pulled the trigger on any stocks, I'd make sure I reviewed the long-term weekly charts. Rising 20 week EMA tests can prove particularly successful. They can also provide you a solid support level to watch. If violated, you can exit quickly without a ton of damage. Weekly charts can bring a lot more perspective as well to help you tune out the fear that can easily get out of control when looking at daily chart breakdowns.
Movers & Shakers
Lowes Companies (LOW) reported quarterly results that, on the surface ($.94 vs $.91), looked pretty solid. The stock gapped higher this morning, but like so many others recently, LOW is struggling to sustain any strength. The stock is more than 4 bucks off its intraday high and is now threatening a breakdown:
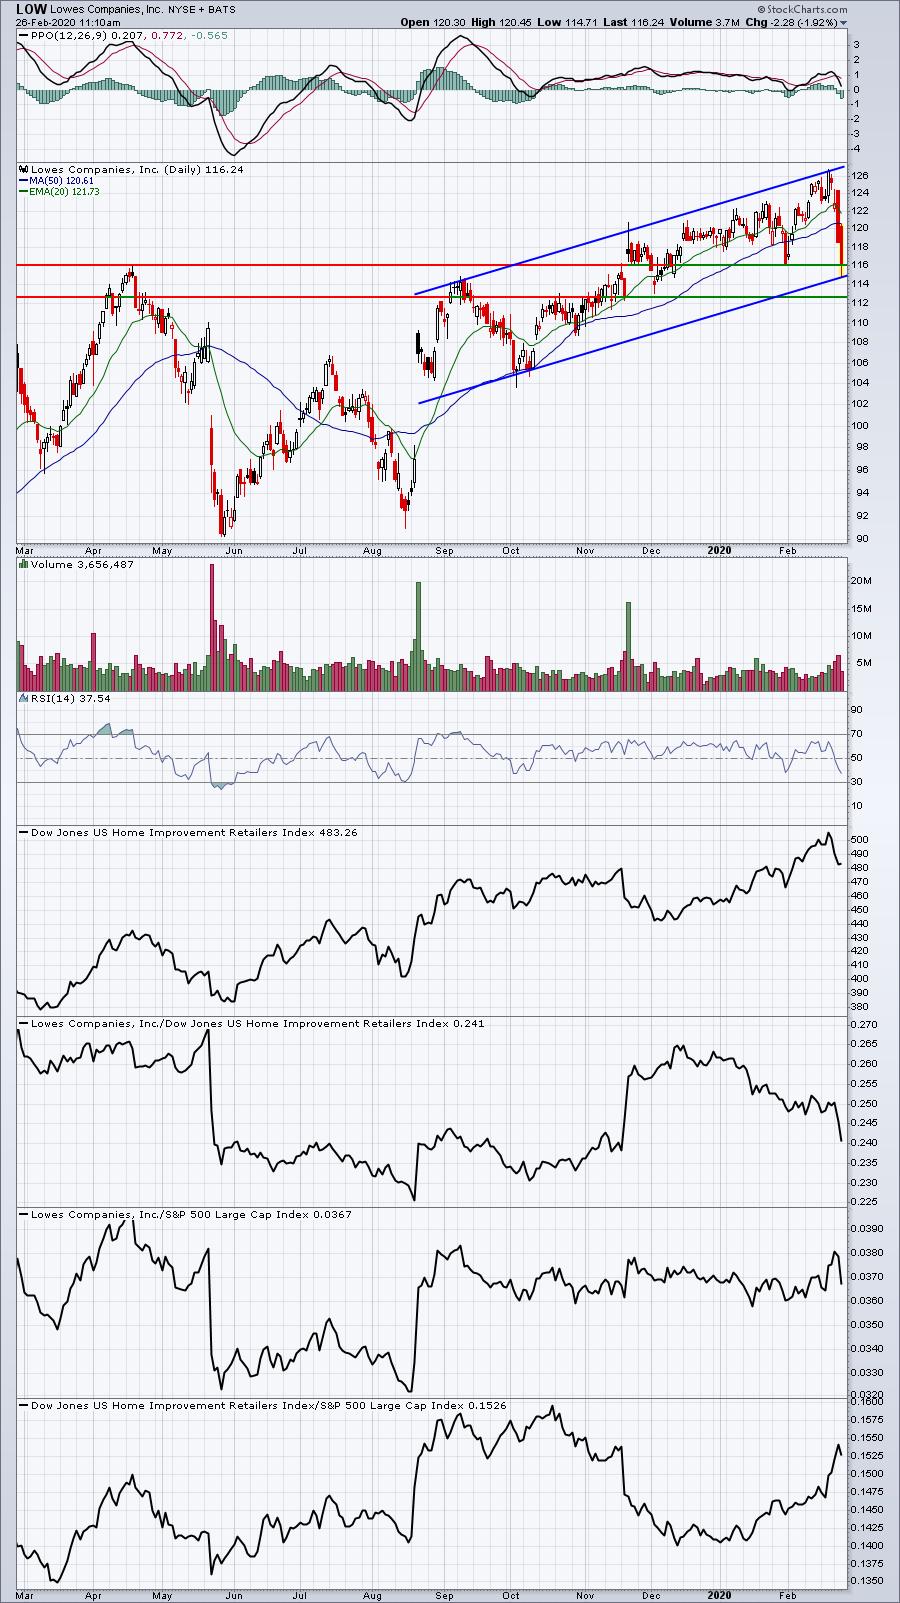
I show the 2 key price support levels I'm most interested in, along with channel support that was tested at this morning's low. Violation of all this support would likely lead to lower prices, in my opinion. In a better market environment, LOW would represent a very solid reward to risk trade. But in this environment? I'll pass.
Earnings Reports
Here are the key earnings reports for this week, featuring stocks with market caps of more than $10 billion. I also include a few select companies with market caps below $10 billion. Finally, any portfolio stocks (or active trade alerts) that will be reporting results are highlighted in BOLD. An asterisk (*) is placed next to stocks that are showing excellent relative strength heading into their respective earnings report. In my judgment, I'd expect strong results and guidance, although correctly predicting which way a stock might gap after an earnings report is much more difficult. If you decide to hold a stock into earnings, please understand the significant short-term risk that you are taking. Please be sure to check for earnings dates for any companies you own or are considering owning:
Wednesday, February 26:
LOW, BKNG, TJX, CCI*, MAR, NTES*, CM, SQ*, PEG, ANSS*, AEE*, BMRN, CVNA*, KOF, SJM, UHS, WTRG, NI, VER, APA. Others less than $10 bil: TDOC*, NXST*, WEN*, ERI*, UTHR*, CLGX*, MNTA*
Thursday, February 27:
BUD, TD, VMW, ABEV, BIDU, SRE, ADSK, KDP, WDAY, EOG, MNST, OXY, DELL, FMX, EIX, BBY, PBA, CBRE, IQ, DISCA, LYV, TTD, CNP, PAGS, MYL, CABO. Others less than $10 bil: AQN*, AMH*, TSG*, SRCL*, BTG*, AAXN*, LAUR*
Economic Reports
January new home sales: 764,000 (actual) vs. 710,000 (estimate)
Happy trading!
Tom