
EB Daily Market Report - Monday, March 2, 2020
Executive Market Summary
- Futures were quite literally all over the place overnight, but U.S. indices did manage to open with gains
- Currently, we're seeing the rally build with the S&P 500 within 5-6 points of key 3025 price resistance
- Today's leadership, however, is utilities (XLU), consumer staples (XLP), and real estate (XLRE), not what I'd like to see
- The 10 year treasury yield ($TNX) is down 4 basis points to 1.09%, a new record low
- Defensive positioning is winning today, which unnerves me a bit; gold is up $28 per ounce, treasuries are higher, and defensive sectors are leading
- This doesn't feel like a rally that will last
- We have no active trade alerts at this time
Market Outlook
Now that we've seen the Volatility Index ($VIX) hit 50, a level rarely seen, I'm hopeful that the market calms down, even if just temporarily. If it does, we should see a more rational market this week. That, of course, is assuming we don't have a bigger surge in coronavirus cases in the U.S. and around the globe than is already expected. If things do begin to calm down a bit, there are two key upside levels to watch. The first is the 20 hour EMA on the S&P 500:
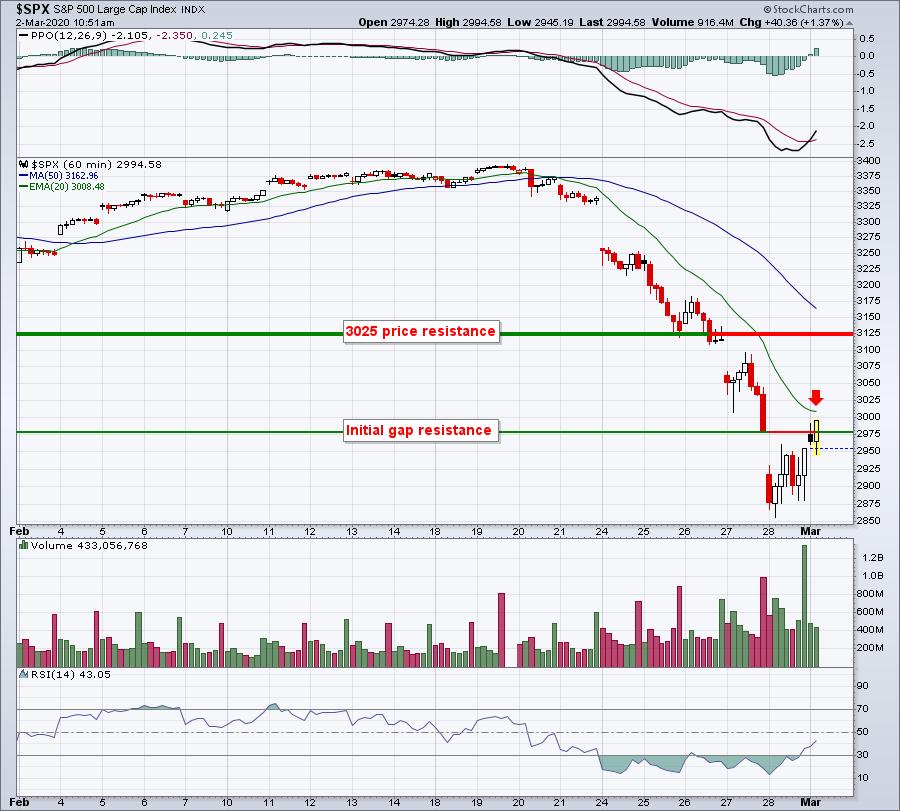
We're rapidly approaching the declining 20 hour EMA as I write this. If we can negotiate that moving average, we can turn to the daily chart:
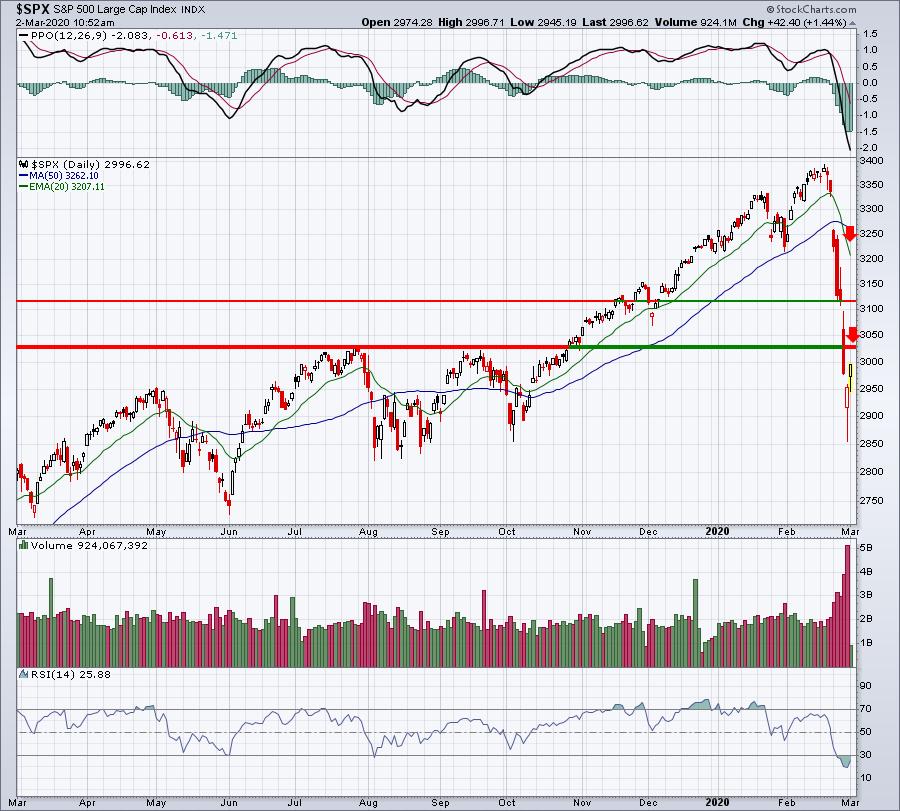
Here the breakdown beneath 3025 support is clearer. The volume on that selling was extremely heavy. I'd be surprised to see an initial move above 3025, but when the VIX is running at current levels, literally anything is possible. Personally, as I mentioned last week, I'd tend to stick with index and sector ETFs to help minimize the high risk that's present.
Sector/Industry Focus
First, the selling over the past week has been "indiscriminate" selling, which simply means that Wall Street isn't discriminating. It's selling everything. That can create opportunities, so it'll be important to see what's working on a relative basis. We could see new leadership emerge from this crisis. Also, depending how long the crisis lasts could impact which groups bounce back....and how fast. As an example, many of the airlines and cruise lines are being priced for disaster. Carnival (CCL) and Norwegian Cruise Line Holdings (NCLH) are both down 40%+ in one month. If we see ANY reports that the fears could be overblown, these are two names that could quickly soar. But if the crisis drags on for many months and worsens, both of these could see much more selling.
Here's a quick glimpse at the last week's action among sectors:
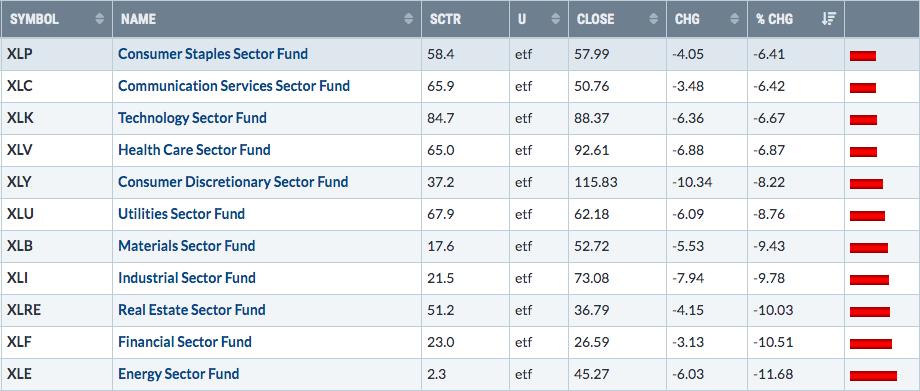
Everything is down significantly over the past week and the numbers above DO NOT include last Monday's debacle. I find it surprising that two aggressive sectors - communications services (XLC) and technology (XLK) - are among the leading groups. Normally, with future economic and earnings growth in question, these two groups would be among the groups being heavily sold. Perhaps Wall Street is suggesting that fears are overblown?
Active Trade Alerts
We have no active trade alerts at this time.
Strong Earnings ChartList (SECL)
I'm going to point out a few charts that look "interesting" to me. I don't know that running scans looking for stocks with RSIs between 40-50 would be of much help since just about every stock tumbled last week. Also, scanning for high volume stocks isn't likely to yield us much either as volume has skyrocketed over the past week. Many stocks are trading with unusually heavy volume.
Therefore, I scanned the old-fashioned way....with my eyes. Here are a few stocks that are testing very important support levels:
WGO:
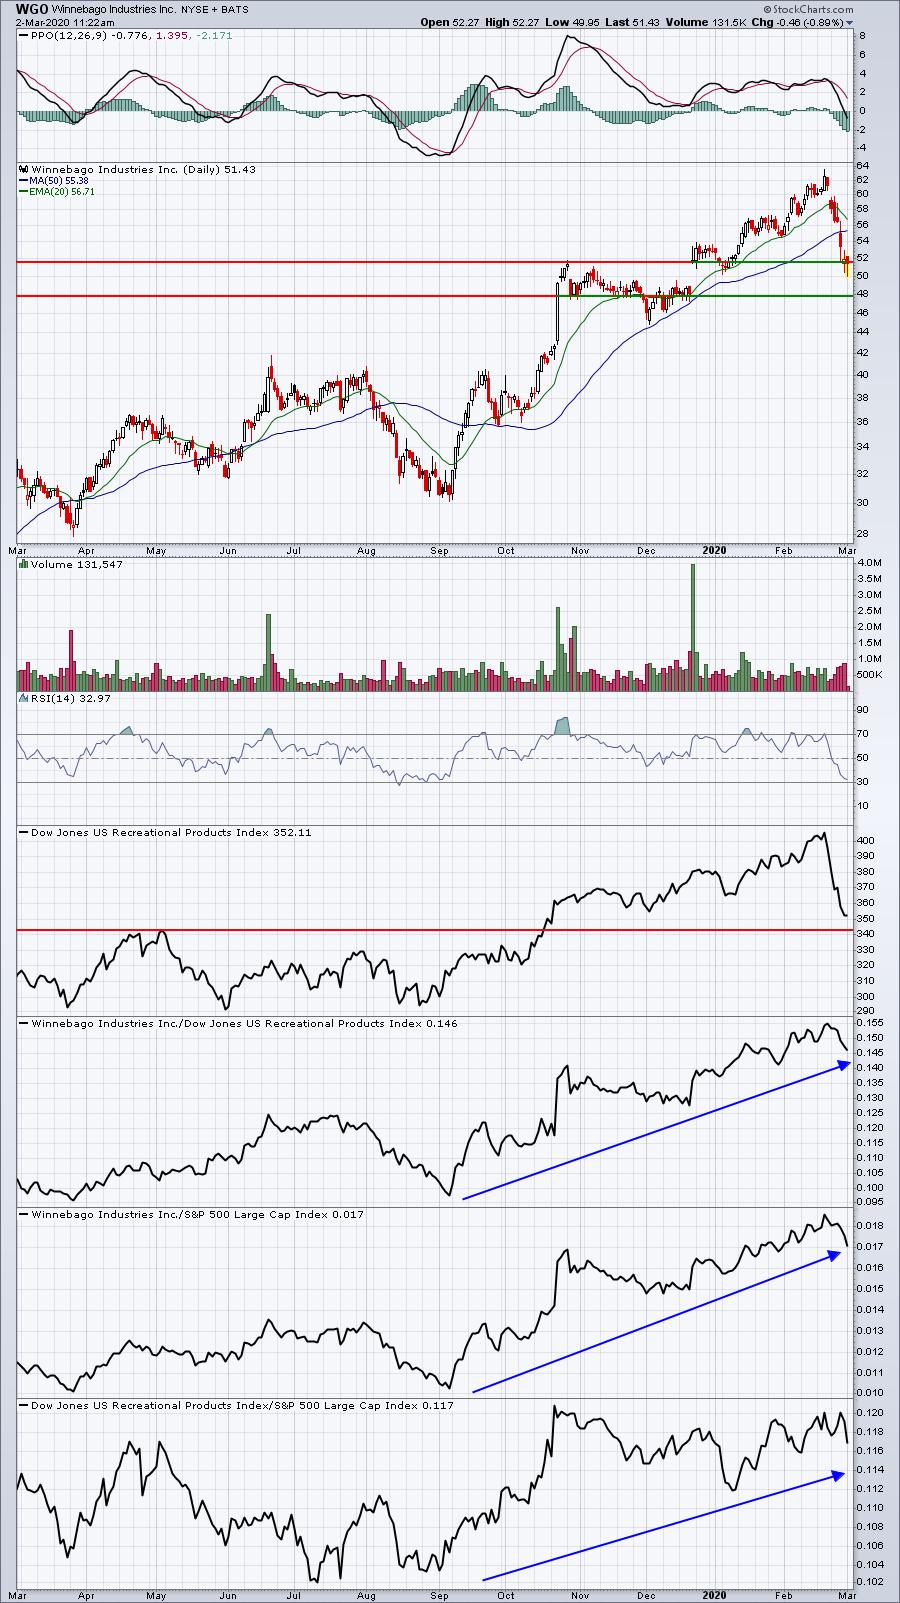
WGO is a solid relative performer, but still fell with the overall market to test a key area of price support. I'd like to see this hold.
CNI:
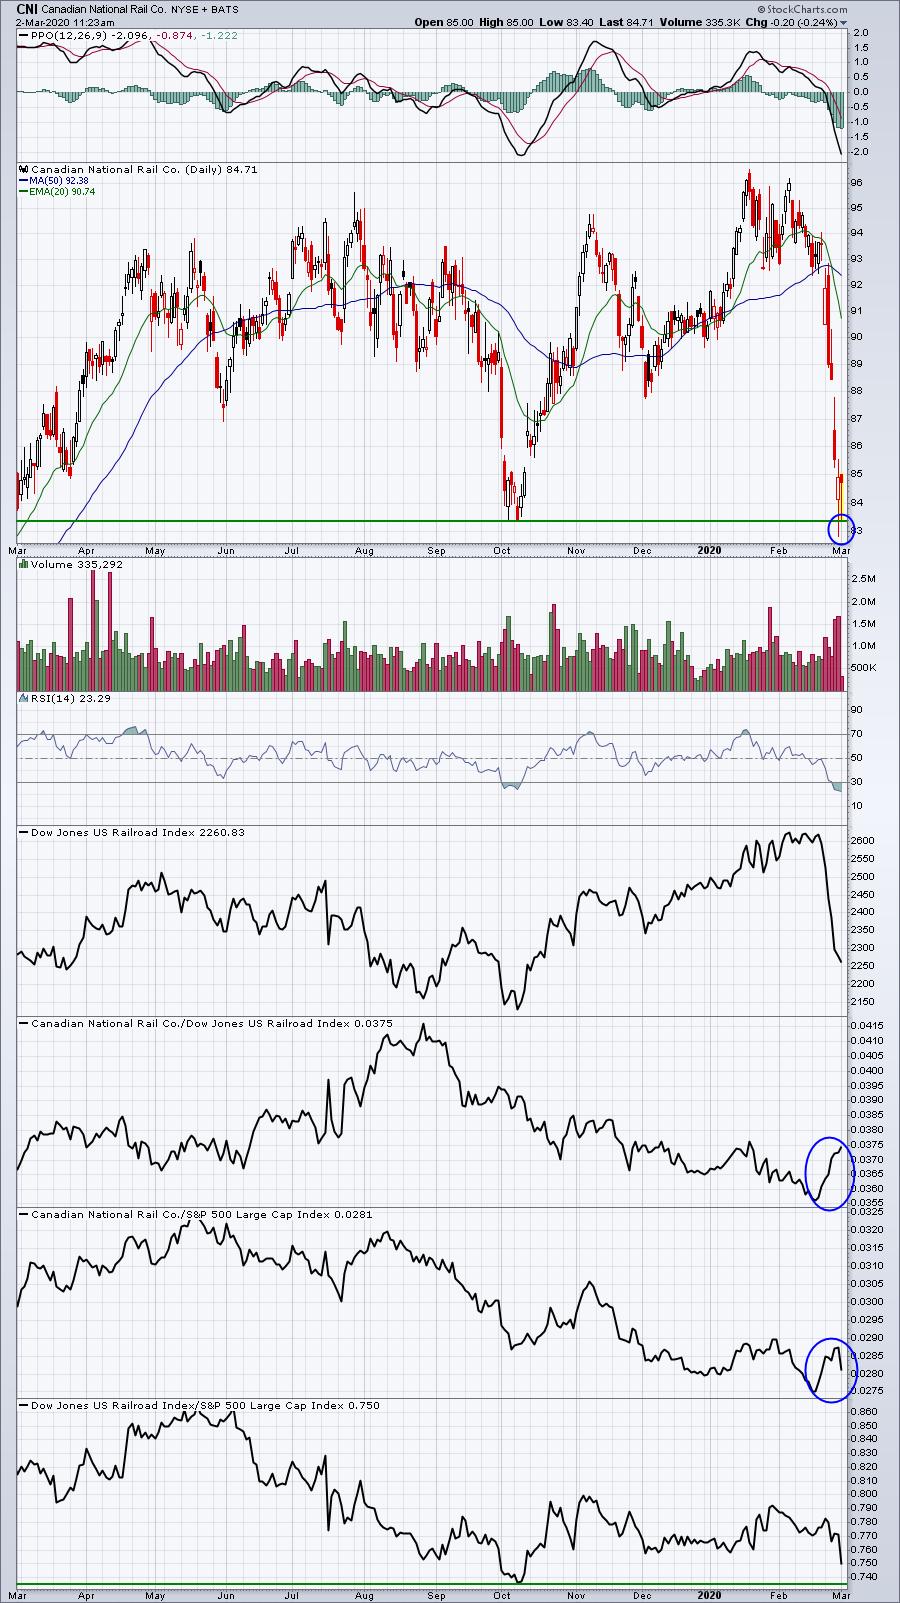
This is definitely a play on price support, which was violated intraday on Friday before a reversal held support. CNI returned to that support area again today, but has held thus far. A tight stop should be in place here beneath the Friday low. Also, I'm looking for railroads ($DJUSRR) to hang onto relative support in the bottom panel of the above chart.
XRX:
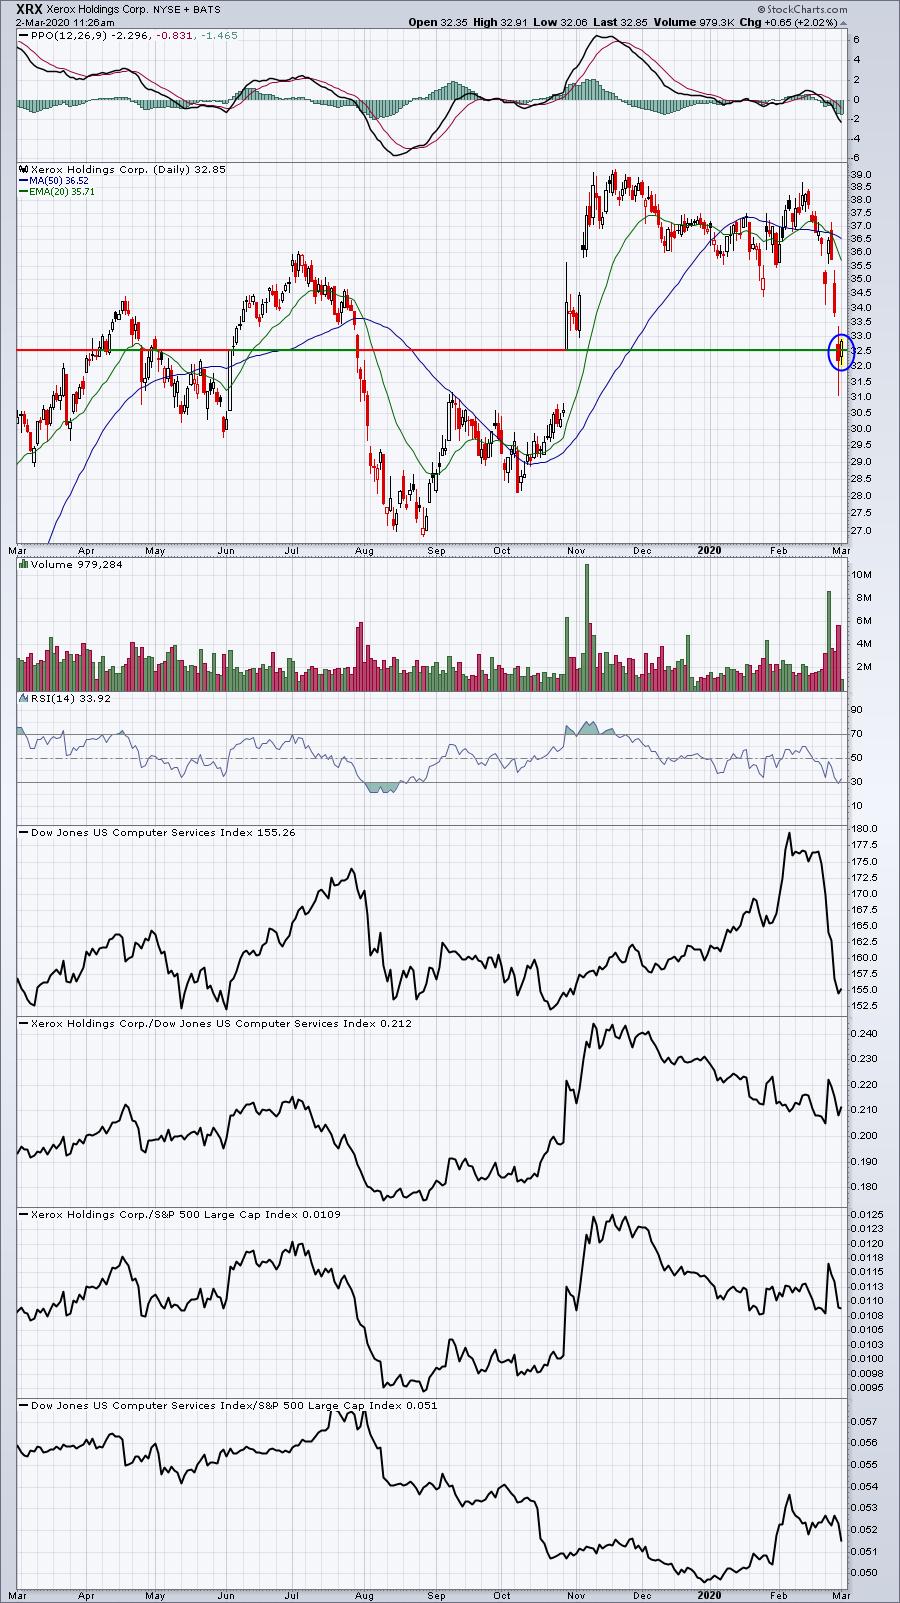
Prior to the coronavirus fears, computer services ($DJUSDV) was showing relative strength and XRX was one of the better stocks in the group. But after last week's shellacking, XRX returned to a key gap support level and it's trying to reverse today after a high wave candle on Friday. High wave candles show indecision and many times help to reverse price action.
Movers & Shakers
There are a lot of stocks that fit this description, but I'll focus on just a couple:
NVAX:
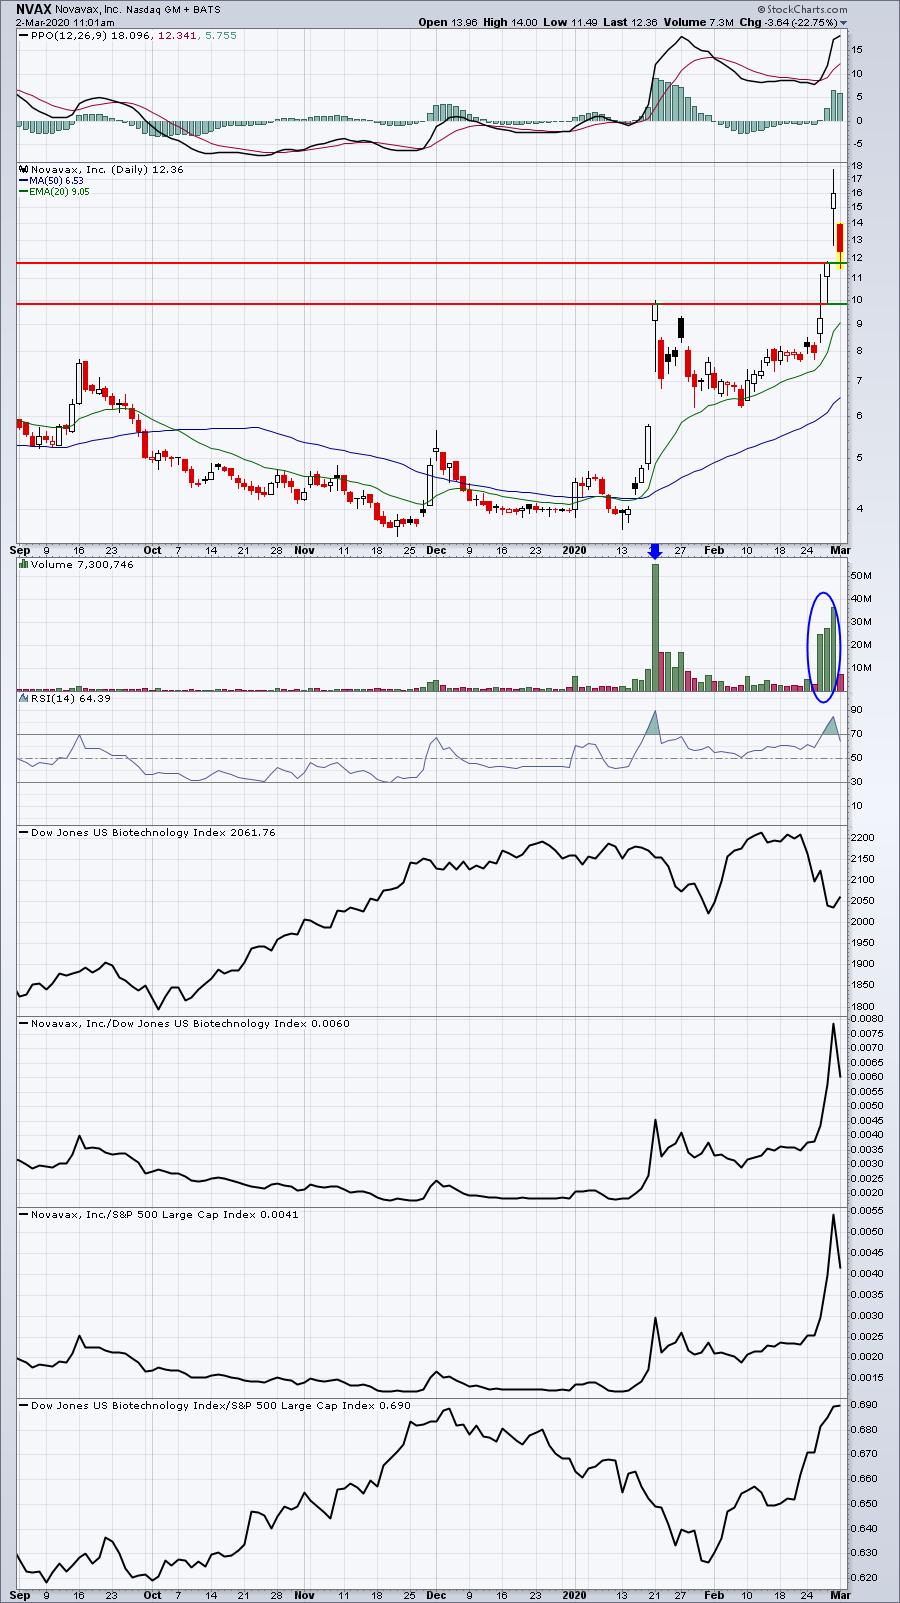
I wrote briefly about NVAX over the weekend. The company is involved in the race to find a vaccine against the coronavirus. There's been a ton of excitement for any company that offers products to aid in this battle. While there are short-term trading opportunities in stocks like NVAX, history tells us that you don't want to be the last person holding the bag, so don't even consider trading a stock like this unless you completely understand the extremely high risk associated. Having said that, the two biggest support levels in my view are at 11.80 and 9.82 and are highlighted with horizontal support lines above. Expect extreme volatility here. Trading was even halted for a few minutes this morning because of the big price swings.
BGS:
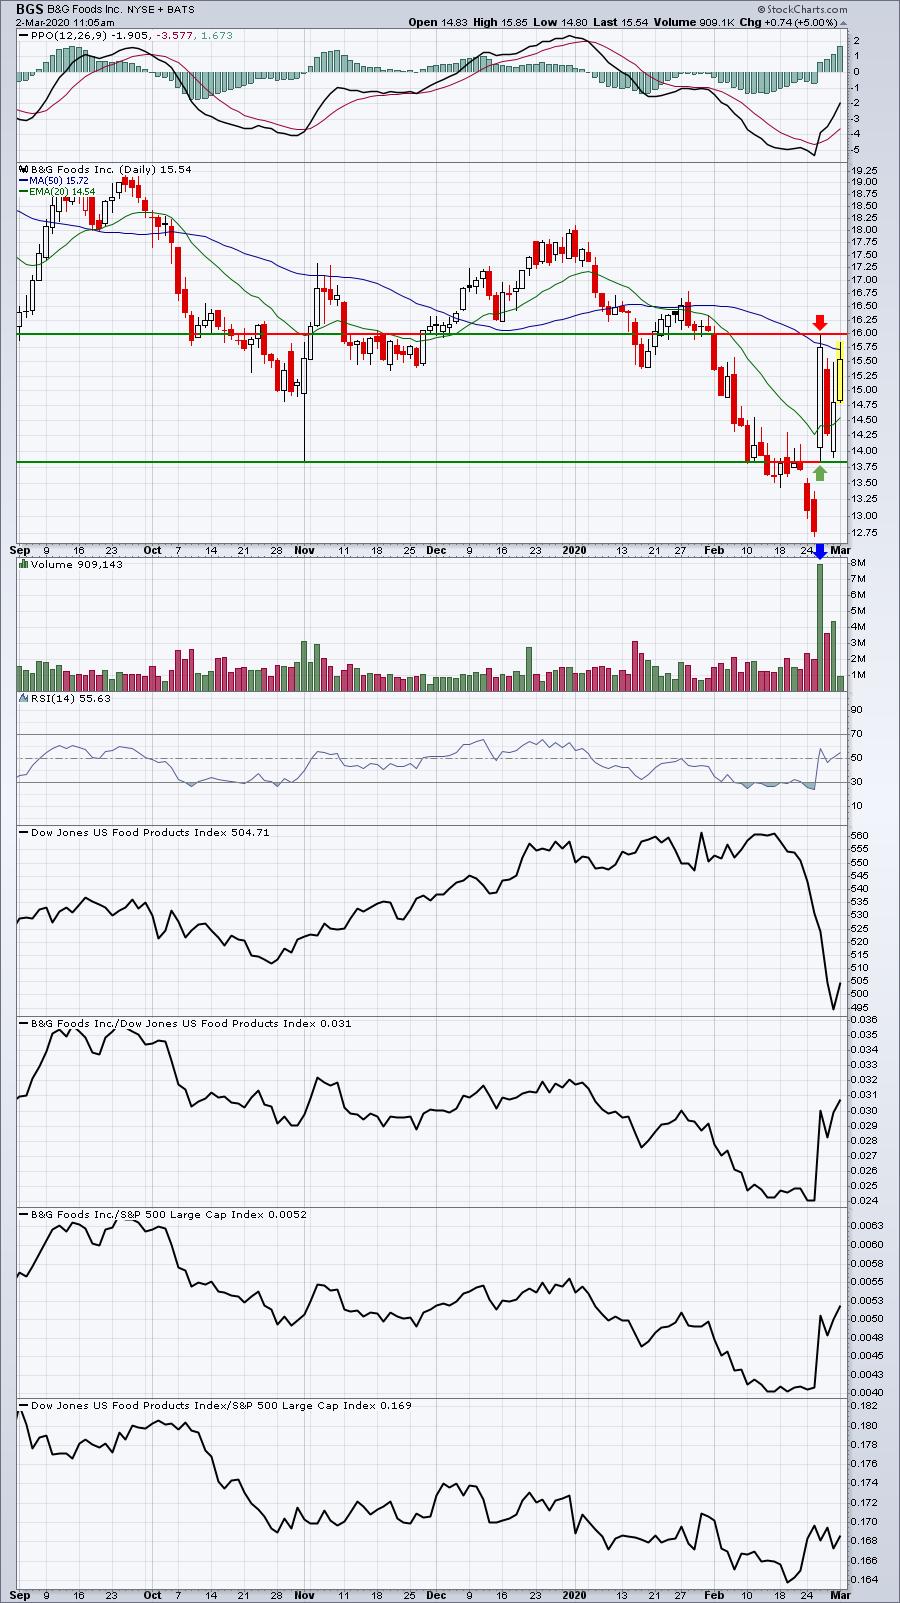
The huge up day last Wednesday established both excellent price support and key resistance, which I've marked above. Volume surged last week as BGS reported quarterly earnings that matched expectations. Apparently, after a huge decline to begin 2020, it was a relief rally as much as anything. Nonetheless, a breakout above 16 would be a bullish technical development.
Earnings Reports
Here are the key earnings reports for this week, featuring stocks with market caps of more than $10 billion. I also include a few select companies with market caps below $10 billion. Finally, any portfolio stocks (or active trade alerts) that will be reporting results are highlighted in BOLD. An asterisk (*) is placed next to stocks that are showing excellent relative strength heading into their respective earnings report. In my judgment, I'd expect strong results and guidance, although correctly predicting which way a stock might gap after an earnings report is much more difficult. If you decide to hold a stock into earnings, please understand the significant short-term risk that you are taking. Please be sure to check for earnings dates for any companies you own or are considering owning:
Monday, March 2:
JD*, STNE, XRAY. Others less than $10 bil: APPF*, PTCT*, FATE*, AMRC*, MAXR*
Tuesday, March 3:
TGT, ROST, AZO, VEEV, HPE, SE*. Others less than $10 bil: KSS, JWN, URBN, CDLX*, YEXT, CYTK*
Wednesday, March 4:
ZM*, BF.B, SPLK, DLTR, CPB, MRVL. Others less than $10 bil: GWRE, NAV*, BLDP*, VNET*
Thursday, March 5:
COST, CNQ, KR, COO, OKTA*, BURL*. Others less than $10 bil: VIPS*, TTC, CIEN*, DCI, TECD, ADT, HRB, BJ, PGNY*, REGI*, SGRY*
Friday, March 6:
None
Economic Reports
February PMI manufacturing index: 50.7 (actual) vs. 50.8 (estimate)
February ISM manufacturing index: 50.1 (actual) vs. 50.4 (estimate)
January construction spending: +1.8% (actual) vs. +0.6% (estimate)
Happy trading!
Tom