
EB Daily Market Report - Tuesday, March 3, 2020
Special Note
In my weekend Don't Ignore This Chart blog article, I offered StockCharts visitors a list of 5 biotech stocks that are showing relative strength. These companies have been mentioned to EarningsBeats.com members several times over the past few months and four of the five are included in our portfolios. Biotechs ($DJUSBT) continue to perform well on a relative basis so I want to make sure that our members receive this list before I send it out to the EB Digest subscriber list tomorrow morning. Here is the link (make sure you use the password that I provide below the link, not your StockCharts.com password):
Password: BT246
Executive Market Summary
- Futures were extremely volatile and that volatility has carried over into today's trading session
- The Federal Reserve cut interest rates 50 basis points after the market opened
- Traders seem to be most interested in the safety of treasuries and defensive sectors, not a great signal for this rebound
- 10 year treasury yield ($TNX) is down 5 basis points to 1.03%, despite an earlier surge to 1.16% after the Fed cut rates
- Real estate (XLRE) and utilities (XLU) are leading today's action
- Gold ($GOLD) is up $53 per bounce, another fear signal
- We have no active trade alerts at this time
Market Outlook
The good news is that the Federal Reserve announced at 10am EST that they were lowering the fed funds rate by 50 basis points. The bad news is that U.S. stocks had been rebounding in anticipation of that news and, after an initial pop higher, sold off on the news. It's what we see with earnings so often: Buy on rumor, sell on news. We saw an initial push higher in the 10 year treasury yield ($TNX), but it quickly fell back to new lows:
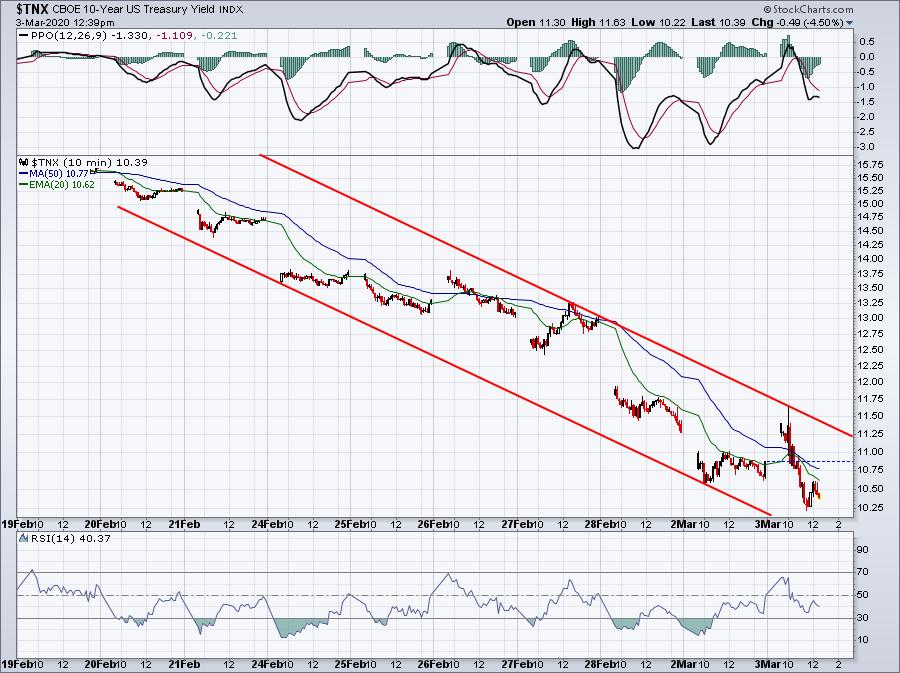
It makes it much more difficult for equities to maintain their rally without money rotating from treasuries. It can still happen, I'm just pointing out that the likelihood isn't as great. So long as the market remains fearful, equities are not likely to be the first choice among professionals.
Technically (and quite honestly I'm not sure how much I'd trust technicals right now), here's what I'd look for on the S&P 500 chart in the very near-term:
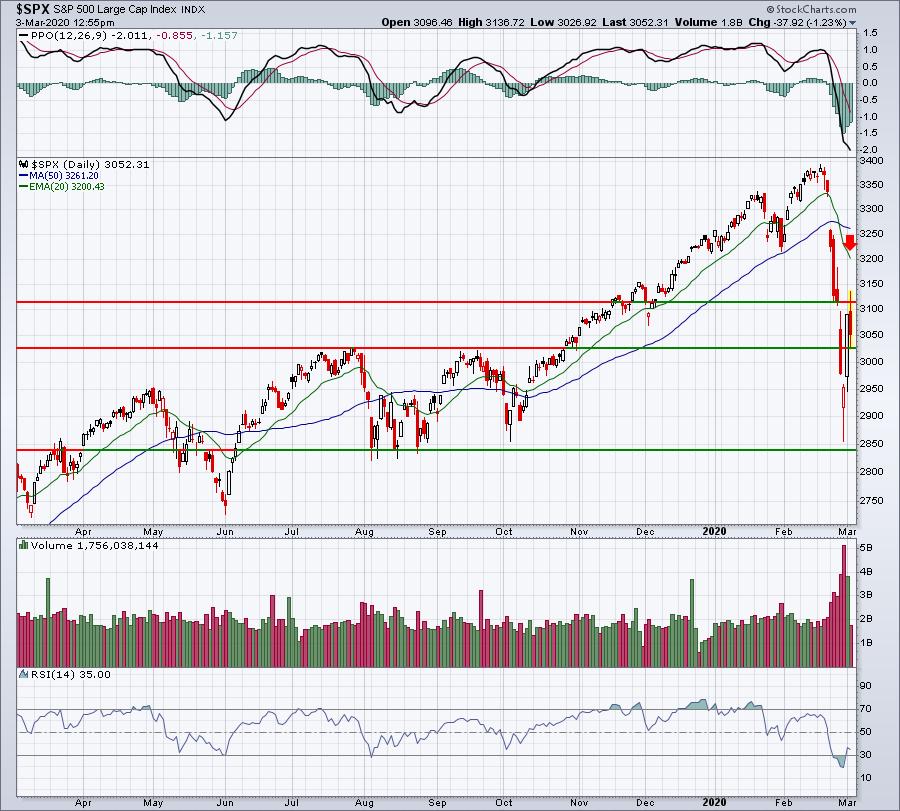
If we can clear today's high, then the 20 day EMA becomes our next target. However, if we instead turn lower and lose 3025 support (note the bounce earlier at 3026), I'd expect to see the VIX ramp up again and that could spell more impulsive selling ahead.
I remain extremely cautious right now with little desire to try to predict (guess) which way emotions will drive the market in the very near-term. As I've said before, if you're a longer-term investor, I believe this will be a hiccup on the chart later this year or in 2021. What happens between now and then is up for grabs.
Sector/Industry Focus
One look at the sector leaderboard tells us what we need to know right now. The market is remaining cautious and on high alert. I've said on many occasions that I don't like to trade a highly volatile market and currently the VIX stands at 33 after dropping to 25 earlier. The 10 year treasury yield ($TNX) spiked to 1.16% after the Fed's 50 basis point reduction to the fed funds rate. This was widely anticipated by our financial markets, so after an initial pop in both the TNX and U.S. equities, the selloff resumed. There's been a ton of back and forth action and I'd expect more of the same. For now, however, check out the makeup of the sector leaderboard:
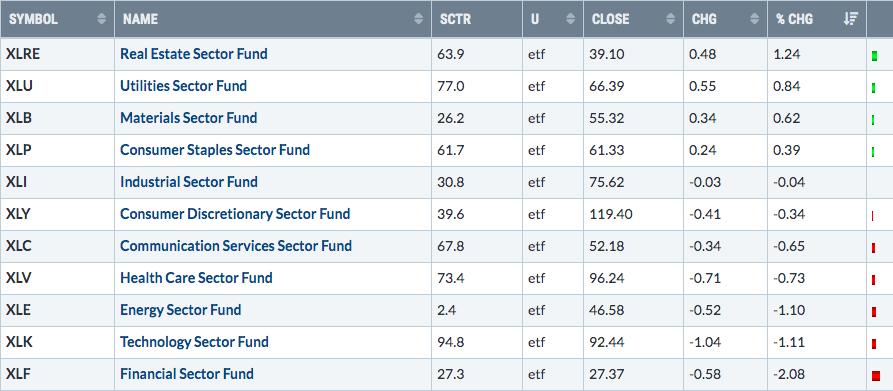
Real estate, utilities and consumer staples are among the top 4 performing sectors. Technology and financials, two aggressive sectors, are at the bottom of the leaderboard as you can see. I don't like to see the selling there after the rate cut.
Still, anything is possible with the VIX in the 30s. I may sound like a broken record, but I've been around the block a few times when we enter these highly volatile periods and it's very difficult to predict the intraday swings....and even the day-to-day swings. I had a 10-15 minute discussion on this very topic in my Trading Places LIVE show at StockCharts TV this morning. If you have an opportunity, you might want to check it out:
https://www.youtube.com/watch?v=hydx3XHHtIk
Active Trade Alerts
We have no active trade alerts at this time.
Strong Earnings ChartList (SECL)
While I'm rarely trading anything in this market, it's not like I'm not doing my homework. I'm spending a lot of time researching relative strength on the stocks on our SECL to identify solid targets when the dust settles. For instance, eHealth, Inc. (EHTH) has rebounded in a huge way the past couple days and is a clear relative strength leader. Should the stock market move lower again, EHTH would stand out as a stock I might want to consider, especially if I can catch it at or near key price support:
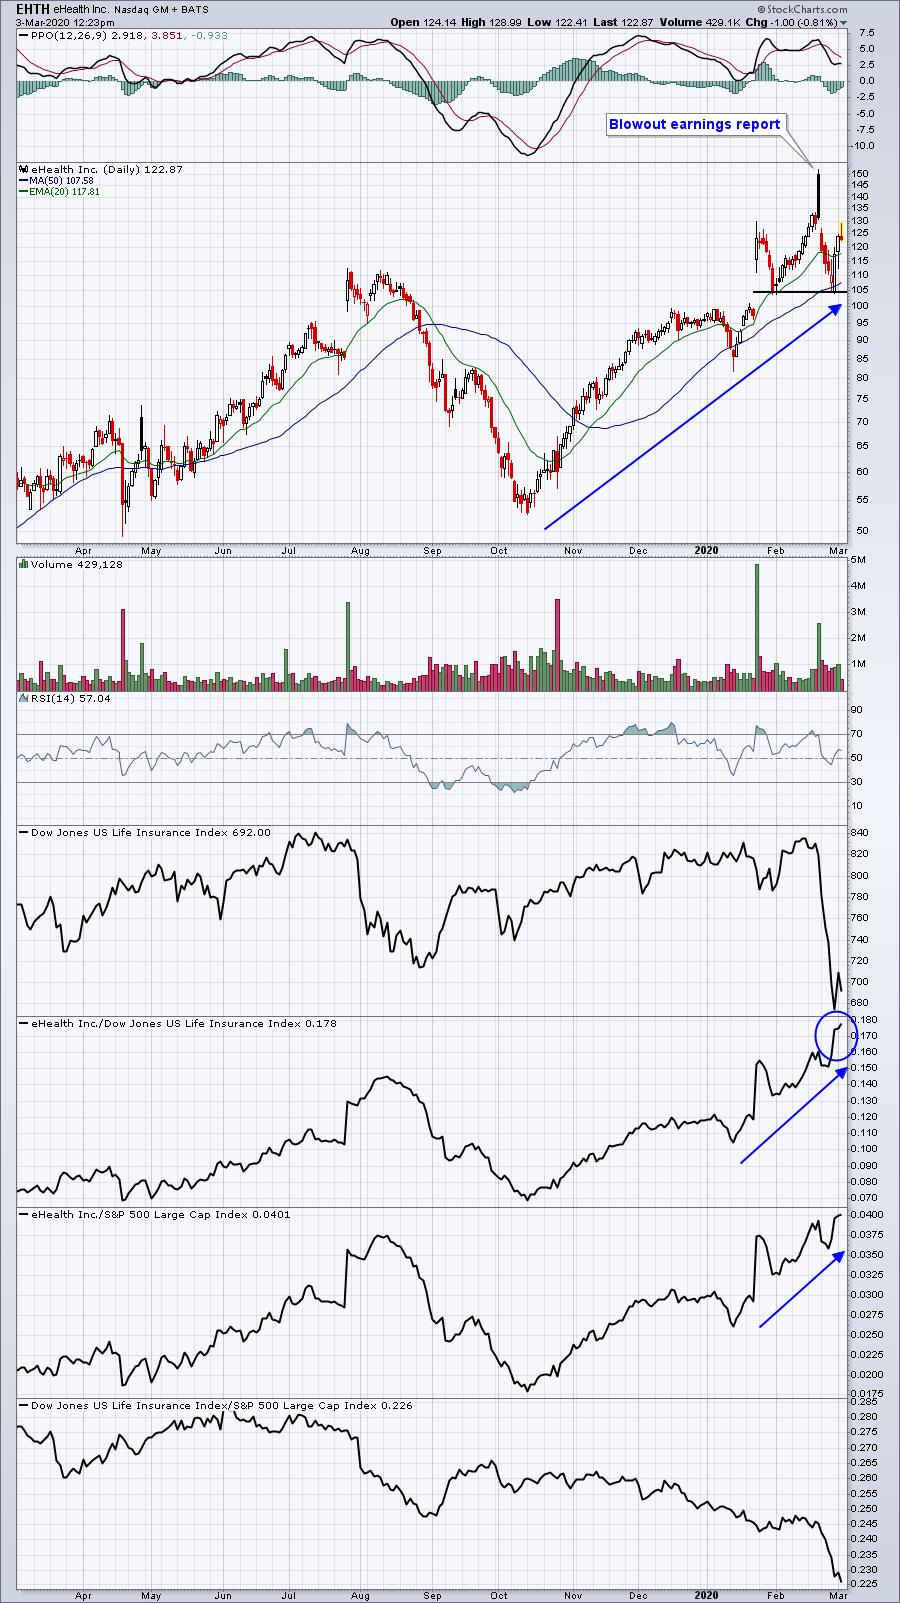
First, check out the blue circle that highlights yet another relative high for EHTH. What this tells us is that as soon as the buying resumes, money flows heavily towards this leader. That's great knowledge to have.
Second, you might look at the chart above and think "topping head & shoulders". I see that 105 level as a potential neckline as well. But if the market were to weaken and EHTH sold off below 105 on an intraday basis and recovered into the close at the same time that I was looking for potential rebound candidates, EHTH would stick out as a primary trading candidate.
Going through the SECL and identifying stocks like EHTH is something I'd suggest everyone do. In addition, our industry group relative strength ChartList should be reviewed to see which areas of the market are outperforming given this new set of economic circumstances and conditions.
Movers & Shakers
It's hard to ignore the fact that Charles Schwab (SCHW) has already lost key price support from last week - and that's with a MAJOR rebound in U.S. equities off the early-Friday morning low:
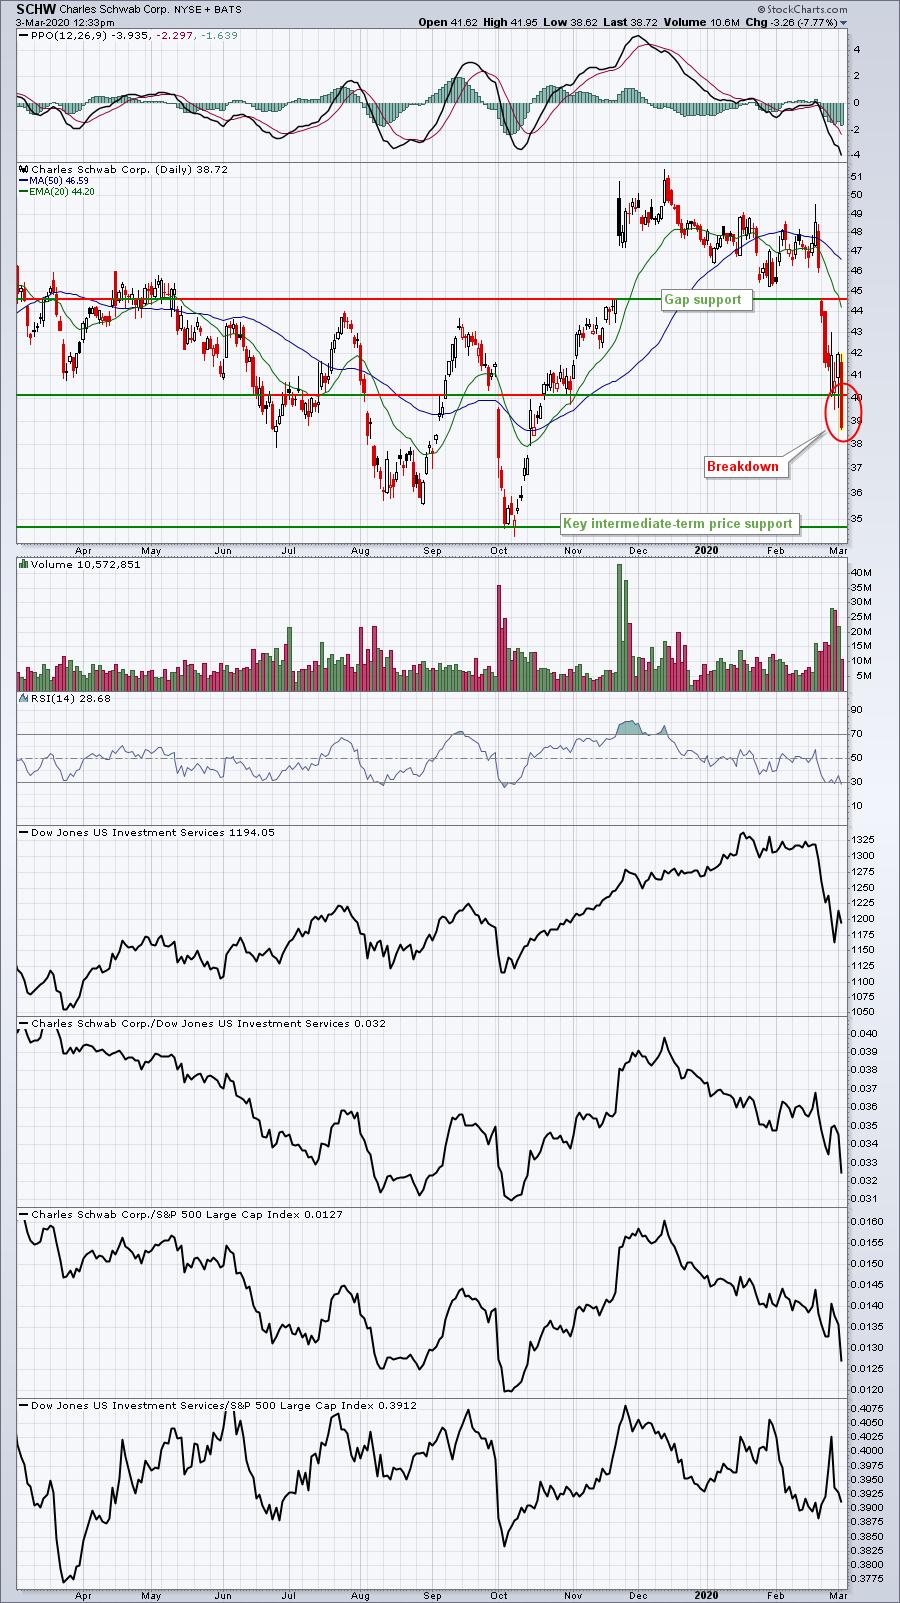
Stocks that have already lost price support from last week are definitely stocks I'd avoid. It's a signal their relative strength is deteriorating rapidly. SCHW's relative strength lines since December have been in a severe downtrend. I would avoid a stock like this until it begins to show relative strength and increasing volume, which would suggest institutional accumulation.
Earnings Reports
Here are the key earnings reports for this week, featuring stocks with market caps of more than $10 billion. I also include a few select companies with market caps below $10 billion. Finally, any portfolio stocks (or active trade alerts) that will be reporting results are highlighted in BOLD. An asterisk (*) is placed next to stocks that are showing excellent relative strength heading into their respective earnings report. In my judgment, I'd expect strong results and guidance, although correctly predicting which way a stock might gap after an earnings report is much more difficult. If you decide to hold a stock into earnings, please understand the significant short-term risk that you are taking. Please be sure to check for earnings dates for any companies you own or are considering owning:
Tuesday, March 3:
TGT, ROST, AZO, VEEV, HPE, SE*. Others less than $10 bil: KSS, JWN, URBN, CDLX*, YEXT, CYTK*
Wednesday, March 4:
ZM*, BF.B, SPLK, DLTR, CPB, MRVL. Others less than $10 bil: GWRE, NAV*, BLDP*, VNET*
Thursday, March 5:
COST, CNQ, KR, COO, OKTA*, BURL*. Others less than $10 bil: VIPS*, TTC, CIEN*, DCI, TECD, ADT, HRB, BJ, PGNY*, REGI*, SGRY*
Friday, March 6:
None
Economic Reports
None
Happy trading!
Tom