
EB Daily Market Report - Thursday, March 5, 2020
Executive Market Summary
- Bears were back in control this morning with the Dow Jones opening more than 2% lower
- The flight to safety continues today with the 10 year treasury yield ($TNX) falling to 0.94%, down 5 bps
- Gold ($GOLD) is currently higher by $17 per ounce, moving closer to the February 24th high of $1691
- Defensive sectors are leading today as our major indices drop; technology (XLK) holds up relatively well
- Financials (XLF) are getting hit hard due to the falling treasury yields - more on this below
- Cruise lines and airlines are deep in the red once again, leading the S&P 500 lower
- We have no active trade alerts at this time
Market Outlook
Technicians often use Fibonacci retracement analysis tools to help identify potential areas for reversals after lengthy uptrends or downtrends. Given the huge selloff that we've experienced and what appears to be a solid short-term support level (last Friday's low) in place, it's probably a good idea to revisit Fibonacci as we analyze the current market environment:
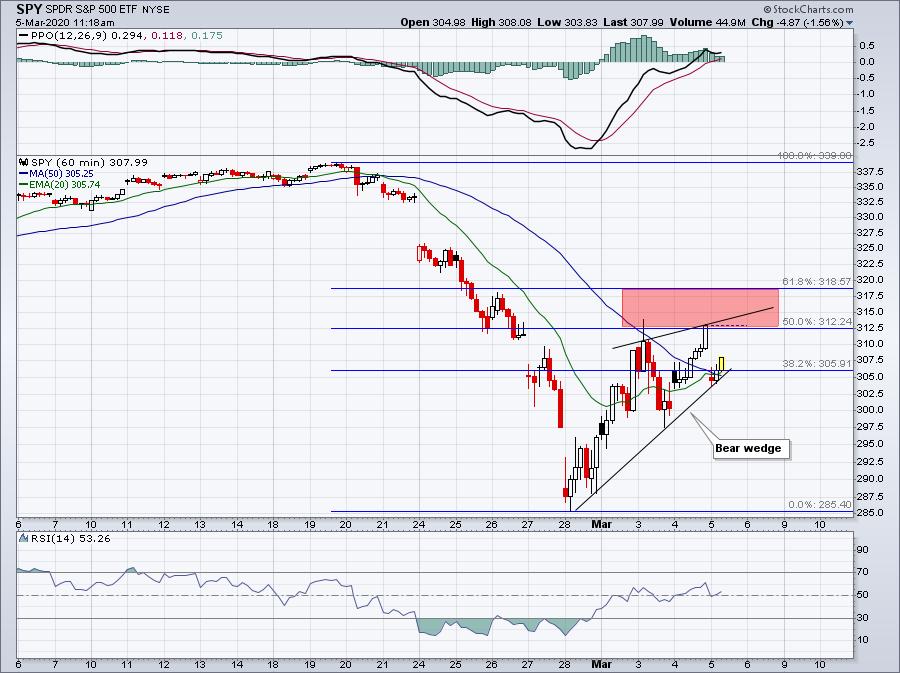
The 50.0% and 61.8% Fibonacci retracement levels are 312.24 and 318.57, respectively. Not shown above are the 20 day EMA and 20 week EMA on the SPY, which currently are 317.70 and 315.93, respectively. Those are all key areas of resistance for technical traders and that all are in that 312.24-318.57. Until the SPY can negotiate all of those levels on a closing basis, I'd continue to exercise extreme caution from a short-term trading perspective.
There's also a potential bear wedge pattern in play that would execute if the SPY were to drop beneath the 304-305 level. That could trigger more intraday impulsive selling.
Sector/Industry Focus
Financials (XLF) are being hit the hardest the past week as the following sector leaderboard shows:
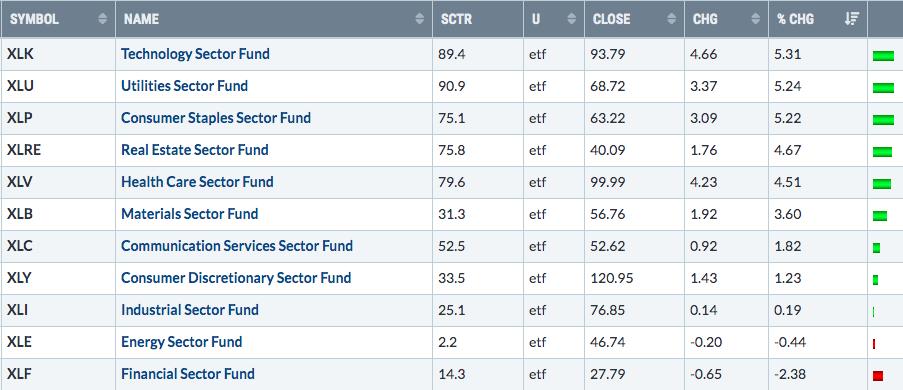
It's one of only two sectors failing to gain ground the past week, with energy (XLE) being the other. In addition to coronavirus fears, the massive drop in the 10 year treasury yield ($TNX) is having a major impact as well. Here's a long-term chart of the relative performance of financials vs. the S&P 500 (XLF:$SPX) with the TNX in the panel below. Finally, the bottom panel shows the correlation between the relative strength of the XLF and the direction of the TNX. You can see that they're highly correlated:
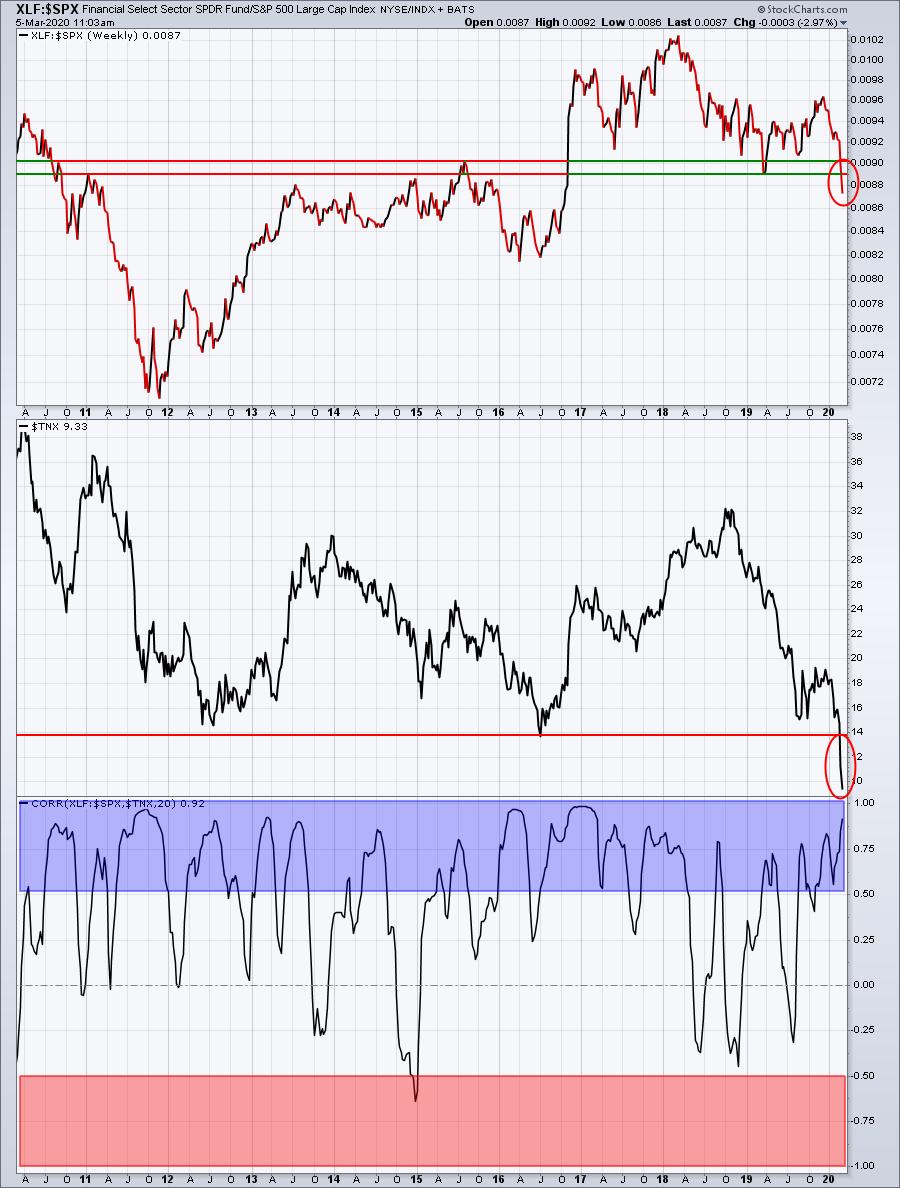
The TNX is breaking down and that's a big reason why financials are underperforming and breaking down on a relative basis. The blue-shaded and red-shaded areas highlight strong positive correlation (> 0.5) and negative correlation (< -0.5), respectively. It's clear from the above chart that the falling treasury yields that we're seeing is having a serious adverse effect on the financial sector.
Active Trade Alerts
We have no active trade alerts at this time.
Strong Earnings ChartList (SECL)
One way to see stocks that are outperforming on our SECL is simply to pull up a "Summary" of the ChartList and then sort it based on one week performance. Here are all of the SECL stocks that have rallied more than 10% over the past week:
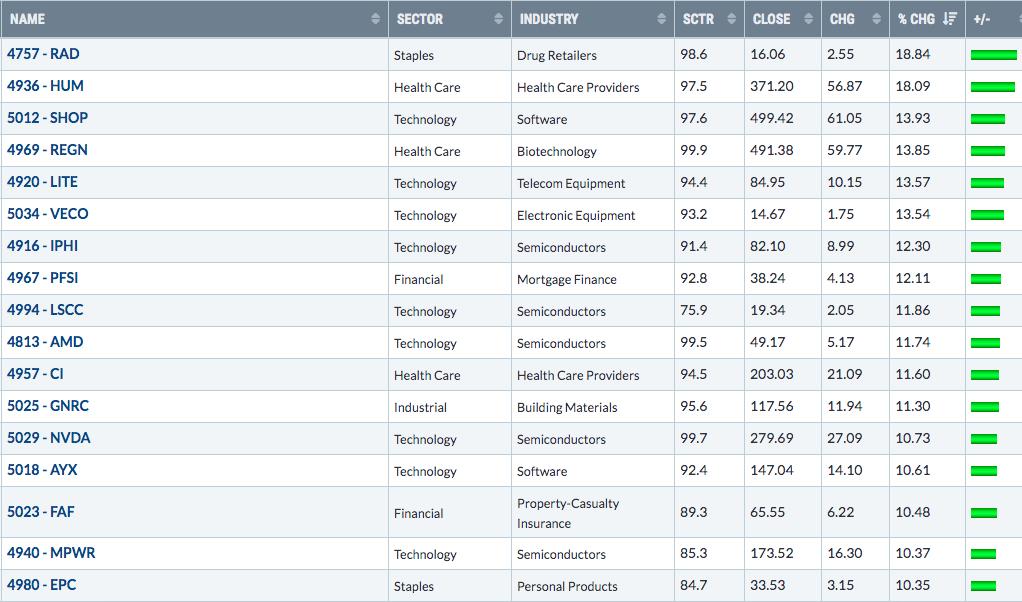
Of these 17 stocks, 9 are in the technology sector (XLK). So while technology struggled a bit yesterday on a relative basis, one longer-term sign is that many of the technology names on our SECL continue to perform quite well on a relative basis. These are stocks we may want to pay particular attention to when the fear subsides.
Movers & Shakers
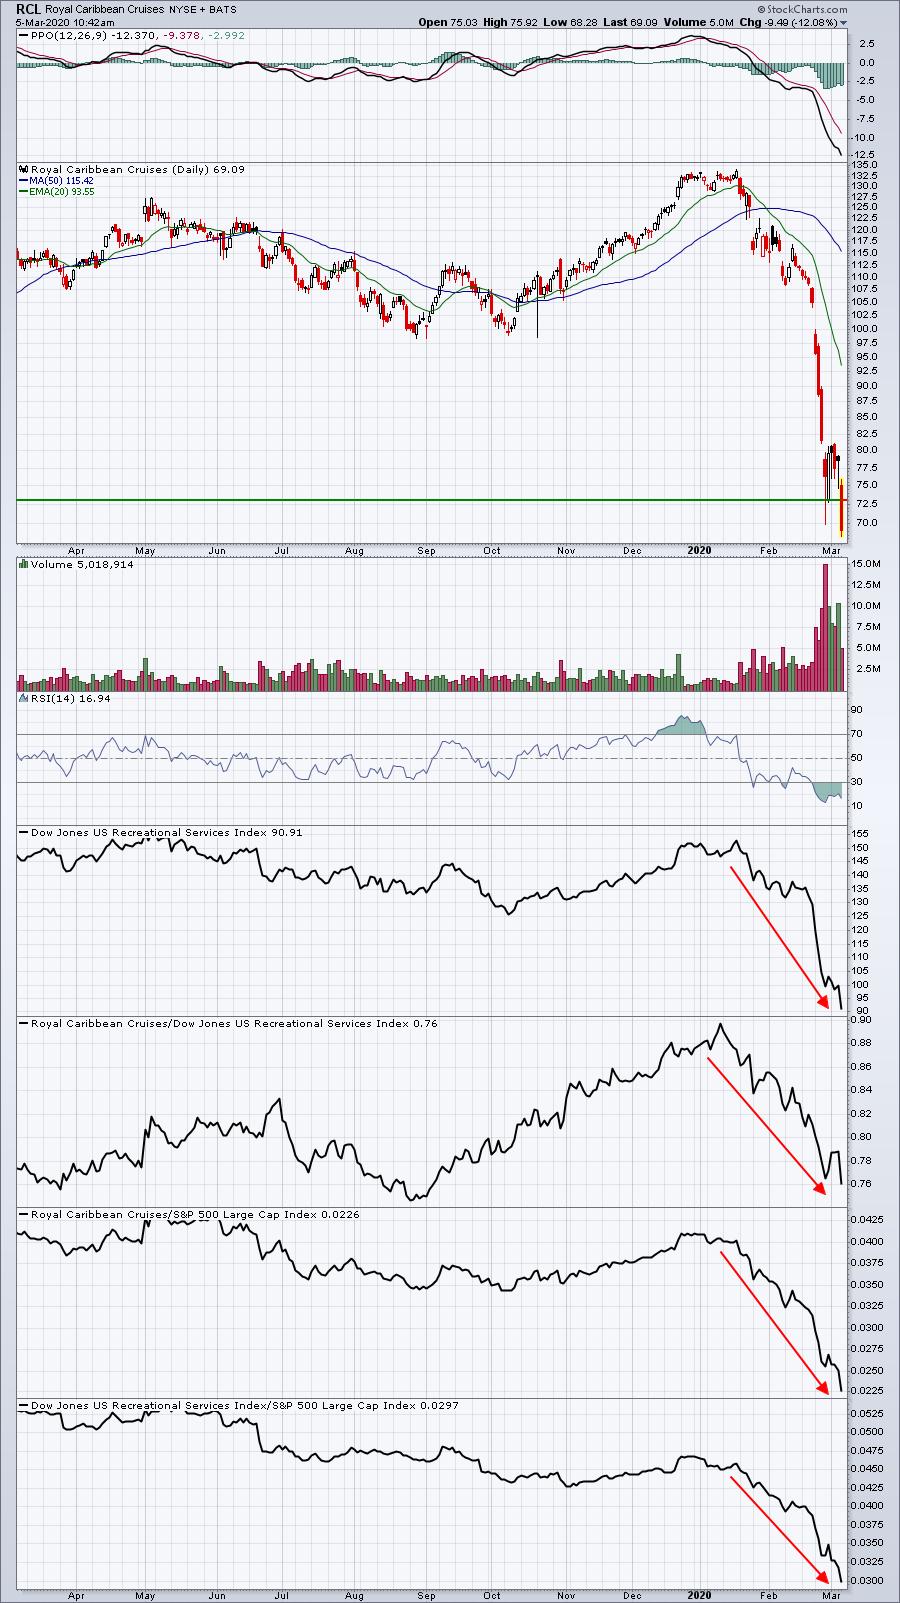
The two worst performers in the S&P 500 today are two cruise lines, Royal Caribbean Cruises (RCL) and Norwegian Cruise Line Holdings (NCLH). Watching the stocks in this industry, along with airlines ($DJUSAR) could help determine when the fears are beginning to settle down or have become totally irrational. For now, these groups keep moving lower.
RCL:
NCLH:
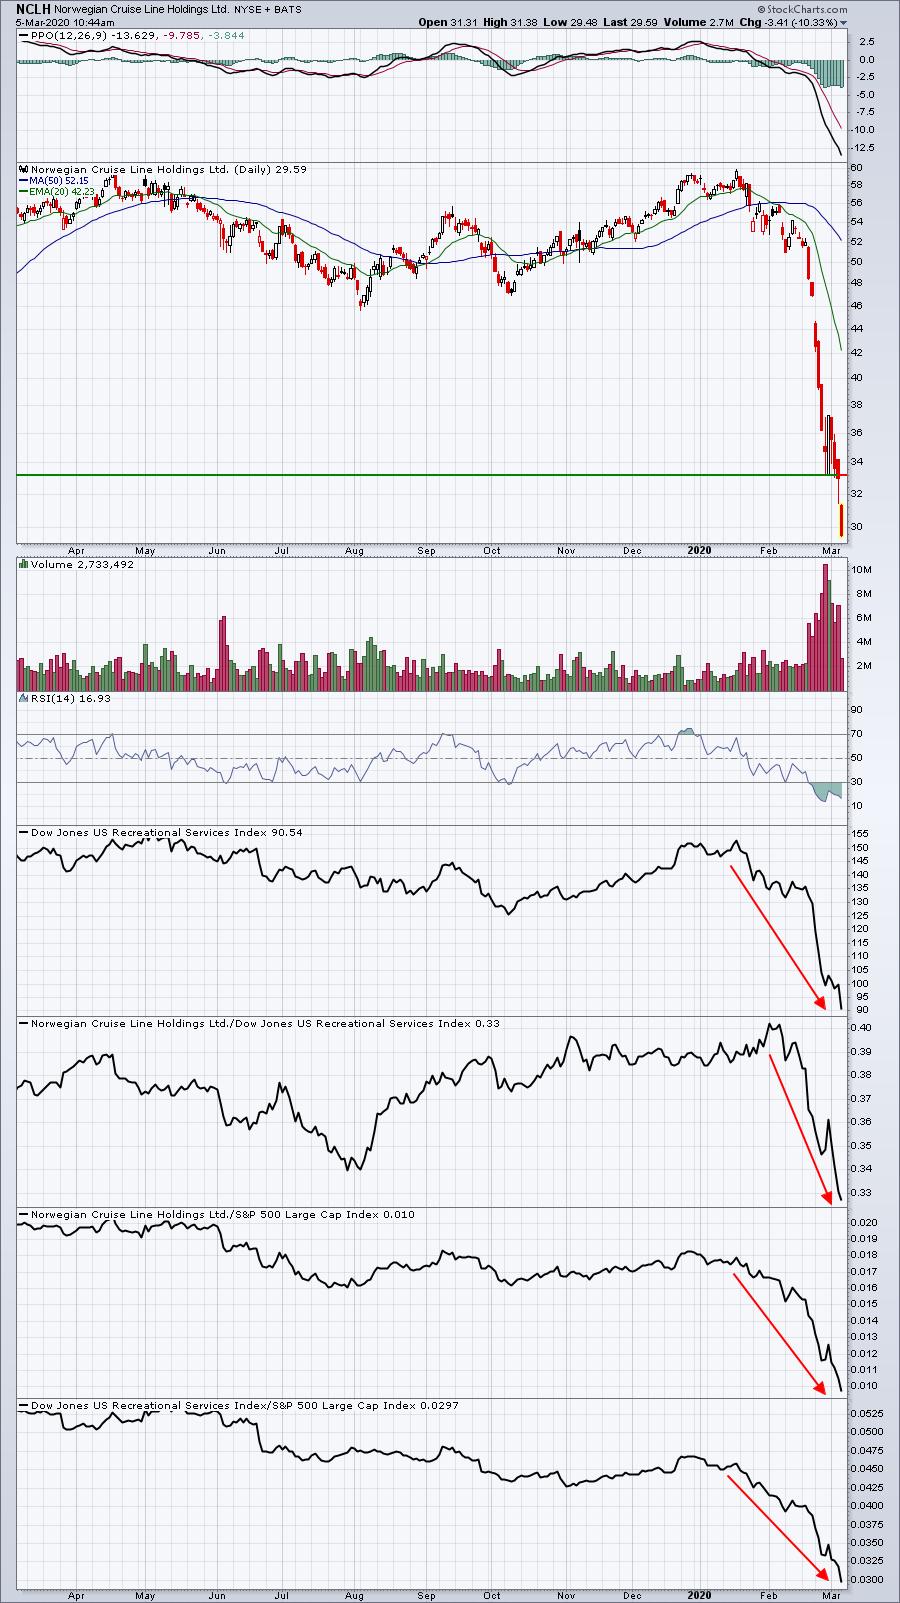
Both of these stocks making new lows reminds us that there still remains plenty of fear in the stock market. It stands to reason that if coronavirus fears begin to lessen, these are two stocks that would benefit dramatically. However, we're not seeing any recovery yet.
Earnings Reports
Here are the key earnings reports for this week, featuring stocks with market caps of more than $10 billion. I also include a few select companies with market caps below $10 billion. Finally, any portfolio stocks (or active trade alerts) that will be reporting results are highlighted in BOLD. An asterisk (*) is placed next to stocks that are showing excellent relative strength heading into their respective earnings report. In my judgment, I'd expect strong results and guidance, although correctly predicting which way a stock might gap after an earnings report is much more difficult. If you decide to hold a stock into earnings, please understand the significant short-term risk that you are taking. Please be sure to check for earnings dates for any companies you own or are considering owning:
Thursday, March 5:
COST, CNQ, KR, COO, OKTA*, BURL*. Others less than $10 bil: VIPS*, TTC, CIEN*, DCI, TECD, ADT, HRB, BJ, PGNY*, REGI*, SGRY*
Friday, March 6:
None
Economic Reports
Initial jobless claims: 216,000 (actual) vs. 215,000 (estimate)
Q4 productivity: 1.2% (actual) vs. 1.4% (estimate)
January factory orders: -0.5% (actual) vs. -0.1% (estimate)
Happy trading!
Tom