
EB Daily Market Report - Friday, March 6, 2020
Executive Market Summary
- Futures plunged again today, but we have seen some recovery since the opening bell
- Still, our major indices are lower by 2.00%-2.50% and it's fluid - moving quickly
- Crude oil prices ($WTIC) have tumbled 8% today, threatening 4 year price support in the 40.00-42.00 range, as OPEC fails to reach a deal
- As might be expected, energy (XLE, -5.69%) is leading to the downside, while tumbling 10 year treasury yields ($TNX) are pressuring financial stocks (XLF, -3.52%); the TNX is down 20 bps to 0.72%
- Defensive sectors are down, but leading on a relative basis
- Volatility ($VIX) surged to touch 50 this morning - that is an extreme reading historically
- Nonfarm payrolls were very strong for February, but the market is ignoring current economic conditions
- We have no active trade alerts at this time
Market Outlook
Yesterday, I focused on a short-term chart of the SPY and highlighted Fibonacci retracement levels and a bearish wedge pattern that had taken shape. Today, I can show you the result of it:
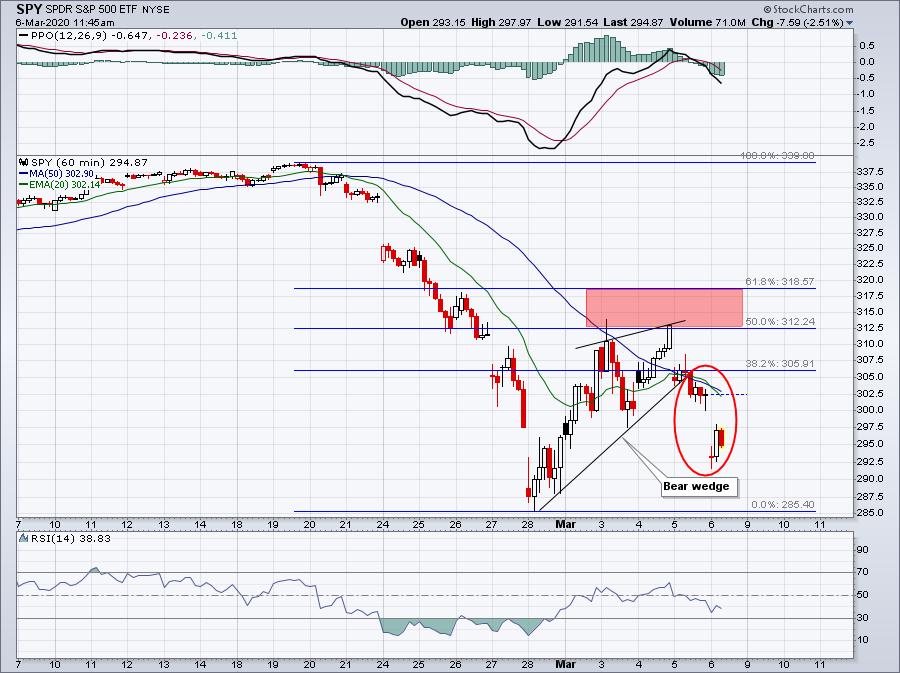
If you're trading a bounce on the long side, watching these types of patterns helps you to establish a pre-defined level of support to keep a stop in place. You can see the result of breaking down from this bearish pattern.
Fibonacci levels can be critical to watch after steep declines like the one we witnessed. I wrote in my Trading Places blog at StockCharts.com this morning about how Fibonacci retracement levels can really help identify pivot points during rallies. You can check it out here:
https://stockcharts.com/articles/tradingplaces/2020/03/when-volatility-vix-is-this-hi-809.html
Be sure to scroll down below my name and subscribe to my blog. It's free and then every time I post a blog article there, it'll be sent directly to your email.
Sector/Industry Focus
I'm not a big fan of gold ($GOLD), but the short-term has been very bullish as fear drives traders away from equities and looking for shelter. Gold is a shelter during very volatile times and it's reflected in the chart below:
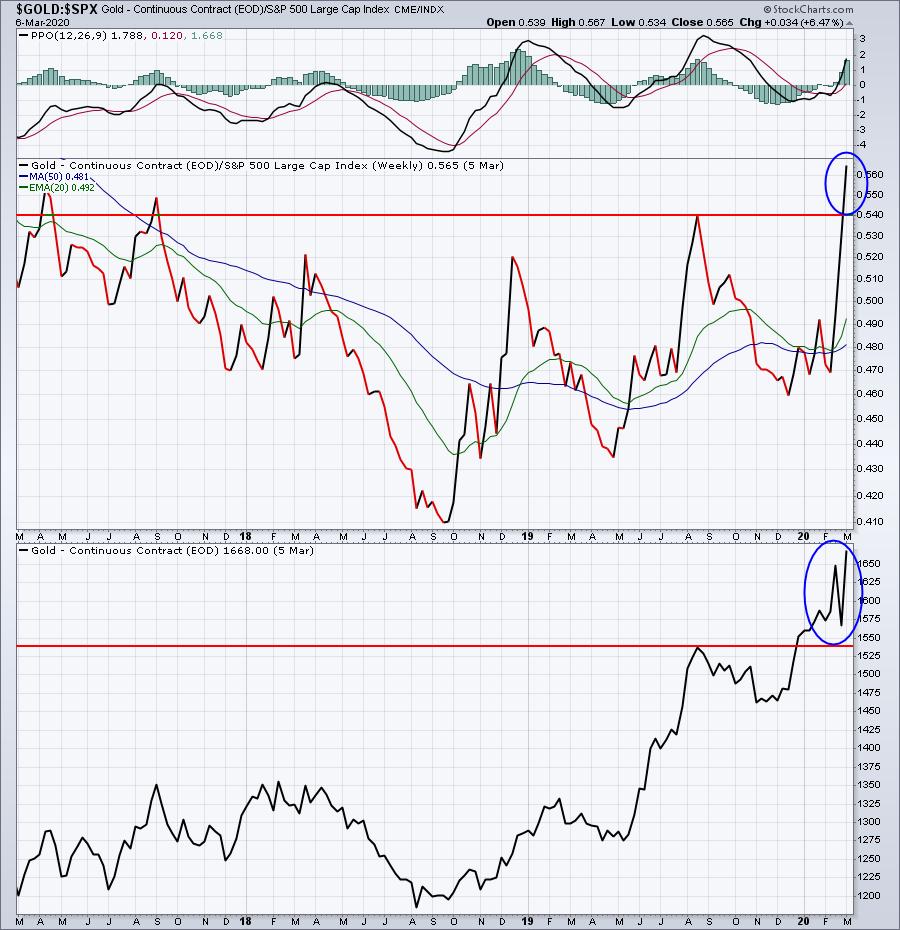
The absolute strength is excellent and gold has clearly been an outperformer in 2020, breaking to new relative highs. When the stock market settles down, I expect gold to underperform again. However, the charts will tell us when that underperformance has begun. It hasn't happened yet.
Active Trade Alerts
We have no active trade alerts at this time.
Strong Earnings ChartList (SECL)
Today, I just want to focus on relative strength of industry groups. For those of you that are annual members and also at least Extra members at StockCharts.com, you should have a copy of our Relative Strength Industry Group ChartList (RSICL). If you don't, contact us at "[email protected]" and we'll make sure you get a copy. If you'd like to become an annual member or would like details on becoming an annual member, also write us at that same email. Annual membership will save you a lot of money over the course of a year.
I frequently look at a Summary of our RSICL to quickly gain an understanding of where Wall Street is redirecting its money. Here are the top 10 industry groups over the past month:
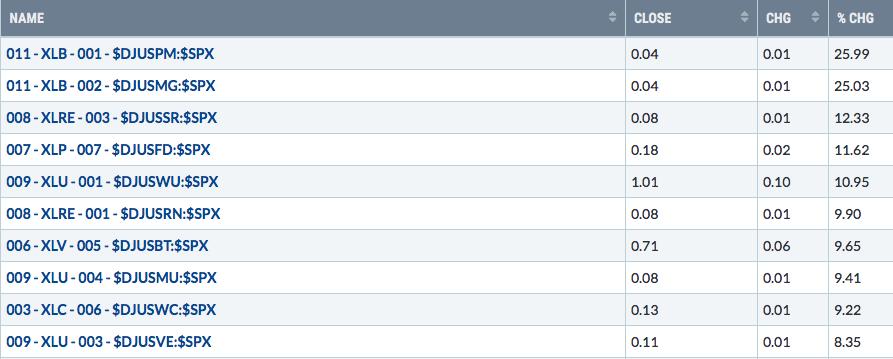
Most of the leading groups are defensive in nature, which makes sense given all the volatility and selling that we've seen in the market. But the 7th group on this list is the biotech group ($DJUSBT). I've been discussing their improving relative strength recently and now it's beginning to show up here. Biotechs, unless conditions change, will be a focal point for me as we move through 2020.
Movers & Shakers
Crude oil prices ($WTIC) are down a staggering 8%+ to $42.00 per barrel today and it's weighing heavily on many energy-related names. Here are just a couple that are seeing fresh new lows, after an already-huge decline in 2020:
OXY:
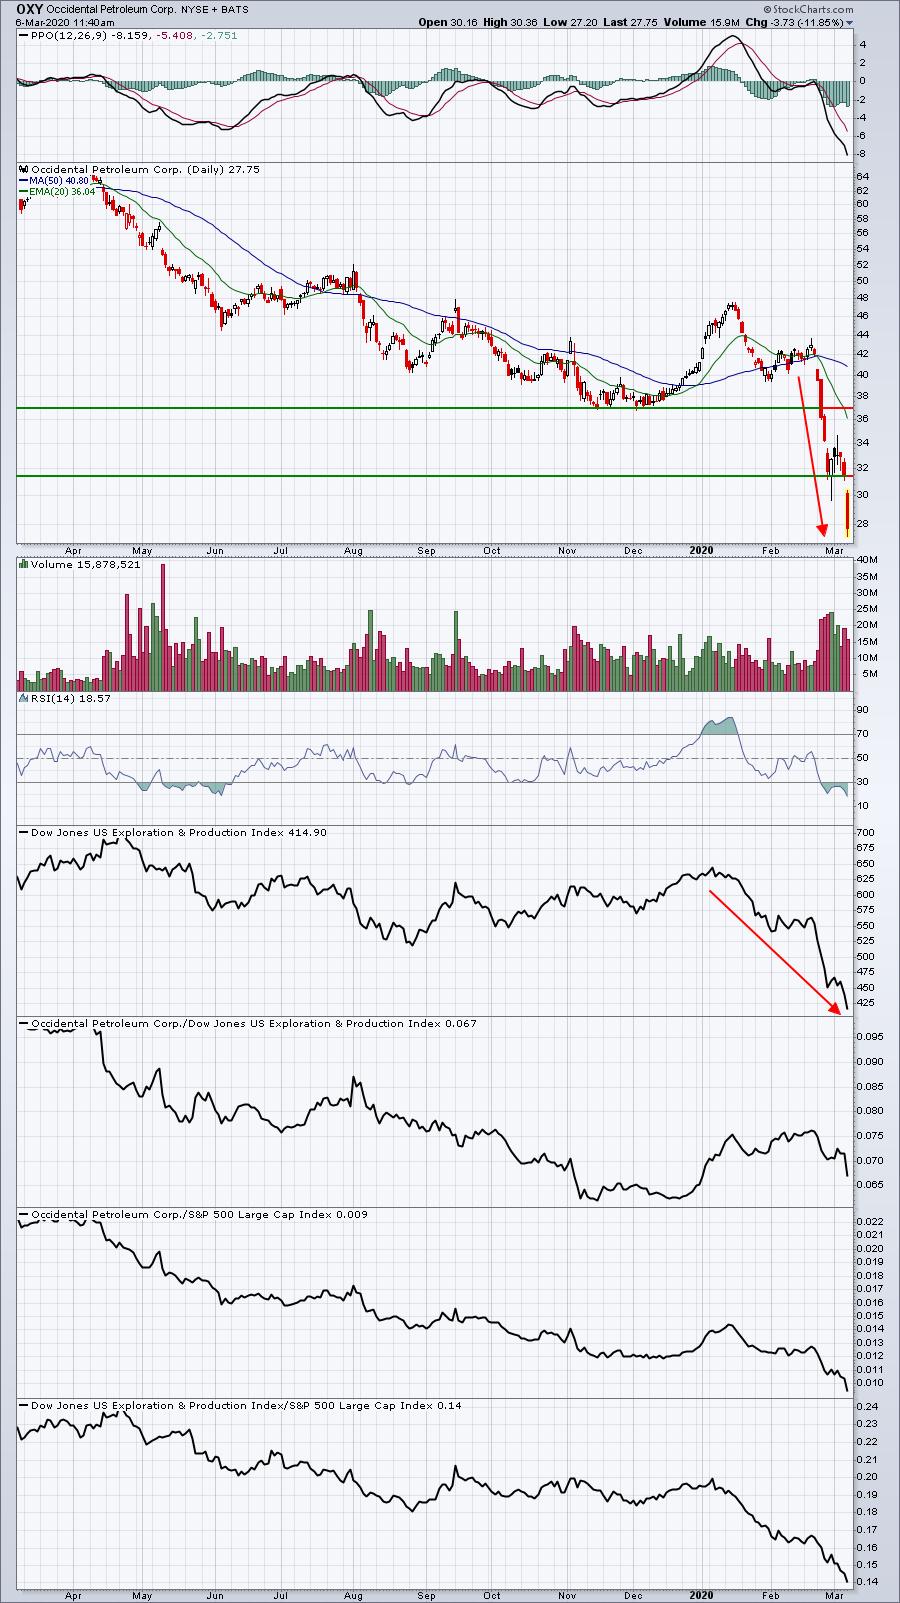
Support in the 31-32 range didn't last long here. I'm not a fan of catching fall knives, so I'd have to wait to see a massive, high volume, reversing candle print.
DVN:
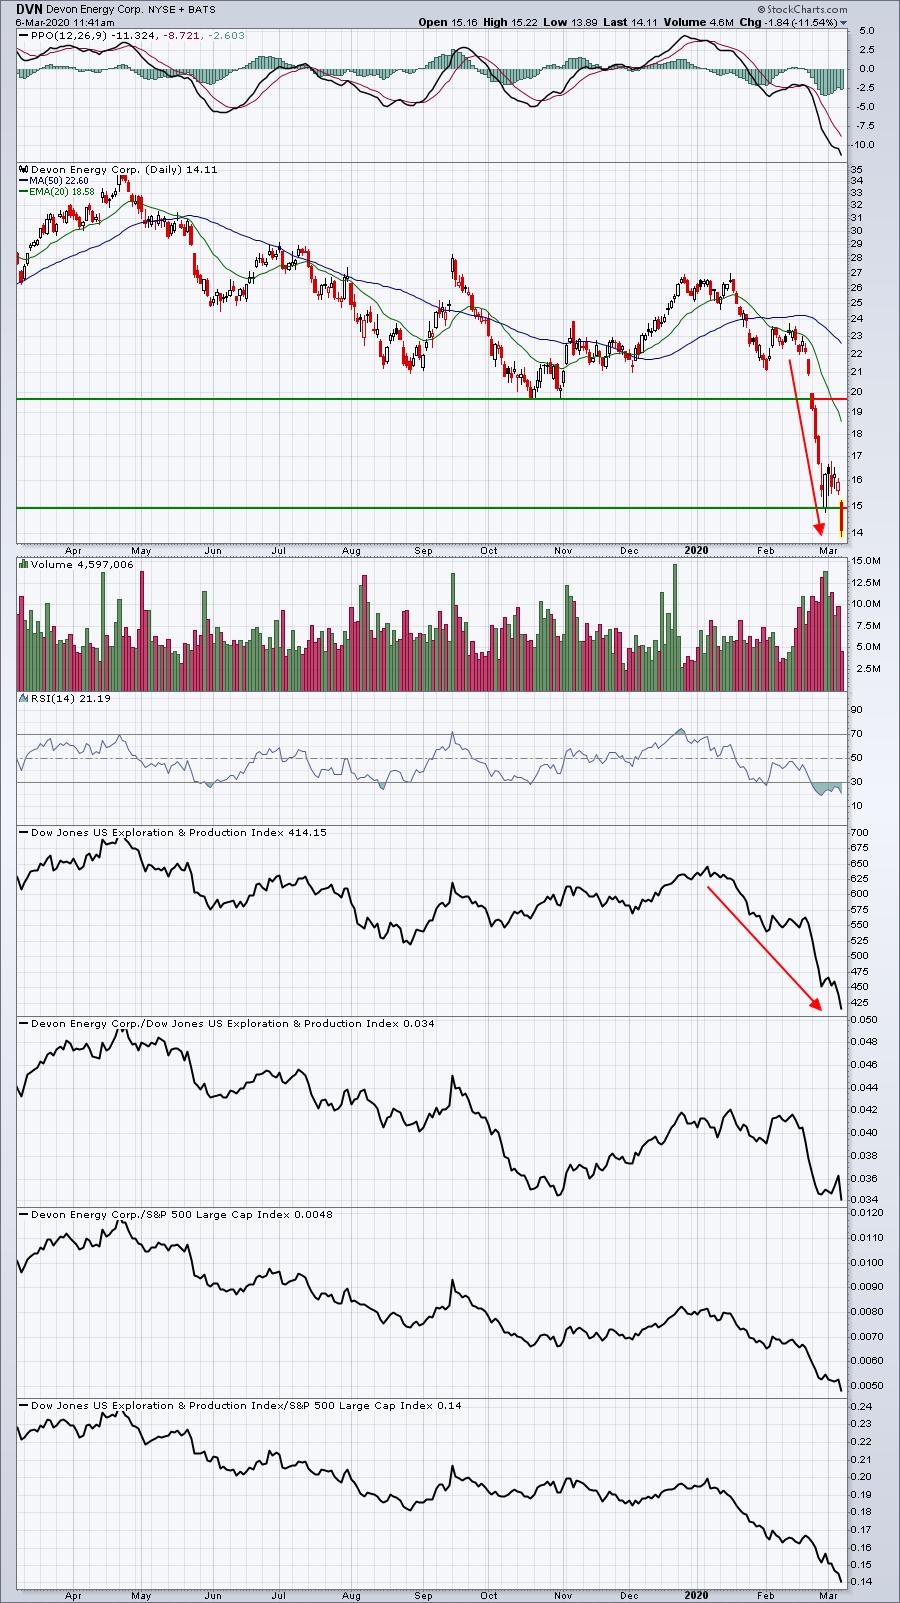
DVN shows price support near 15 and the stock opened above that level, while currently trading well beneath it. If DVN could reverse today and close back above 15, I could argue for a short-term bounce. But you'd need to be an aggressive trader to take on that kind of risk.
Earnings Reports
Here are the key earnings reports for this week, featuring stocks with market caps of more than $10 billion. I also include a few select companies with market caps below $10 billion. Finally, any portfolio stocks (or active trade alerts) that will be reporting results are highlighted in BOLD. An asterisk (*) is placed next to stocks that are showing excellent relative strength heading into their respective earnings report. In my judgment, I'd expect strong results and guidance, although correctly predicting which way a stock might gap after an earnings report is much more difficult. If you decide to hold a stock into earnings, please understand the significant short-term risk that you are taking. Please be sure to check for earnings dates for any companies you own or are considering owning:
Friday, March 6:
None
Monday, March 9:
FNV*. Others less than $10 bil: MTN, THO*, SFIX
Economic Reports
February nonfarm payrolls: 273,000 (actual) vs. 177,000 (estimate)
February private payrolls: 228,000 (actual) vs. 155,000 (estimate)
February unemployment rate: 3.5% (actual) vs. 3.6% (estimate)
February average hourly earnings: +0.3% (actual) vs. +0.3% (estimate)
January wholesale trade: -0.4% (actual) vs. -0.3% (estimate)
Happy trading!
Tom