
EB Daily Market Report - Tuesday, March 10, 2020
Executive Market Summary
- Futures were very strong this morning with the Dow Jones rising as much as 945 points earlier this morning
- Selling kicked in, however, and the Dow Jones temporarily went red; it's now up roughly 100 points
- Needless to say, Volatility ($VIX) has been crazy as you'd expect with a VIX in the 50s
- Sentiment is turning very bearish in the options world as the $CPCE shows in a chart below
- Crude oil ($WTIC) is bouncing after its worst day since 1991; crude is higher by 5.6%
- Treasuries are under pressure, with the 10 year treasury yield ($TNX) up 11 basis points to .61%
- Technology (XLK, +2.31%), consumer discretionary (XLY, +1.70%), and financials (XLF, +1.27%) are leading equities higher; in fact, all 5 aggressive sectors are in the Top 5 sectors today - a bullish development
- We have no active trade alerts at this time
Market Outlook
The market is being driven in the near-term by extreme fear and it may continue to feed off of that. However, extreme pessimism also historically has marked very significant bottoms. I believe we're at or rapidly approaching one of those bottoms right now. I've discussed the high Volatility ($VIX) readings, so let's today look at where we stand in terms of the equity only put call ratio ($CPCE). I like to smooth out the daily readings by using an "invisible" chart style with a 5 day SMA. Here's how we look now vs. what has marked key S&P 500 bottoms in the past:
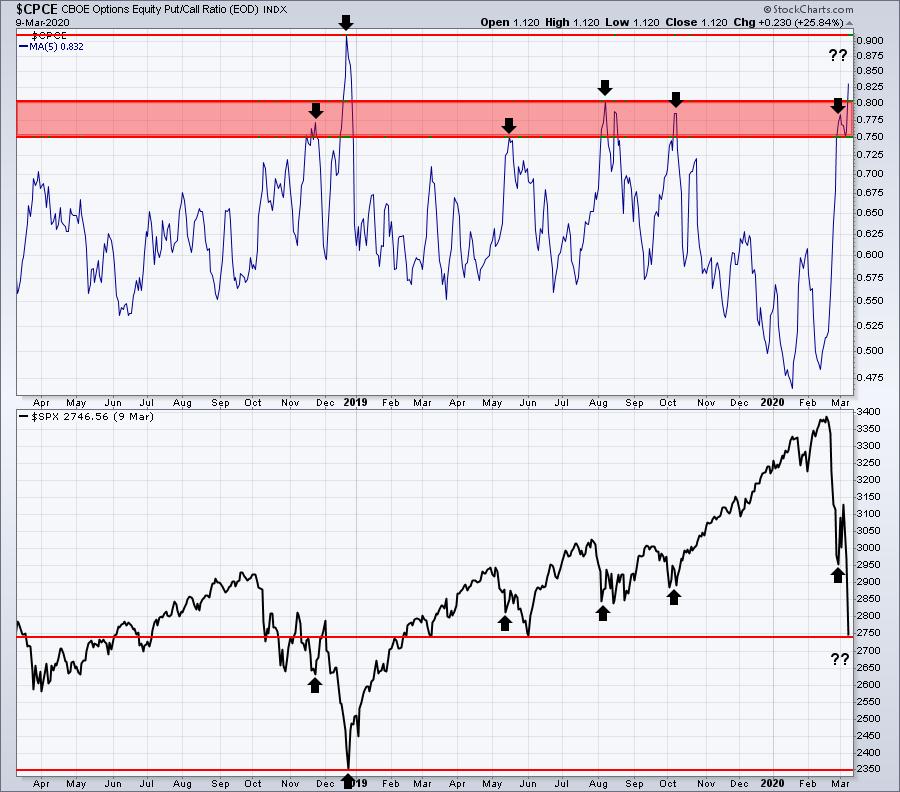
Puts are used by traders primarily to benefit from lower prices ahead, so those buying puts are bearish. Calls are used by traders primarily to benefit from higher prices ahead, so those buying calls are bearish. Options are used many times (not always) by very speculative traders and when the masses tend to favor buying calls much more than normal, the 5 day SMA of the CPCE falls to very low readings and can mark significant short-term market tops because of the "too bullish" sentiment. The opposite is true when we begin to see CPCE 5 day SMA readings that rise to extreme levels. That "too bearish" sentiment can lead to significant market bottoms. The recent bearishness has taken us to an area of extreme bearishness where a significant bottom could form at any time. Maybe it was yesterday. Maybe it's today. Maybe it's later this week. But I'm beginning to expect a very big rally soon. When I say "big", I wouldn't be surprised to see the S&P 500 rise back above 3000 quickly.
We got off to a great start earlier this morning, gave back those gains and are now trying to rally again. The problem is that, with a VIX in the 50s, there's no telling where we might be at 4pm EST or where we might open tomorrow morning. So if you decide to take long positions, just be prepared for the potential of whipsaw action. It's completely normal with VIX readings in the 50s.
Sector/Industry Focus
Biotechs ($DJUSBT) are struggling today and are underperforming the broader market for the first time in the past 2 1/2 weeks. Here's the visual:
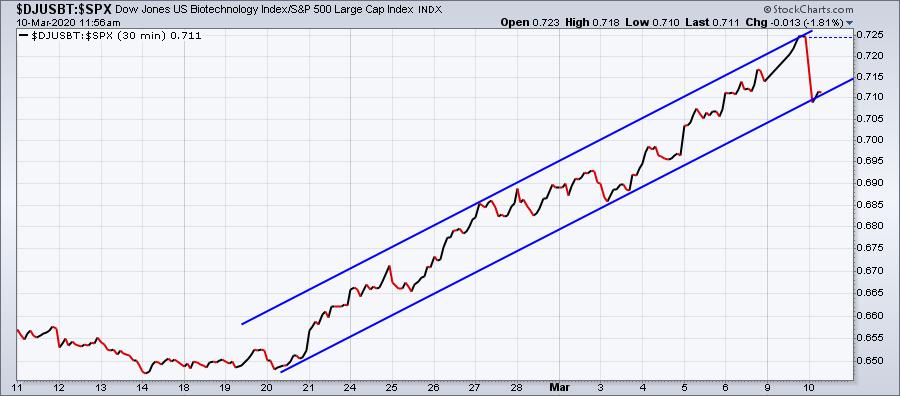
A period of relative consolidation wouldn't be a bad thing for this group after a very strong relative period. Another group that's been showing nice relative strength has been broadline retail ($DJUSRB). Here's the same chart for this group:
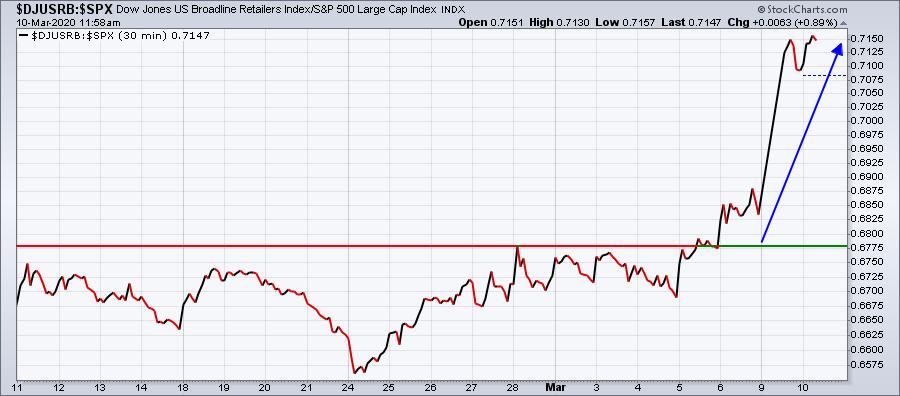
After relative consolidation for three weeks, it's not difficult to see who's been a relative winner over the last week. Broadline retail.
Active Trade Alerts
We have no active trade alerts at this time. I don't anticipate adding any active trade alerts in the very near-term as trading in a high VIX environment can result in very swift, violent selloffs, triggering stops and leading to whipsaw action.
Strong Earnings ChartList (SECL)
I ran a scan to see which stocks on the SECL are trading volume today at 11:20am that exceeds 50% of its 2 week daily average. Volumes have been very high of late, so any stock today trading 50% of its two week average by 11am is a stock we might want to look at. Here's the scan that I ran:
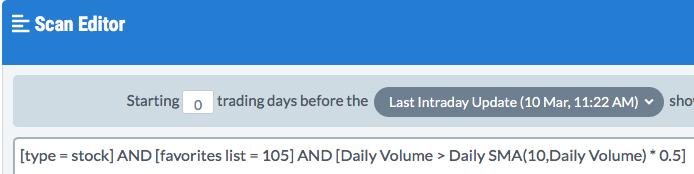
....and here were the results of the scan, in SCTR order:
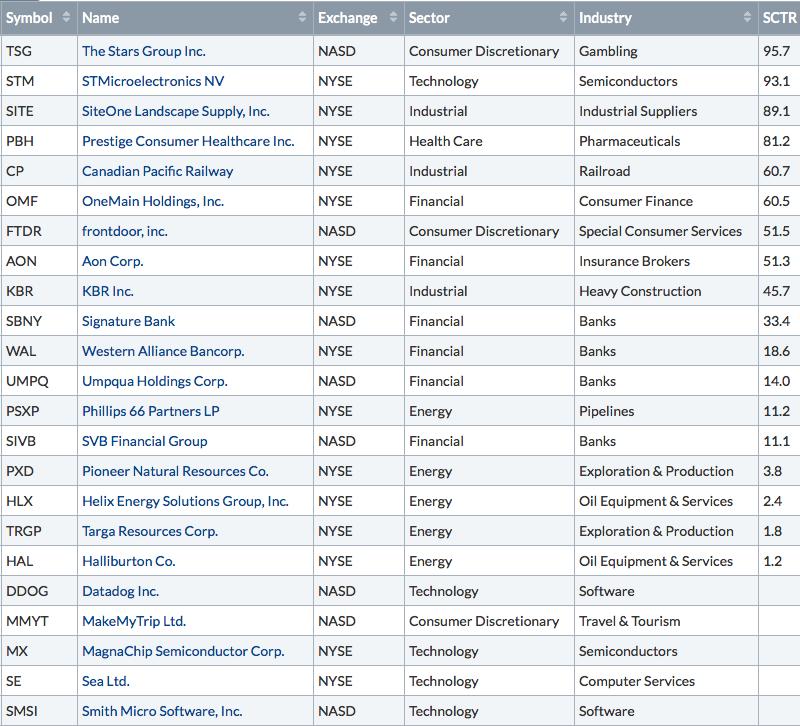
The volatility is still keeping me fairly quiet on the trading front, especially with individual stocks. But if I were to try to find stocks for a rebound, I'd want stocks that have been hit, but have maintained their relative strength. In that regard, here's one off the list above to consider in the beaten-down banking space ($DJUSBK):
SBNY:
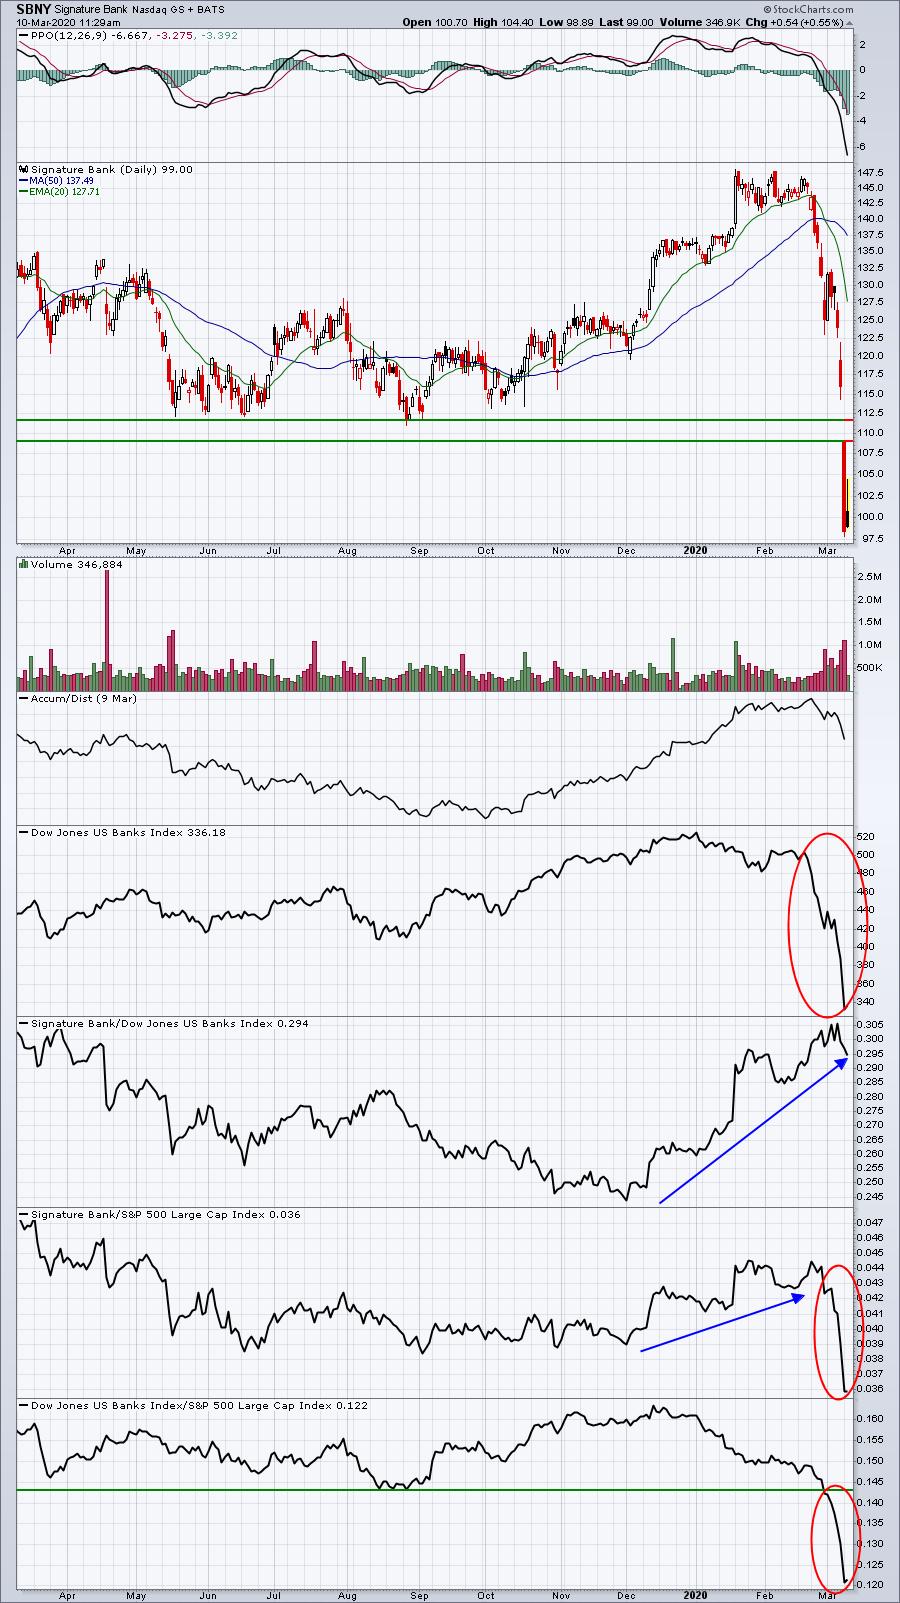
Banks have been horrible in March and the entire group is moving lower, even the best relative performers like SBNY. Should we begin to see a rebound in banking shares, which we will at some point soon, I'd expect SBNY to get more than its fair share of the rebound, perhaps moving back up to test overhead price and gap resistance in the 109-112 area.
Movers & Shakers
The S&P 500 leaderboard is littered with stocks that are completely broken. They're seeing oversold bounces, but many of these stocks will likely struggle to outperform the S&P 500. Here is one example, followed by a stock whose short-term selling might provide quite an opportunity:
LNC:
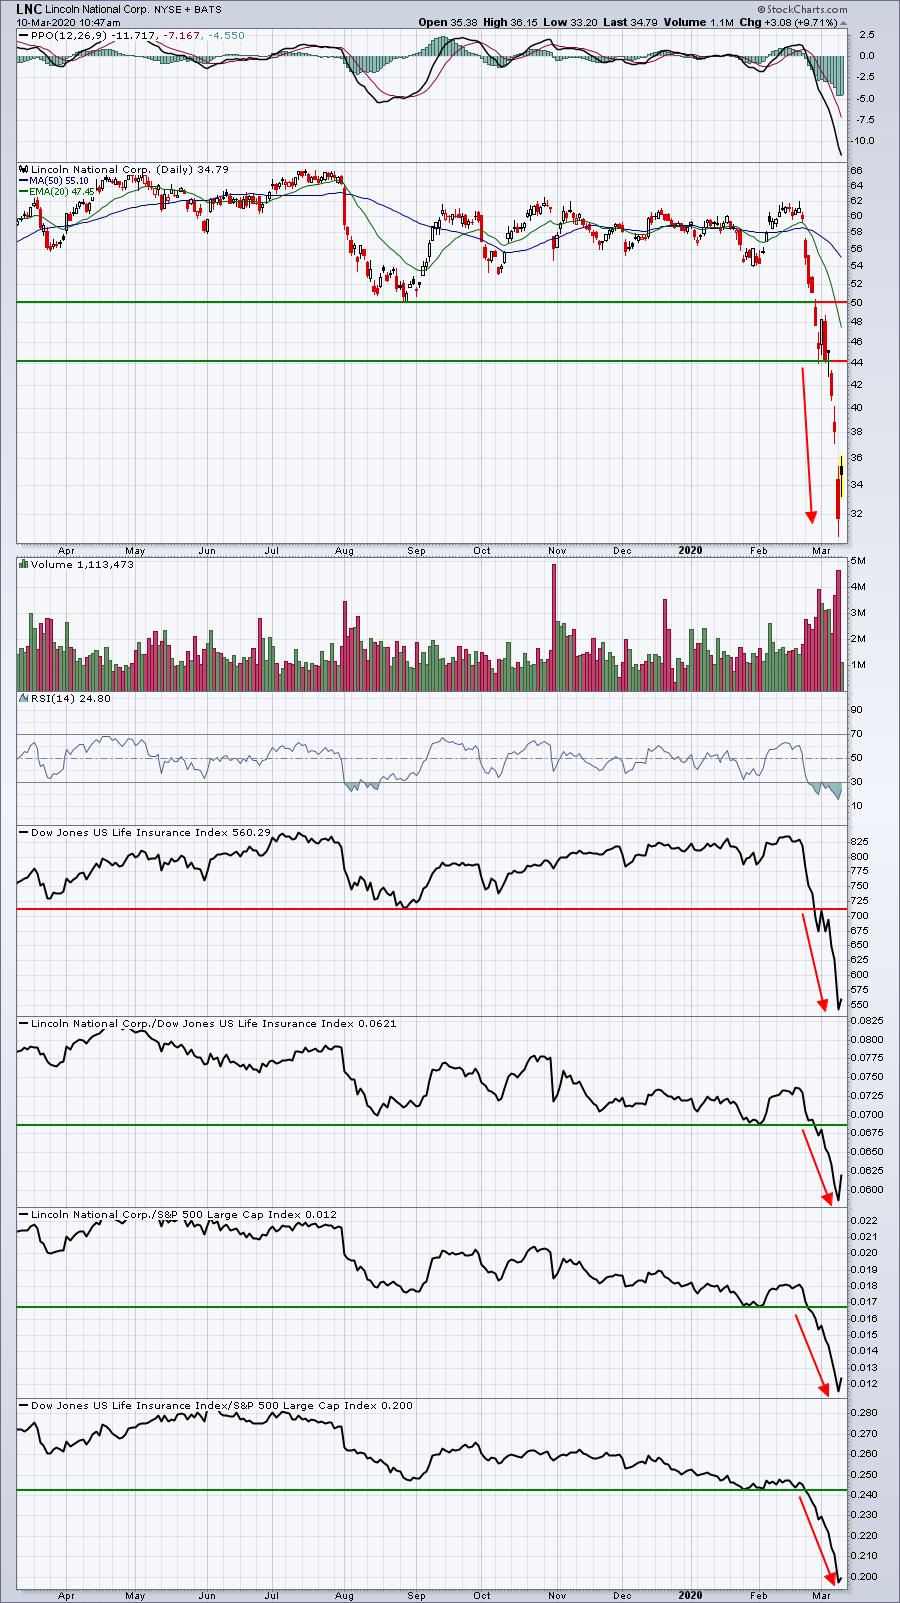
There's really nothing encouraging about this chart. LNC is a very weak stock in a badly-underperforming industry group. Yes, it's oversold and due for a bounce. But after that initial bounce, I can't see leadership coming from a stock like this.
TDG:
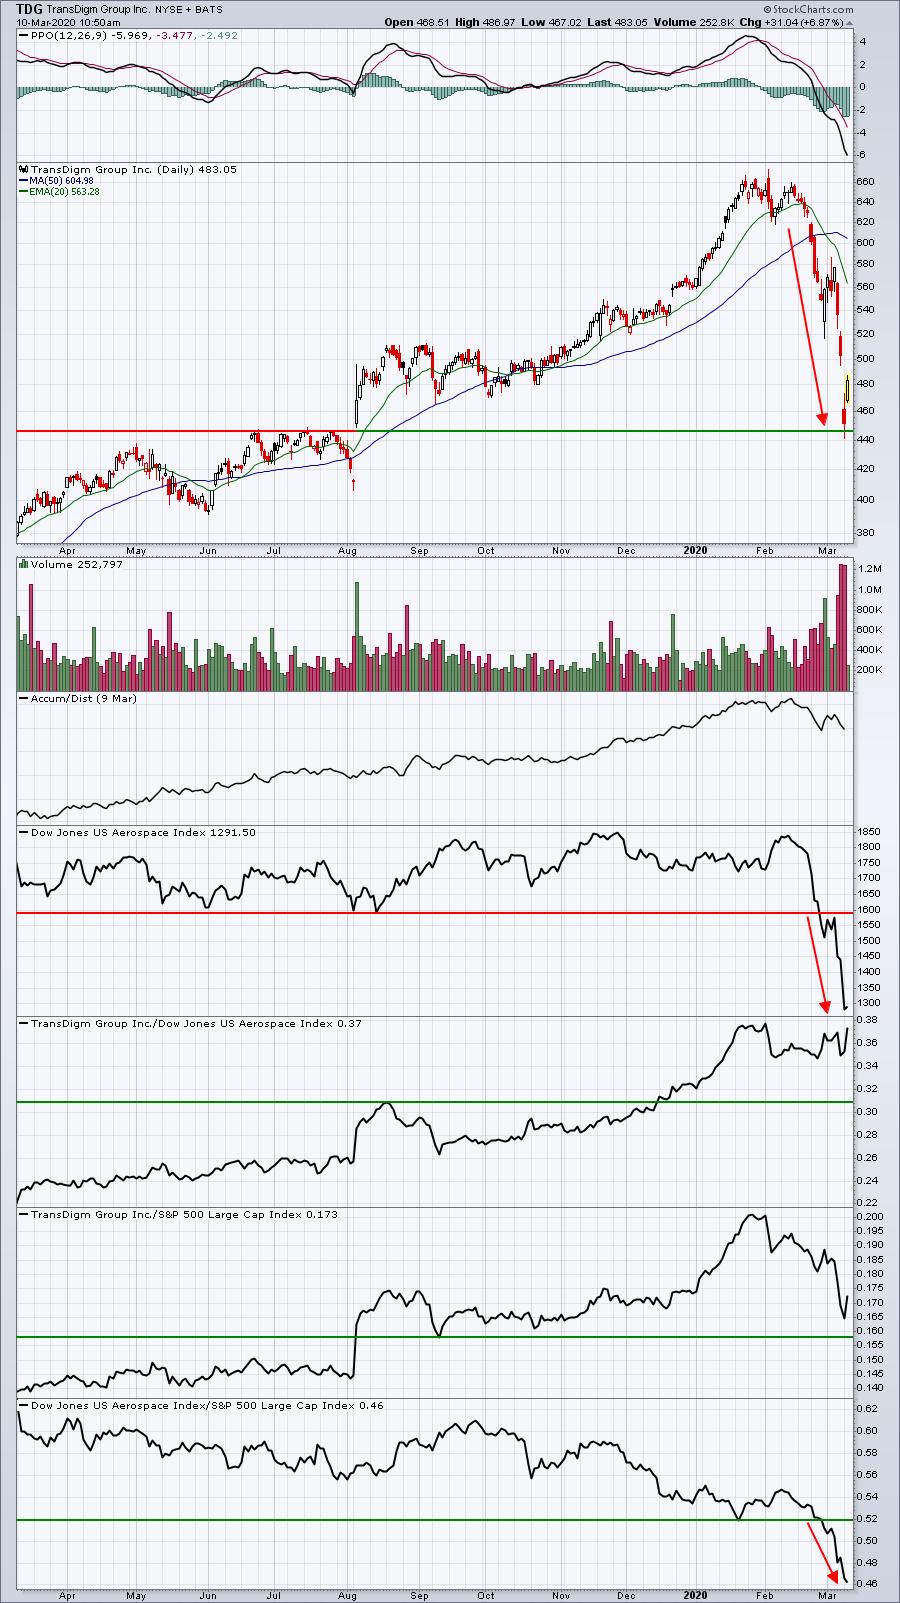
I added the Accumulation/Distribution indicator to show that it really hasn't weakened much, despite the huge drop. Aerospace ($DJUSAS) has been an awful area of the market, which has weighed on TDG, but it's clearly still an outperformer. From an absolute price perspective, TDG revisited a key area of price and gap support and is reversing. I could see TDG outperforming the S&P 500 from here - a completely different look and feel of its chart vs. LNC.
Earnings Reports
Here are the key earnings reports for this week, featuring stocks with market caps of more than $10 billion. I also include a few select companies with market caps below $10 billion. Finally, any portfolio stocks (or active trade alerts) that will be reporting results are highlighted in BOLD. An asterisk (*) is placed next to stocks that are showing excellent relative strength heading into their respective earnings report. In my judgment, I'd expect strong results and guidance, although correctly predicting which way a stock might gap after an earnings report is much more difficult. If you decide to hold a stock into earnings, please understand the significant short-term risk that you are taking. Please be sure to check for earnings dates for any companies you own or are considering owning:
Tuesday, March 10:
None. Others less than $10 bil: REYN, PSN, DKS, CLDR, KFY
Wednesday, March 11:
PDD*, WPM*. Others less than $10 bil: SMTC
Thursday, March 12:
ADBE*, ORCL, AVGO, DG*, DOCU*, ULTA, WORK, AZUL. Others less than $10 bil: WUBA, GPS, AXSM, MDLA, BEST, INO, ZEAL, ZUO, RDNT
Friday, March 13:
None. Others less than $10 bil: BKE
Economic Reports
None
Happy trading!
Tom