
EB Daily Market Report - Thursday, March 12, 2020
Executive Market Summary
- Futures were lock limit down again today, but literally since I wrote everything below, we're seeing a major rally
- The Dow Jones is down less than 1000 points after being lower by more than 2200 earlier
- The Federal Reserve has announced new funding actions to combat the coronavirus crisis
- Health care (XLV, -2.70%), technology (XLK, -2.71%), and real estate (XLRE, -2.73%) are recovering fastest
- The 10 year treasury yield ($TNX) is down 9 basis points, but well off its earlier low
- Crude oil ($WTIC) is down another 4.5% today
- We have no active trade alerts at this time
Market Outlook
Technical analysis doesn't work very well in market environments like the one we have right now as fear trumps all aspects of technical analysis. Very few professionals are looking at price support and jumping in. We'll have a sense of a short-term bottom when we see a big afternoon reversal because that will give us a sense that market makers have built long positions. Until then, the downtrend and rising fear (VIX) continues on.
I've shown Fibonacci retracement levels as potential targets and resistance levels during rallies. One chart to keep an eye on is the S&P 500, marking potential areas where the S&P 500 could rebound once a new bottom is formed. For instance, if we assume today's low is THE short-term low as we move forward, then we would be able to mark a key zone to watch on any bounce as follows:
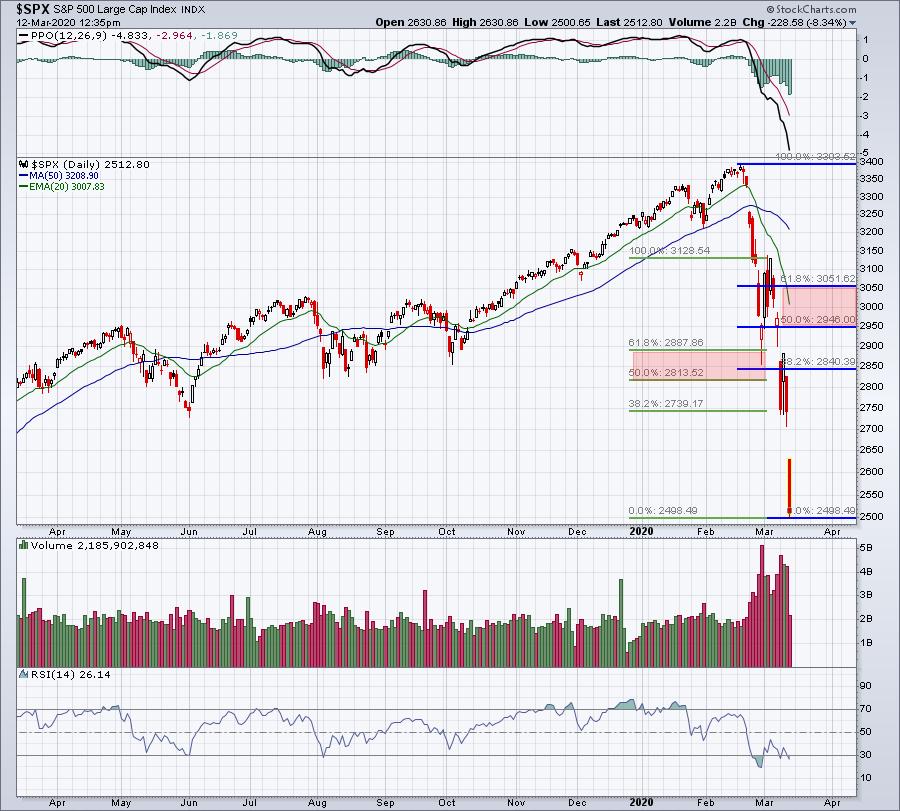
I've annotated two different Fibonacci retracements. The first (blue lines) is from the original high a few weeks back, down to today's low. That would suggest a potential rebound to the 2946-3051 area, which represents that 50.0%-61.8% zone. The second (green lines) starts from the initial rebound high and starts a separate Fibonacci retracement calculation. That calculation shows a possible rebound to 2813-2887.
These are just estimates but gives us something to work with if see an afternoon reversal today or soon. If another new low prints, we'd need to redraw these lines to the new low, meaning that the retracement bounces would be lower as well.
Sector/Industry Focus
Another chart that could be useful is the XLK, the ETF that tracks the strongest sector - technology. The following is an hourly chart that reflects the current downtrend channel. We appear to be getting very close to the lower downtrend line, where a bounce could occur:
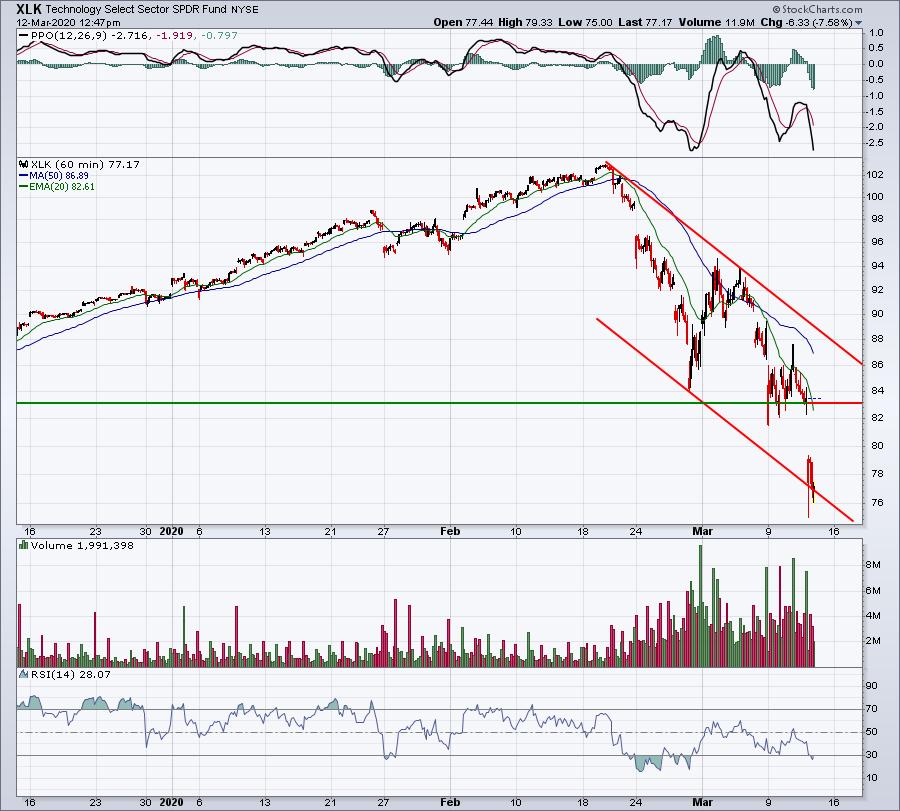
If we connect the high from a few weeks ago and the initial rebound high, we establish an upper downtrend line. I dragged that same sloped line to the initial low hit in late-February and it lines up very close to where we stand right now, with a slight break of this lower channel support line in early action today.
My strategy has not changed. Yes, it's scary right now. It always is after a major selloff like this. I am trying to take a very disciplined approach to averaging in to mostly ETFs, with a few relatively strong large cap names as well. I am not fully invested, but I've moved from 0% a couple days ago to probably 75% or so based upon the extreme fear readings on both the Volatility Index ($VIX) and the equity only put call ratio ($CPCE). For now, I'm holding off on the other 25%. These extreme sentiment readings historically mark bottoms and I'm fairly confident they will again. But how much further do we drop before these readings top? That's a very difficult question to answer. I'm not trying to time the exact bottom, simply hoping to take advantage of an irrational drop.
Active Trade Alerts
We have no active trade alerts at this time. I don't anticipate adding any active trade alerts in the very near-term as trading in a high VIX environment can result in very swift, violent selloffs, triggering stops and leading to whipsaw action.
Strong Earnings ChartList (SECL)
I looked through many of the charts on the SECL, looking for potential trades where the reward to risk would be strong if a potential turnaround came. The key for me would be having a possible reversal off key price support. If it moved below today's intraday low, I'd exit. Of course, the biggest risk would be holding into the close and waking up to another 7% down day. There's simply no way to avoid that risk. Options could help to mitigate it a bit, using the high VIX to your advantage by selling expensive calls against your position (covered call strategy).
Anyhow, here are a few charts:
LEN:
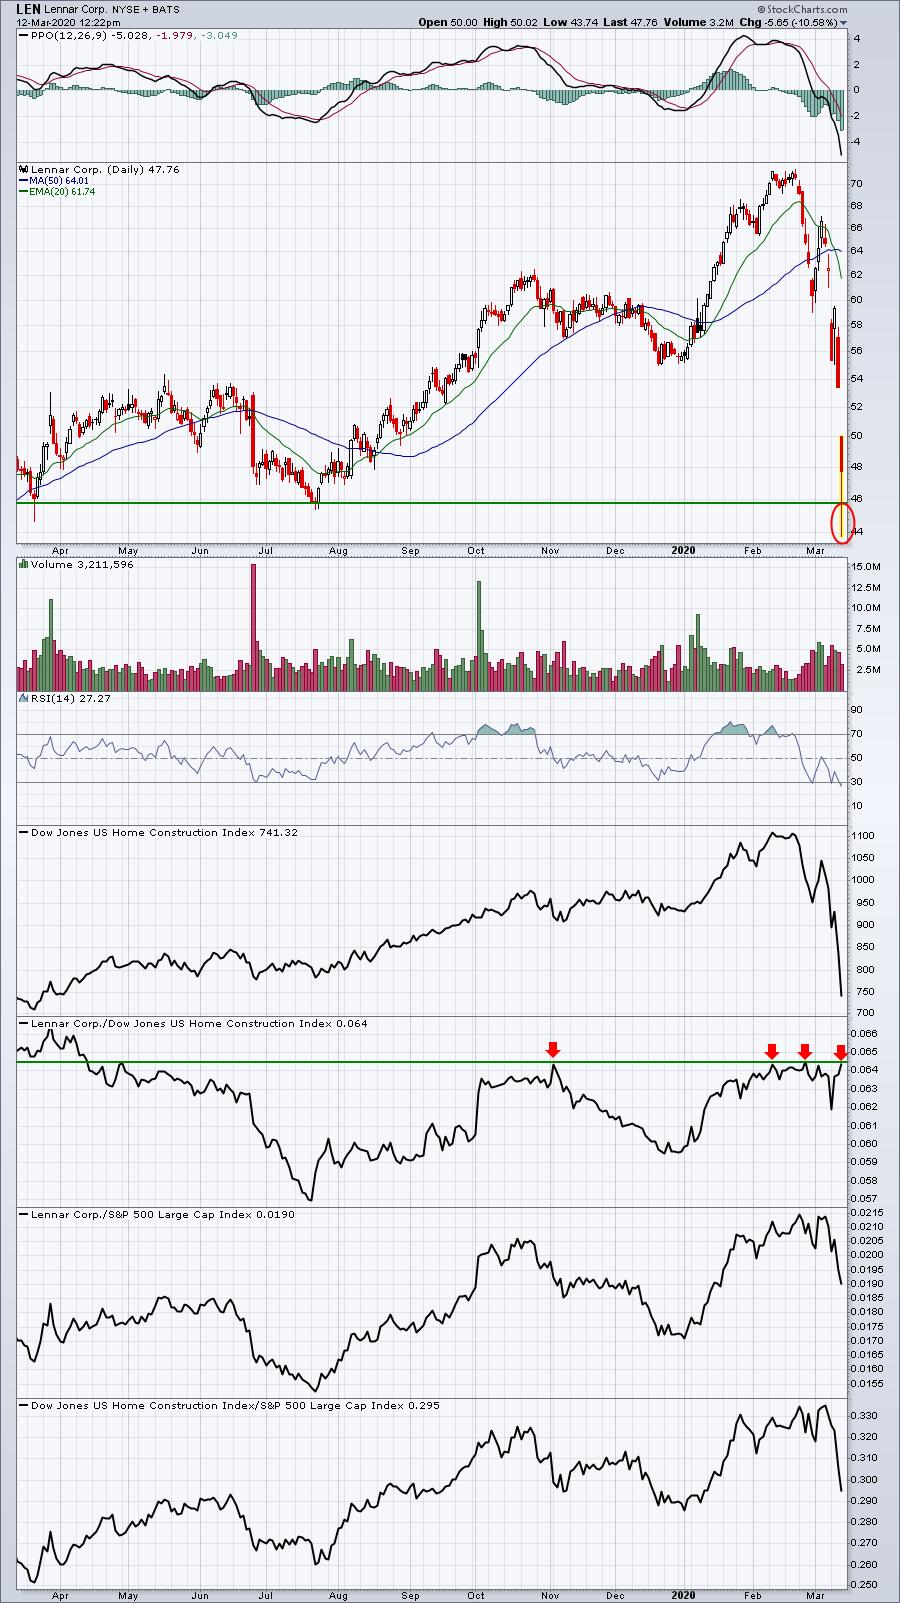
LEN traded below key price support and is now back above it. We don't know where it might close, but for now it's holding onto key price support. LEN's relative strength vs. its homebuilding peers is strong, but again the big risk remains holding overnight.
BLK:
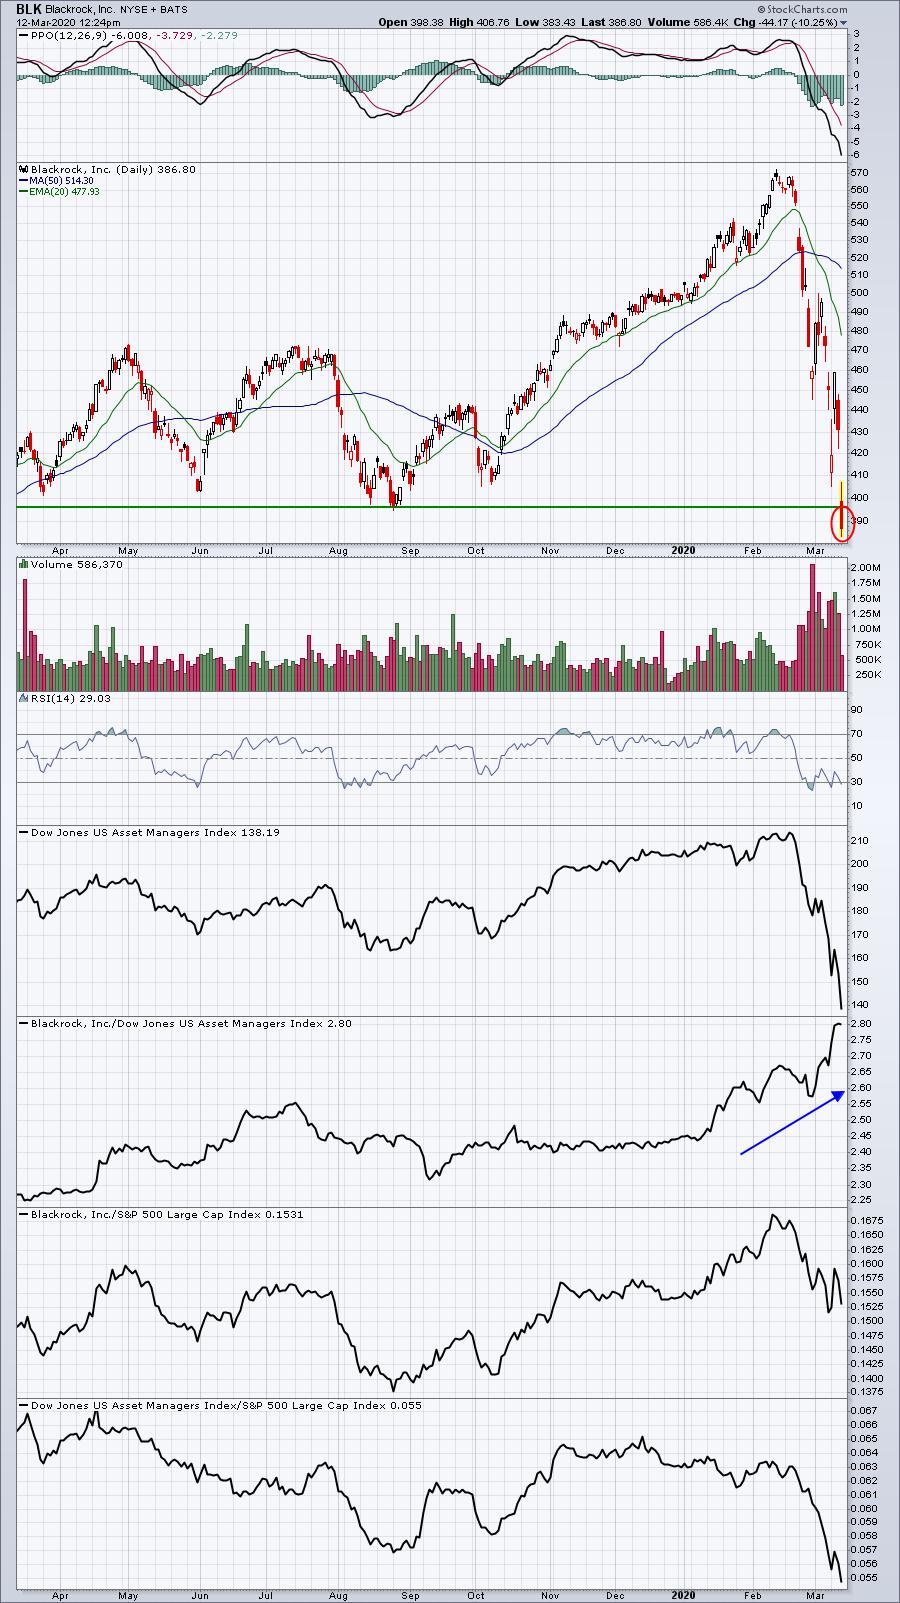
We're seeing a breakdown intraday on BLK, but its relative strength among asset managers is very strong. A close above key support could signal a bottom. But once again, what happens at tomorrow's opening bell? That's the big risk.
STT:
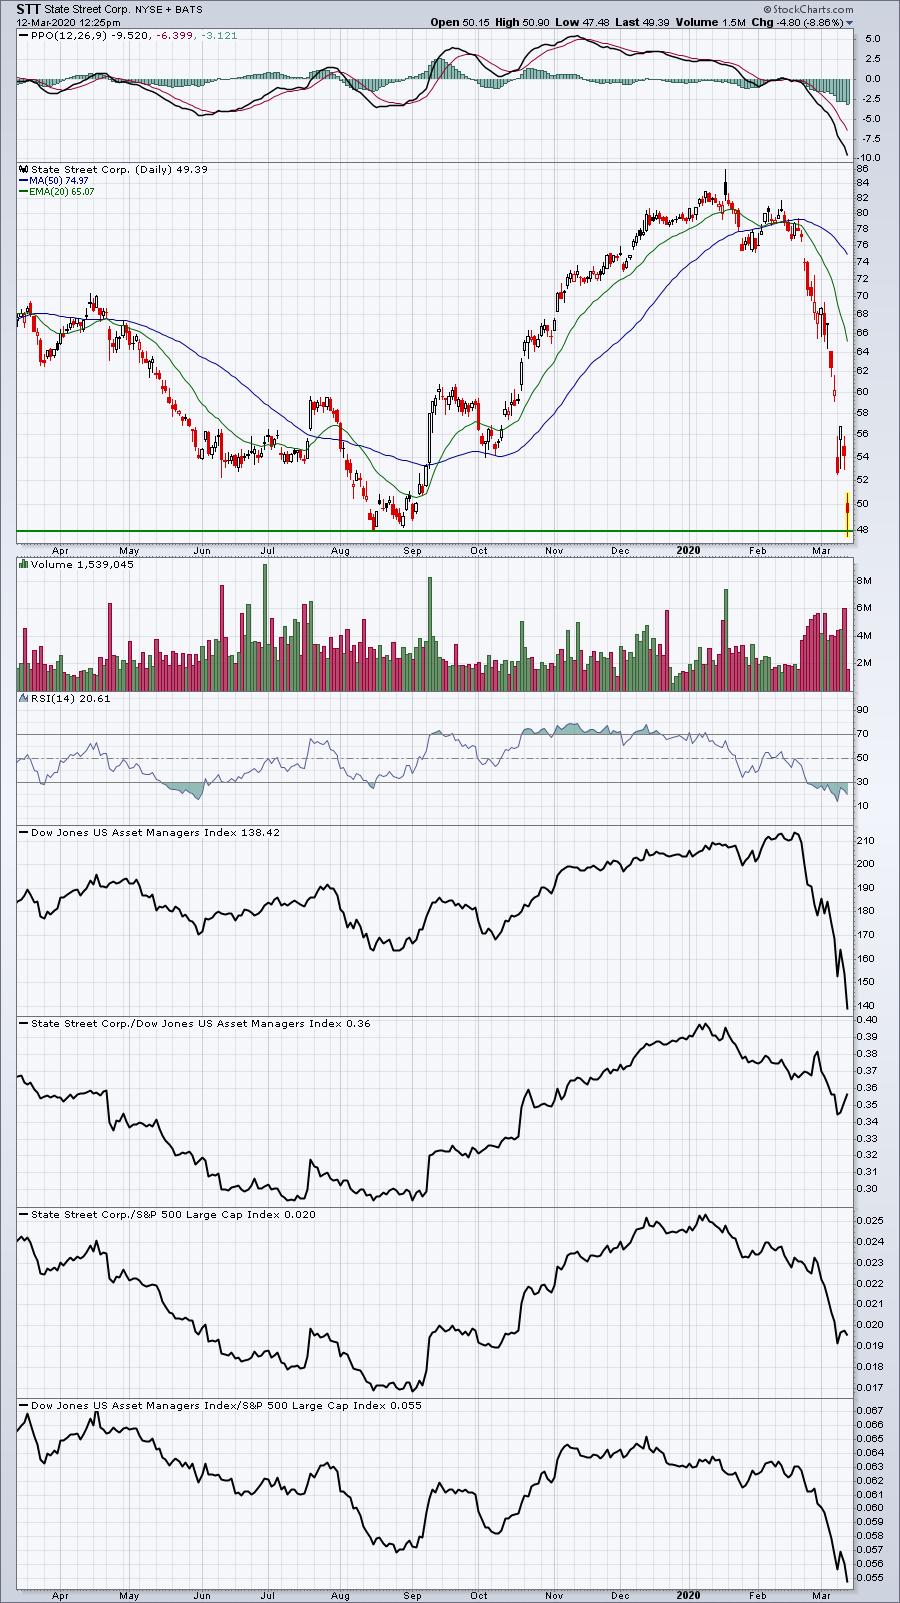
It's been a HUGE slide from 86 to 48 and, unlike BLK, STT has not been a recent outperformer among asset managers. But.....it is trying to reverse at key price support just like STT.
For all of these potential trades, you have to be willing to hold overnight and that's clearly the biggest risk.
Movers & Shakers
The S&P 500 has only 1 component stock with a gain today (COG) and one of the NASDAQ's best performers appears to be breaking out of a downtrend that just tested price support (SDGR). Here's what their charts look like:
COG:
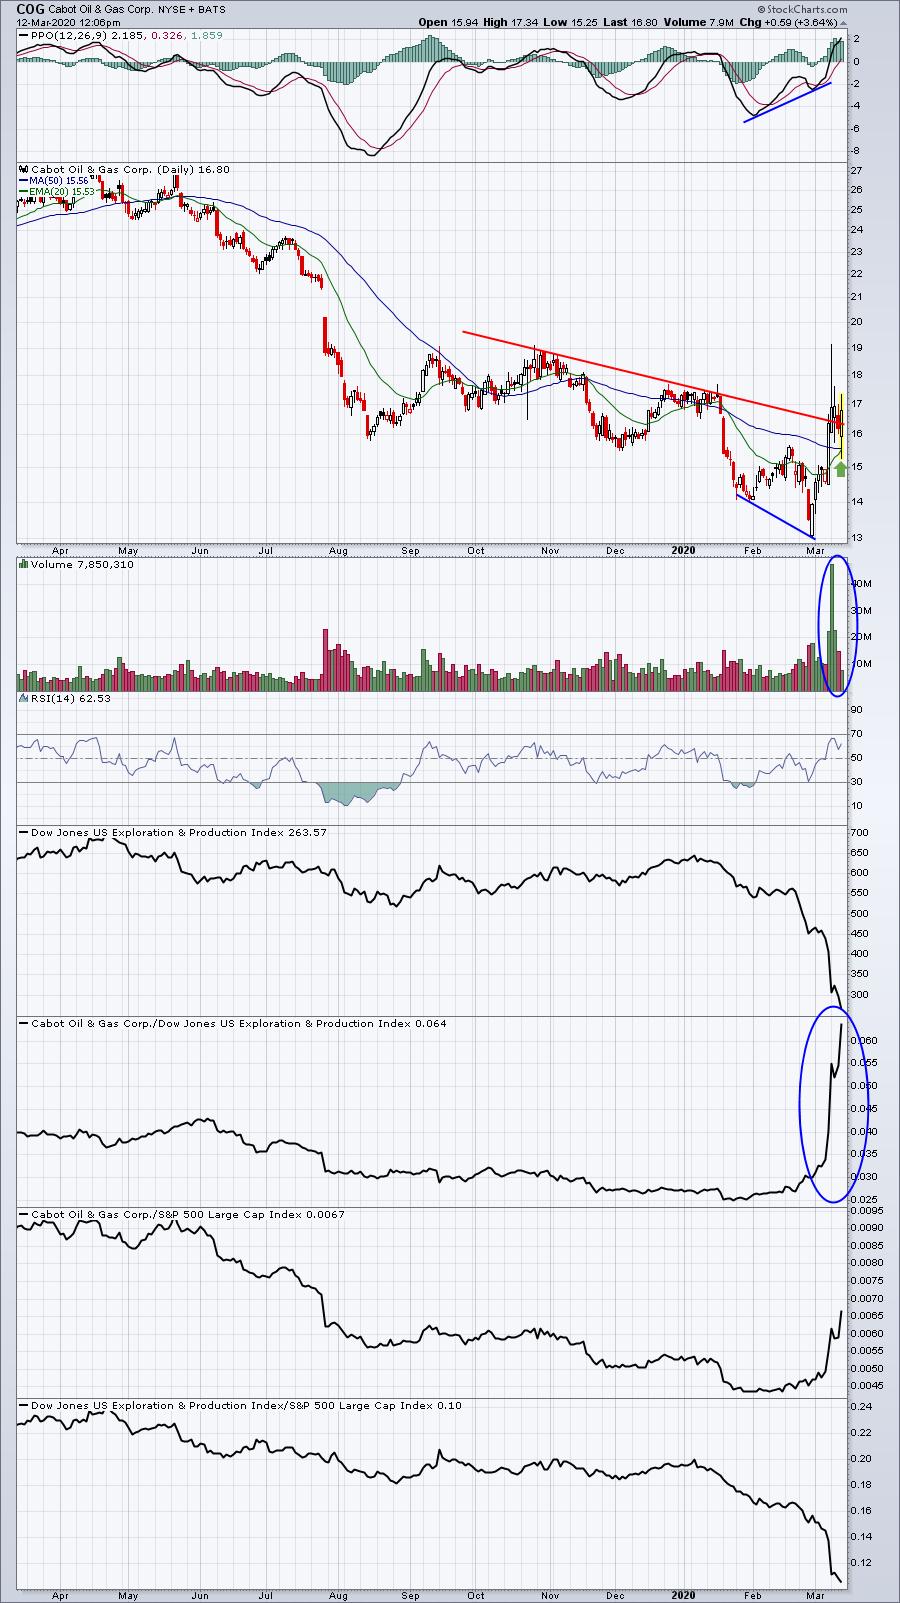
COG has been one of the best relative performers in the energy area, even before today's rise. It seems to be breaking a downtrend and, thus far, is holding key moving average support at the 20 day EMA.
SDGR:
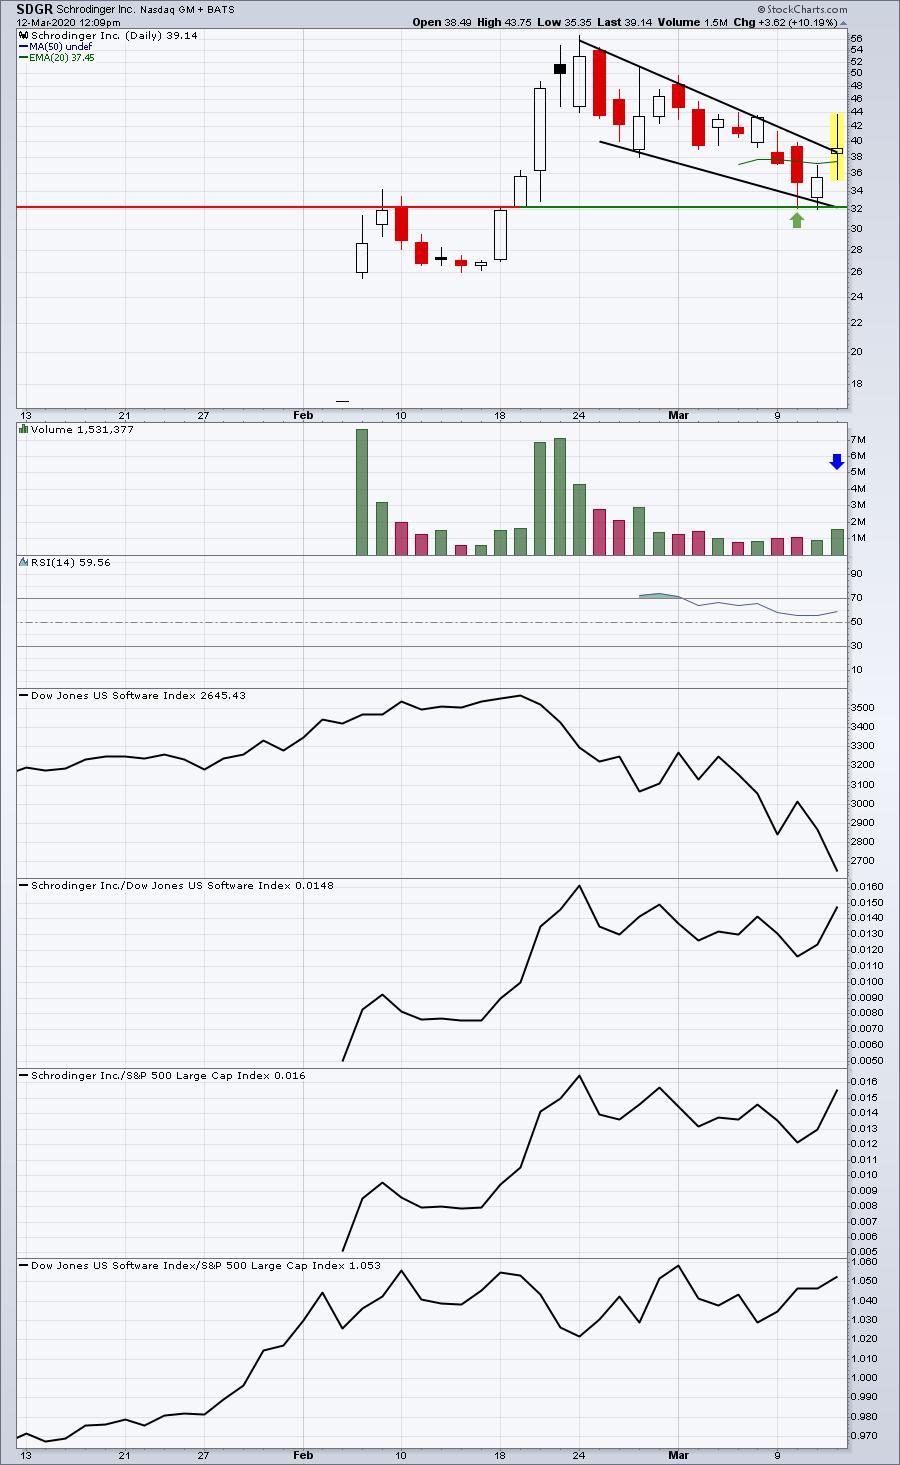
In a better trading environment, I'd be watching this one very closely for a confirmed breakout later today. Volume is expanding and SDGR has successfully tested key price support. But the uncertain volatile environment inspires false breakouts, so we need to continue to be very careful in trading individual stocks.
Earnings Reports
Here are the key earnings reports for this week, featuring stocks with market caps of more than $10 billion. I also include a few select companies with market caps below $10 billion. Finally, any portfolio stocks (or active trade alerts) that will be reporting results are highlighted in BOLD. An asterisk (*) is placed next to stocks that are showing excellent relative strength heading into their respective earnings report. In my judgment, I'd expect strong results and guidance, although correctly predicting which way a stock might gap after an earnings report is much more difficult. If you decide to hold a stock into earnings, please understand the significant short-term risk that you are taking. Please be sure to check for earnings dates for any companies you own or are considering owning:
Thursday, March 12:
ADBE*, ORCL, AVGO, DG*, DOCU*, ULTA, WORK, AZUL. Others less than $10 bil: WUBA, GPS, AXSM, MDLA, BEST, INO, ZEAL, ZUO, RDNT
Friday, March 13:
None. Others less than $10 bil: BKE
Economic Reports
Initial jobless claims: 211,000 (actual) vs. 216,000 (estimate)
February PPI: -0.6% (actual) vs. +0.0% (estimate)
February Core PPI: -0.3% (actual) vs. +0.2% (estimate)
Happy trading!
Tom