
EB Daily Market Report - Tuesday, March 17, 2020
Special Event
Tonight is "Max Pain" night. We'll have a webinar starting at 5pm EST (room will be open by 4:30pm at the latest) to discuss the role that options could play in trading over the next few days to a week. It should be very educational.
Here is the link to access the room. (REMEMBER: The room will not open until sometime after the market closes today)
Executive Market Summary
- Futures were volatile overnight, but we did open slightly higher this morning
- After very early selling took most of our indices into negative territory, we saw a significant bounce back to challenge Monday's intraday high
- Defensive sectors are currently leading the rally - not a great signal, while energy (XLE) is the only sector that's lower; crude oil ($WTIC) is down 1.57%
- The 10 year treasury yield ($TNX) is higher by 16 basis points to 0.89% - a bullish signal for equities
- Gold (GLD) is rallying today after a big reversal at price support on Monday
- The U.S. government wants to provide emergency funds to Americans "immediately"
- February retail sales and March housing market index both came in below expectations; expect much more disappointing economic reports in the weeks and months ahead - the stock market is pricing that in now
- We have no active trade alerts at this time
Market Outlook
U.S. stock indices are rising solidly today, potentially ending the huge decline over the past 3-4 weeks. I expect a rebound based on a few reasons. First, I'm expecting to continue to see a rollout of stimulus measures that will help provide a foundation for recovery in both sentiment and price action. Second, options expire this Friday and we KNOW what can happen into options expiration week. It would behoove market makers to commit capital and take prices higher - even if only for the very near-term. Finally, we're just incredibly oversold.
Given the huge recent drop on the S&P 500, and today's earlier double bottom (if it holds), I thought it might be time to look at potential Fibonacci retracement bounces:
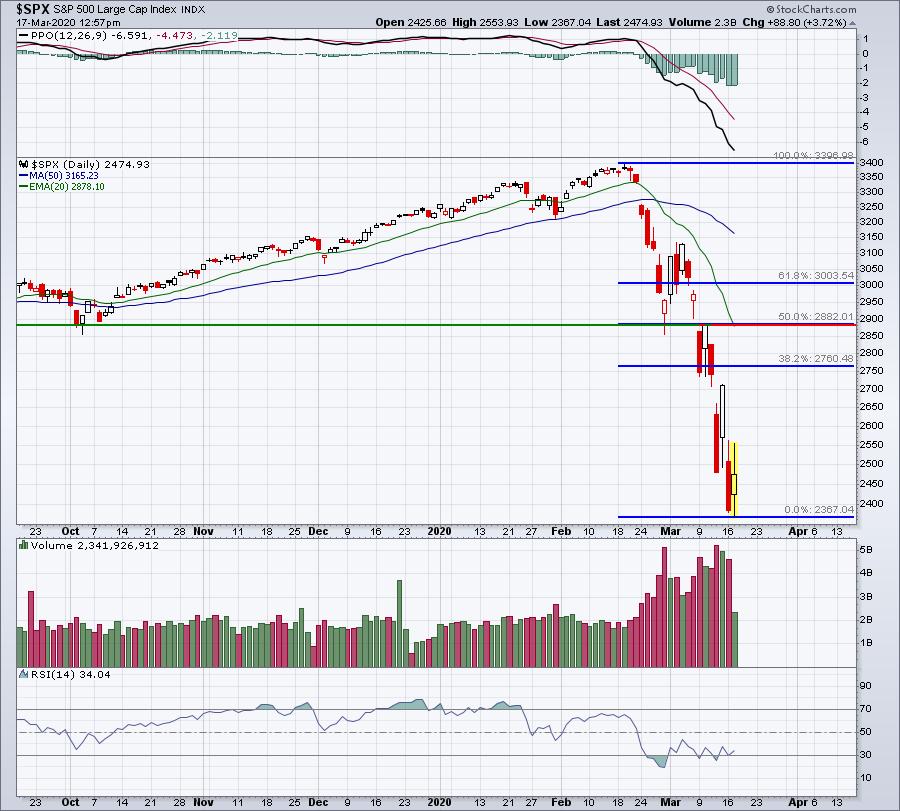
Price resistance would be closer to 2900 and there's a gap resistance at 2740 that wasn't filled. Those two levels also coincide with possible Fibonacci retracement levels. I'm not saying that we get there initially, but I'm throwing out the possibility, especially given that its option expiration week. I've seen crazier things in my lifetime. A lot of money is on the table for market makers to come get. We'll see if they do it in March like they did it in February. Remember, in February we had a TON of net in-the-money call premium that was wiped out. Now we have a TON of in-the-money put premium that a sudden rally could wipe out. We'll talk much more about this at 5pm EST in our webinar.
Sector/Industry Focus
I hesitate to discuss individual sectors or industries, because we've seen indiscriminate selling that has taken just about every part of our market lower this month. So instead, let's take a very quick look at two short-term price resistance levels where we could easily trade up to on the S&P 500:
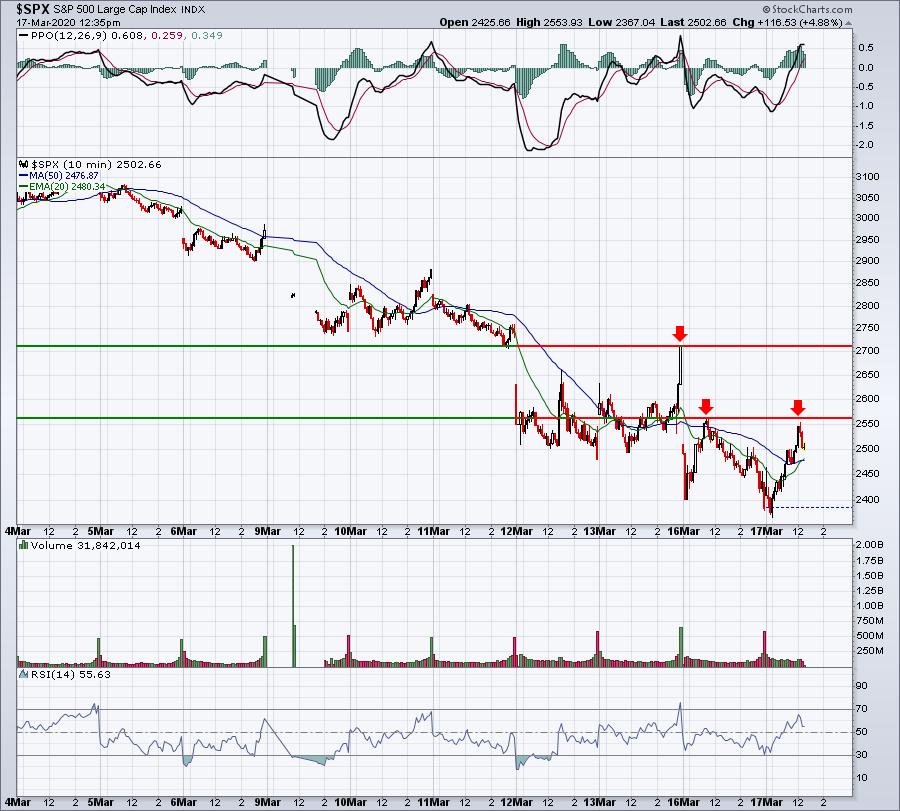
In the past two days, we've now seen two failures in the 2550-2560 area. A break above that level would likely encourage more trading on the long side. And although I didn't highlight it on the chart, check out the rising 20 period EMA clearing the 50 period SMA. We haven't seen that often and, when we have, it hasn't resulted in moving average tests that hold and lead to new highs. That'll be something to watch for on the very short-term chart. I wouldn't be particularly happy to see the 2470 lost on the S&P 500 this afternoon. That could lead to additional shorting into the close. It would be so much more bullish and encouraging to see a strong finish today.
Active Trade Alerts
We have no active trade alerts at this time. Yesterday, the VIX closed at 83, its highest close EVER. Trading remains very dangerous, although I would expect that we're very close to a bottom, if not at one, given the extremely high fear in the market currently.
Strong Earnings ChartList (SECL)
The dangers of trading anything in this market should be quite apparent by now. If you do trade individual stocks, nearly every stock has been beaten up pretty badly, so consider looking for those that are outperforming their peers. Also, you must understand that what you're seeing on a chart one hour may be completely different the next hour. If this type of volatility bothers you, then consider not trading....or at least consider trading only ETFs. These can be extremely volatile too, but at least this investment is a bit diversified among many stocks within an industry or among several different stocks within several different industries.
In terms of beaten-up stocks that still show relative leadership, here are examples of what I might look for:
JEF:
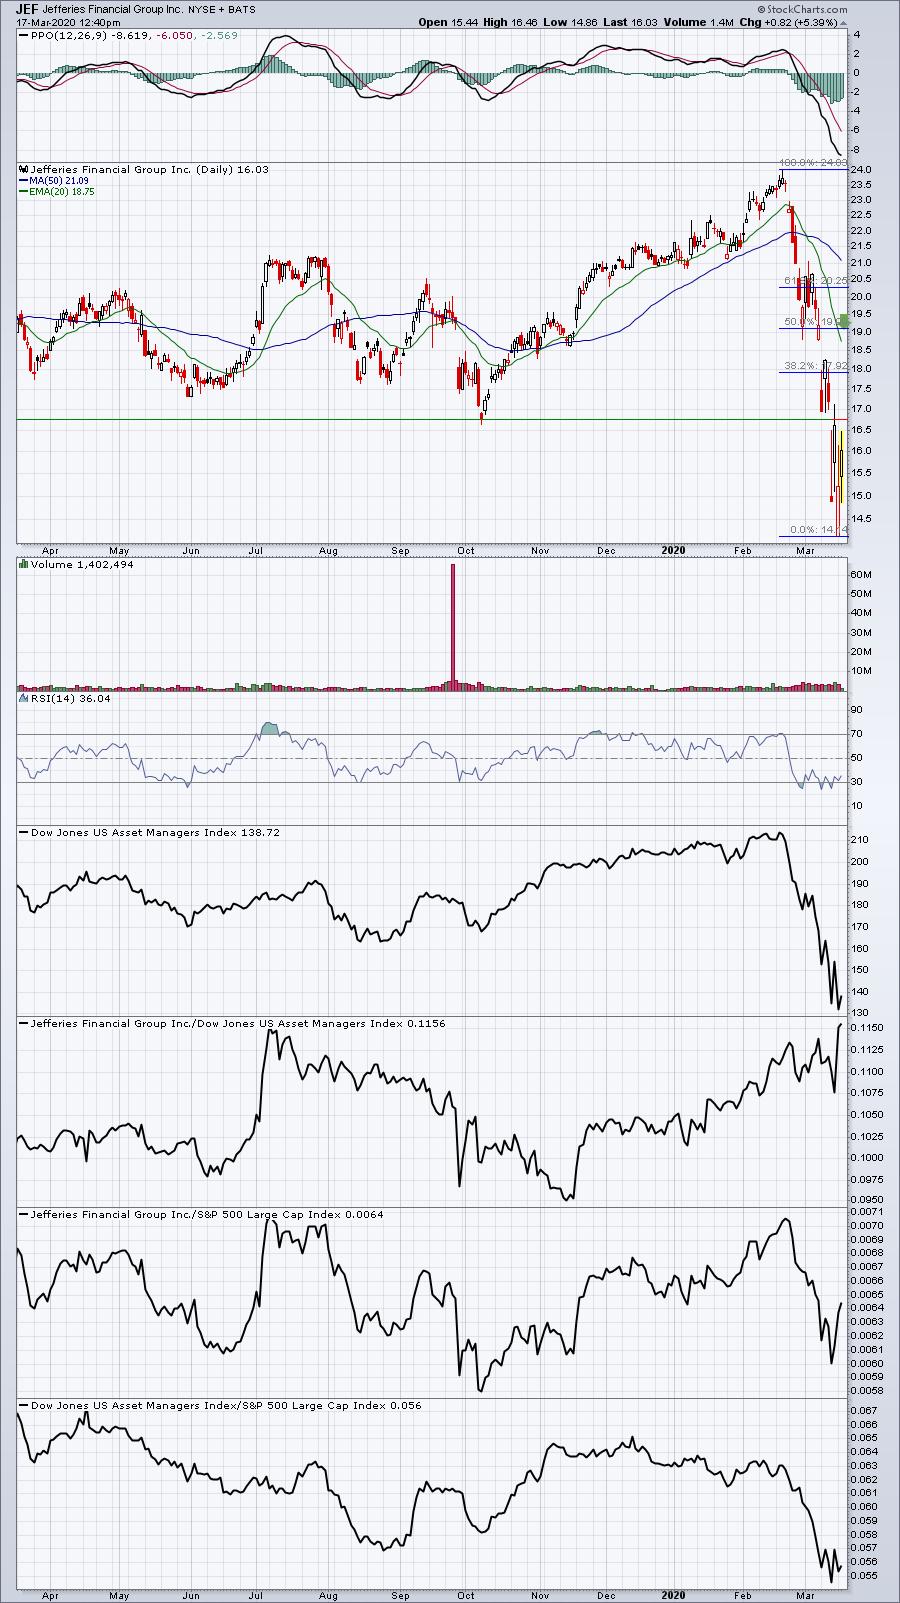
We have more room to the upside, but I'd definitely be thinking about trading for short-term profit only at this point. It's highly doubtful that we're going to see a recovery that goes straight back up in "V" bottom fashion. So you'll likely need to be quick on the trigger finger to capture profits.
Asset managers have been an awful group in March, but JEF has been one of the group's leading performers and would likely benefit from a bounce.
TDY:
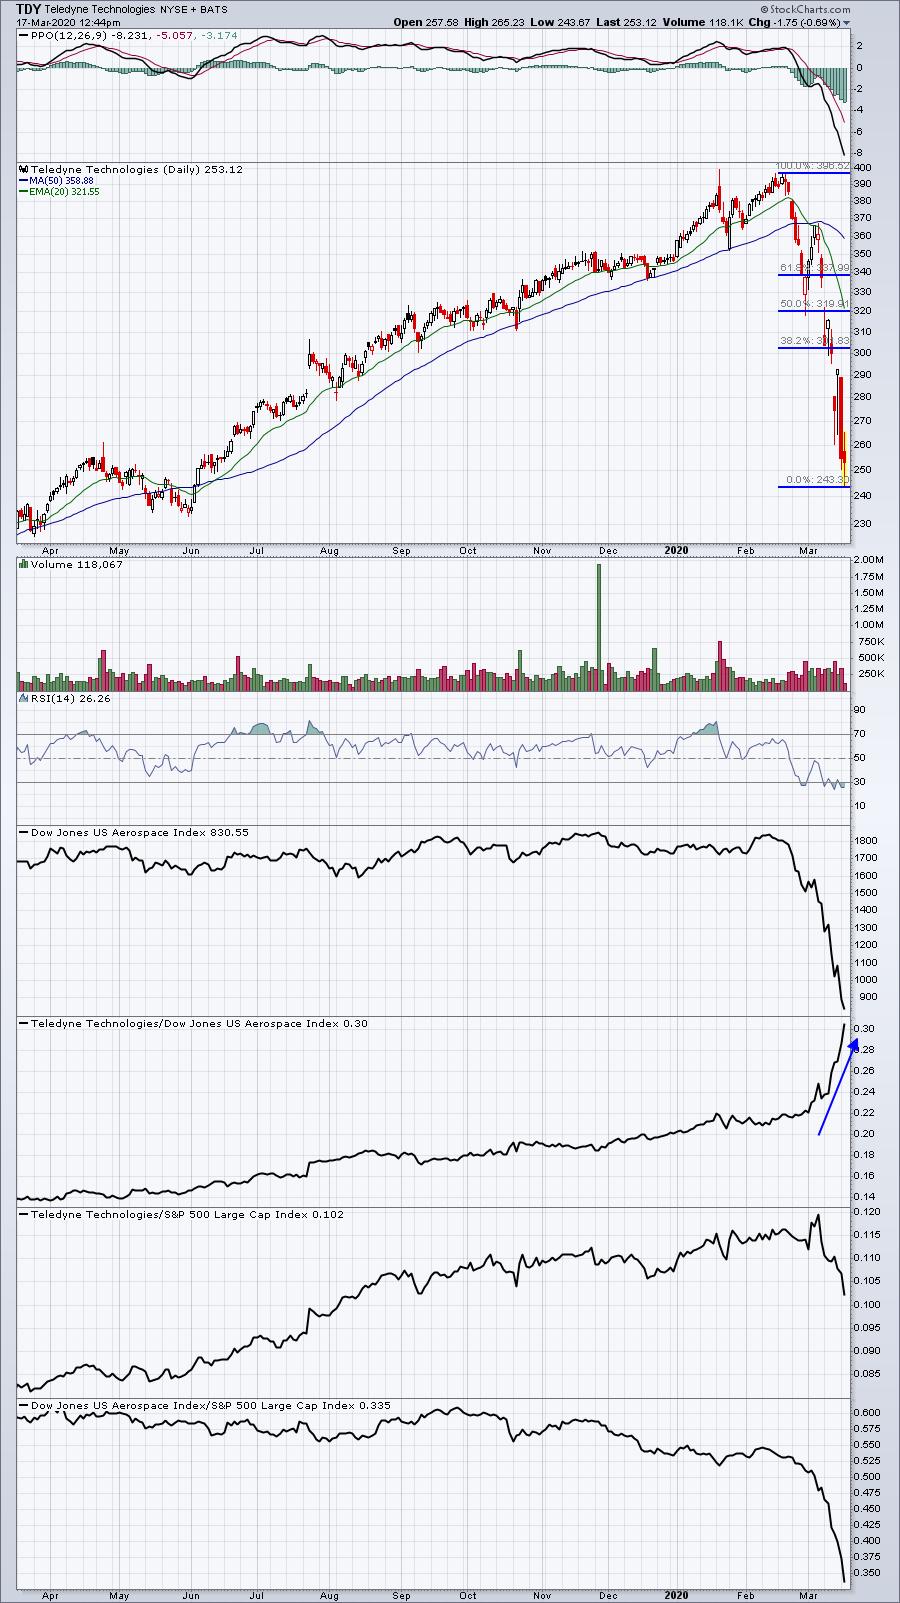
Aerospace has been a terrible industry group, losing more than 50% of its index value in just the past 5 weeks. Boeing (BA) has been mostly responsible for that drop, but if the group rebounds, TDY could claim more than its fair share given the steep outperformance of the group.
Movers & Shakers
Most of the top S&P 500 performers today are simply bouncing from very oversold levels. One notable exception, however, is Clorox (CLX), which is up 14% today to another all-time high. Check out CLX:
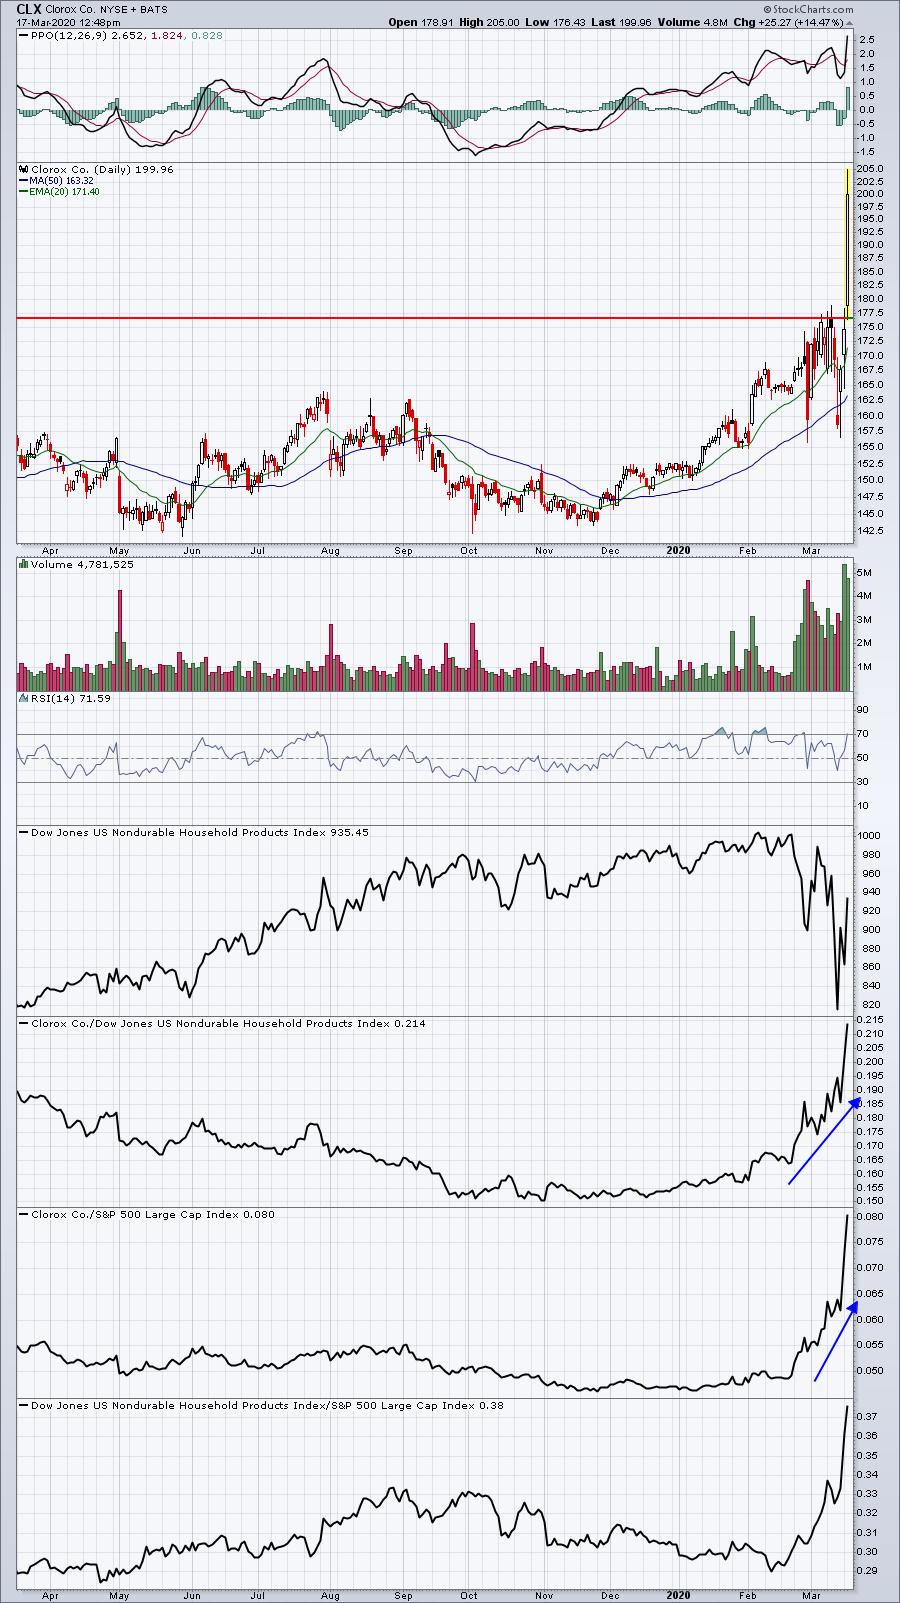
There have been actual winners in this market, but you've got to look hard to find them. CLX, because its products are in high demand, is surging as traders hoard the stock much like consumers are hoarding their products.
Earnings Reports
Here are the key earnings reports for this week, featuring stocks with market caps of more than $10 billion. I also include a few select companies with market caps below $10 billion. Finally, any portfolio stocks (or active trade alerts) that will be reporting results are highlighted in BOLD. An asterisk (*) is placed next to stocks that are showing excellent relative strength heading into their respective earnings report. In my judgment, I'd expect strong results and guidance, although correctly predicting which way a stock might gap after an earnings report is much more difficult. If you decide to hold a stock into earnings, please understand the significant short-term risk that you are taking. Please be sure to check for earnings dates for any companies you own or are considering owning:
Tuesday, March 17:
BAX, FDX, XP. Others less than $10 bil: MDB, BILI, HDS, SMAR
Wednesday, March 18:
GIS, TCOM. Others less than $10 bil: IAA, FIVE, WSM, NIO
Thursday, March 19:
ACN, CTAS, LEN. Others less than $10 bil: CRWD, DRI, GDS, MOMO, OLLI, CMC
Friday, March 20:
TIF
Economic Reports
February retail sales: -0.5% (actual) vs. +0.2% (estimate)
February retail sales less autos: -0.4% (actual) vs. +0.2% (estimate)
February industrial production: +0.6% (actual) vs. +0.4% (estimate)
February capacity utilization: 77.0% (actual) vs. 77.0% (estimate)
January business inventories: -0.1% (actual) vs. -0.1% (estimate)
March housing market index: 72 (actual) vs. 74 (estimate)
Happy trading!
Tom