
EB Daily Market Report - Wednesday, March 18, 2020
Website Update
Two things:
(1) We held a "Max Pain" webinar last night to discuss our major index ETFs and several large cap companies that typically have heavy options volume. We use Zoom technology and our recording has been "processing" ever since last night. We've contacted Zoom, but they are overwhelmed with support and sales issues, so we're not sure when we might hear back. In the meantime, our Trading Places LIVE show from this morning was recorded and processed fine. We apologize for not being able to post the recorded webinar, but it's literally out of our control. If the processing is finalized, we will immediately post it on our website under "Webinars".
(2) From that webinar yesterday, I added a new "Max Pain - March 2020" ChartList, which provides everyone a list of the companies that we covered last night. On those charts, there'll be a horizontal line marking "max pain" for every chart discussed. Keep in mind that those max pain numbers will likely move lower as more and more calls at lower prices are purchased over the next few days. Still, it would behoove market makers to drive prices higher - if they can. If there's too much selling, that task is much harder. While max pain guarantees us NOTHING, it's another indicator that suggests a very short-term move higher would benefit financial firms immensely. That's why I go through this max pain exercise. The link below provides the ChartList. In order to download the list, you'll need to be at least an Extra member at StockCharts.com (free 30-day trials are available at their website). If you're not a StockCharts.com Extra member or above, you can still view the charts one-by-one (there are 21 of them), but cannot save them. Here's the link and password to access these charts:
https://www.stockcharts.com/articles/sharedcharts.php?cc=1002951&listNum=47
Password: MarMax20
Executive Market Summary
- Futures were lock limit down once again and our major indices have been in negative territory all day
- The 7% circuit breaker was triggered just before 1pm EST and trading was halted for 15 minutes
- The Volatility Index ($VIX) moved above 85 intraday, nearing the all-time high reading of 89.53 on October 24, 2008
- Crude oil prices ($WTIC) are down a whopping 19% to $21.74 per barrel at last check
- The 10 year treasury yield ($TNX) is spiking 18 basis points to 1.18%, but there is no corresponding buying of equities - a negative signal
- Gold ($GOLD), ordinarily a safe haven during times of stress, is also lower by 2.14%; the U.S. Dollar (UUP) is up roughly 2%, adding to the woes of commodities
- Defensive sectors are leading on a relative basis, but all 11 sectors are lower
- We have no active trade alerts at this time
- Update: As I send this out (2:25pm EST), the S&P 500 is at session lows, down 9.7% and well beneath the 2018 low of approximately 2350
Market Outlook
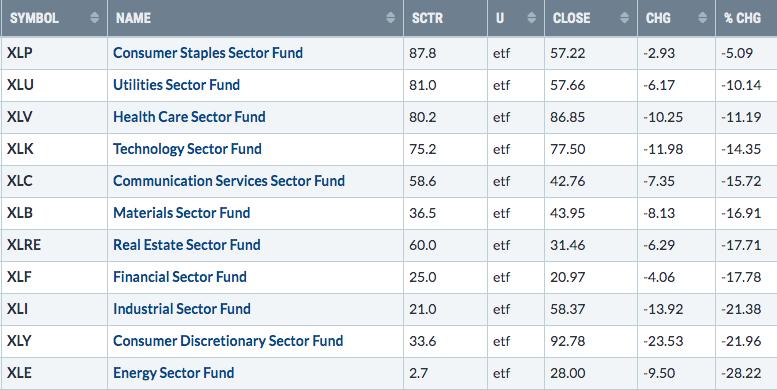
I've pointed out on several occasions recently that much of our selling continues to be at the opening bell and we saw it again this morning. Futures were down lock limit at 5% and that now seems to be the norm. Trading throughout the day, while volatile, has actually been roughly flat cumulatively over the past four weeks, which is almost inconceivable given the magnitude of the drop we've seen. If we look back over the past week and the past month, you'll see what has generally been the best areas to trade (from a long perspective):
Last week:
Last month:
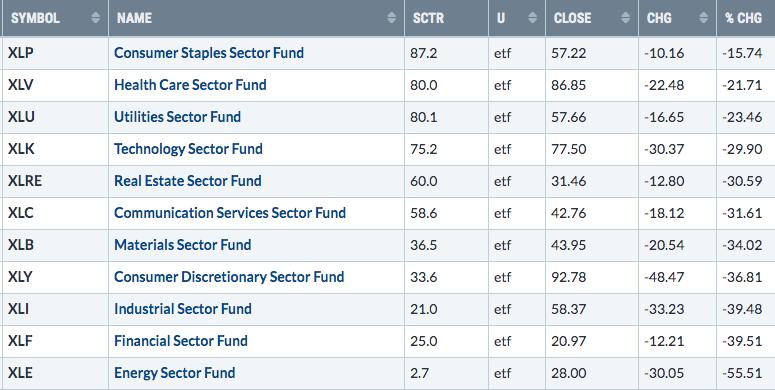
Trading within the consumer staples, utilities, and healthcare areas would seem to be the safest bets right now, although absolutely nothing is "safe" in this extremely volatile period. But perhaps trading safer stocks only during the trading day might make sense in order to avoid the huge gap downs that we seem to see every other day.
Sector/Industry Focus
Trading a highly volatile market can be exceptionally dangerous. One strategy to try to minimize risk on short-term trades is to trade stocks that are inherently less volatile, as I discussed above. That would include mostly the defensive sectors. Of particular note has been the consumer staples (XLP) sector, which from the two tables above, has held up best.
Nondurable household products ($DJUSHN) has held up extremely well. Here's a price chart (with the relative chart in the panel below):
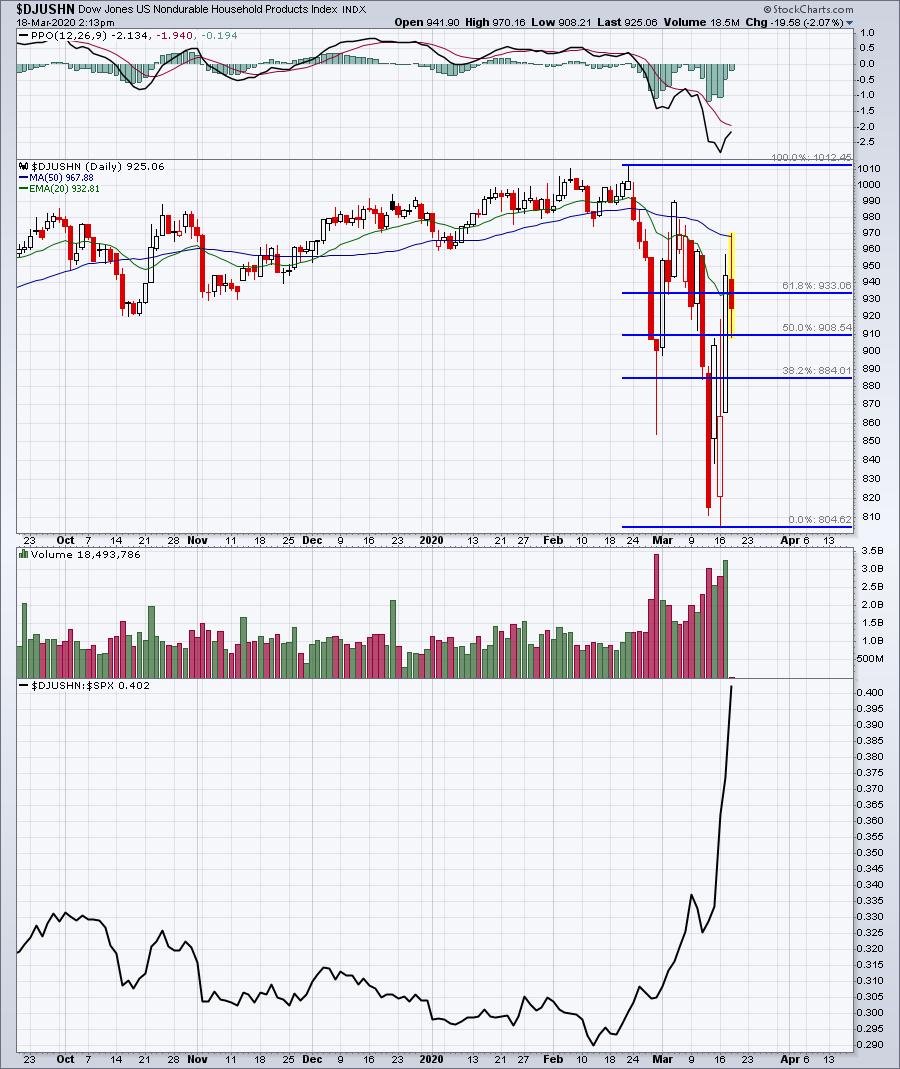
Can the strength be sustained to clear the Fibonacci 61.8% retracement level. There's a lot of volatility around that area.
Active Trade Alerts
We have no active trade alerts at this time. Yesterday, the VIX closed at 83, its highest close EVER. Trading remains very dangerous, although I would expect that we're very close to a bottom, if not at one, given the extremely high fear in the market currently.
Strong Earnings ChartList (SECL)
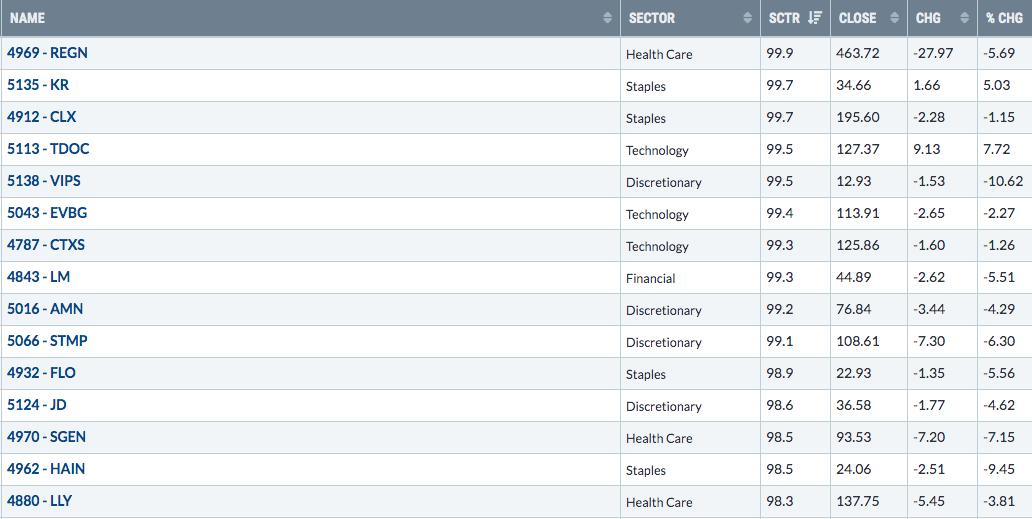
The volatility is keeping me on the sidelines from trying to trade significant amounts of individual stocks. One trading consideration might be to view the SECL from a SCTR-top-down listing to see which of these companies with strong earnings are continuing to hold up well during this market environment. They're likely doing so for a reason. Here are the top 15 SCTRs at this time:
Movers & Shakers
Another idea in looking for better performing stocks would be to pull up the large caps in SCTR order and search by "consumer staples". Here are the top 10 results:
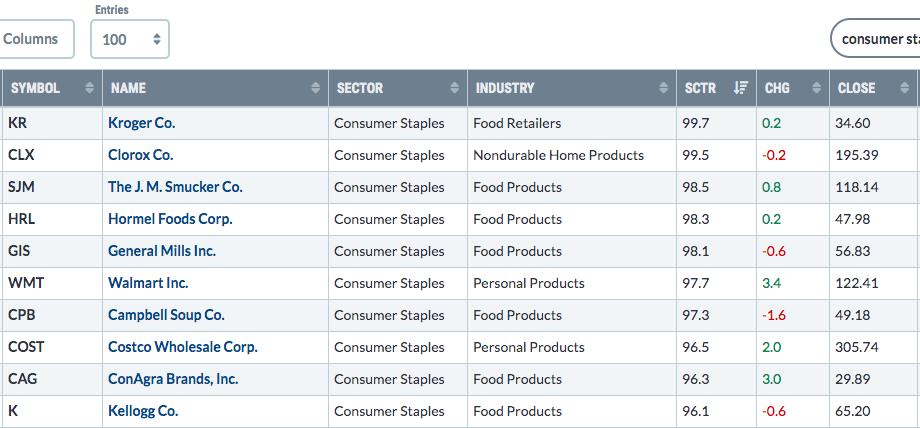
If you want to trade the market, and especially individual stocks, the names above would represent more defensive candidates.
Earnings Reports
Here are the key earnings reports for this week, featuring stocks with market caps of more than $10 billion. I also include a few select companies with market caps below $10 billion. Finally, any portfolio stocks (or active trade alerts) that will be reporting results are highlighted in BOLD. An asterisk (*) is placed next to stocks that are showing excellent relative strength heading into their respective earnings report. In my judgment, I'd expect strong results and guidance, although correctly predicting which way a stock might gap after an earnings report is much more difficult. If you decide to hold a stock into earnings, please understand the significant short-term risk that you are taking. Please be sure to check for earnings dates for any companies you own or are considering owning:
Wednesday, March 18:
GIS, TCOM. Others less than $10 bil: IAA, FIVE, WSM, NIO
Thursday, March 19:
ACN, CTAS, LEN. Others less than $10 bil: CRWD, DRI, GDS, MOMO, OLLI, CMC
Friday, March 20:
TIF
Economic Reports
February housing starts: 1,599,000 (actual) vs. 1,520,000 (estimate)
February building permits: 1,464,000 (actual) vs. 1,550,000 (estimate)
Happy trading!
Tom