
EB Daily Market Report - Thursday, March 19, 2020
Executive Market Summary
- Futures were lower once again this morning, but buyers were awaiting the opening bell again
- The Dow Jones was down 700 points earlier, but quickly gained back 1000 points and has been mostly hovering in positive territory
- It's hard to believe, but that 1700 point swing seems mild compared to the past few weeks
- Initial jobless claims spiked to 281,000 this morning
- Crude oil ($WTIC) has spiked 22% to $24.89 per barrel, lifting energy shares (XLE, +2.88%)
- Consumer discretionary (XLY, +3.26%) and communication services (XLC, +3.25%) are the leading sectors
- Defensive groups have given up their recent leadership role - likely due to monthly options expiring tomorrow
- The 10 year treasury yield ($TNX) is down 20 basis points to 1.07%
- The U.S. Dollar (UUP, +2.41%) continues its astounding ascent
- We have no active trade alerts at this time
Market Outlook
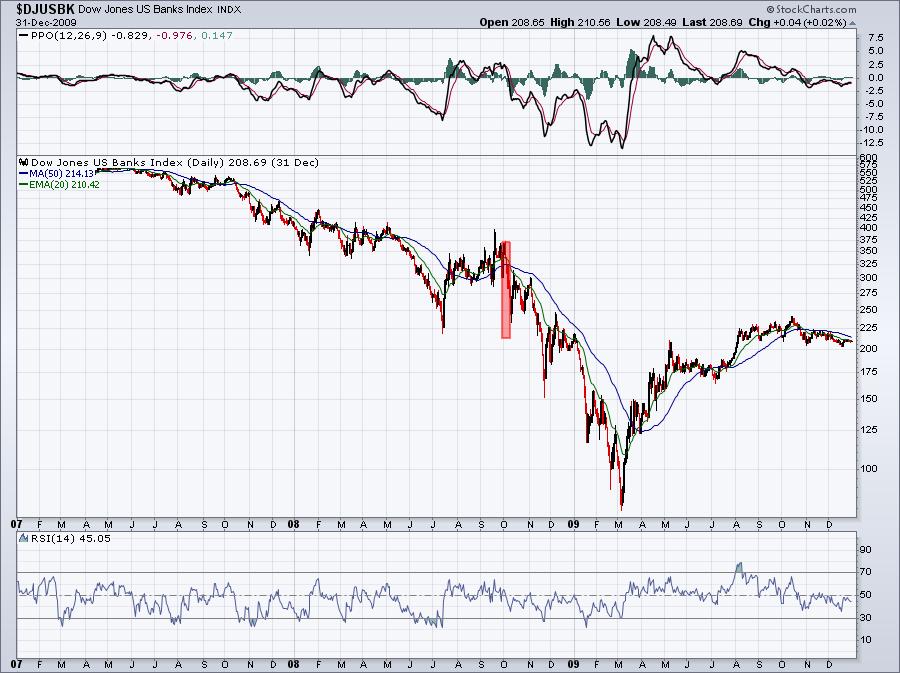
For historical perspective, I thought I'd provide you a look at the banks ($DJUSBK) during the October 2008 drop and compare it to the group's drop here in 2020:
2008:
2020:
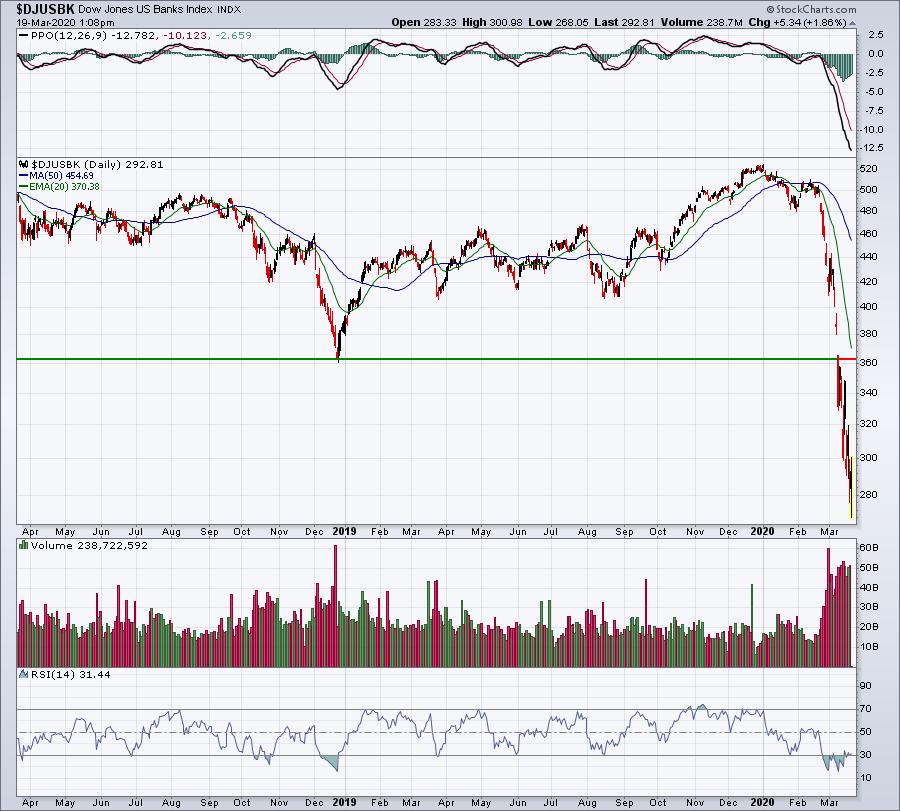
I suppose there are advantages and disadvantages to how the market and our economy were set up in 2020 vs. 2008 with regard to the heavy selling that followed. In 2020, we had record low unemployment and our economy was quite strong in terms of job growth, low interest rates, low inflation, etc. By the time October 2008 rolled around, our economy was already in very poor shape from the subprime loan mess. Our economy fell apart from a very weak place. One advantage we have now is that heading into this crisis, our economy was quite strong. A possible negative, however, is how quickly it's taken its toll, giving businesses almost zero time to plan an effective strategy. Everyone is "winging it".
Assuming that this virus and all of its implications are behind us later this year, I expect that record amounts of stimulus and pent up demand will likely return our growth back into positive territory. But what shape this all takes is anyone's guess right now. Uncertainty is driving the action right now and that's never a good thing.
Sector/Industry Focus
There are five sectors that currently show "breakouts" in accumulation/distribution. In my opinion, the strongest of them all is consumer staples (XLP), a defensive sector. During periods of high anxiety, people must still buy the things they need. Consumer discretionary (XLY) companies sell us the things we want. When economic conditions change for the worst, we still must buy toothpaste, deodorant, and toilet paper (apparently by the truck load). That's why we see many of these companies outperforming on a relative basis now. The bull market will not resume until traders are willing to accept more risk and buy the aggressive sectors. We're not there yet.
Here's a chart of the XLP. It's not pretty, but it's prettier than all the others:
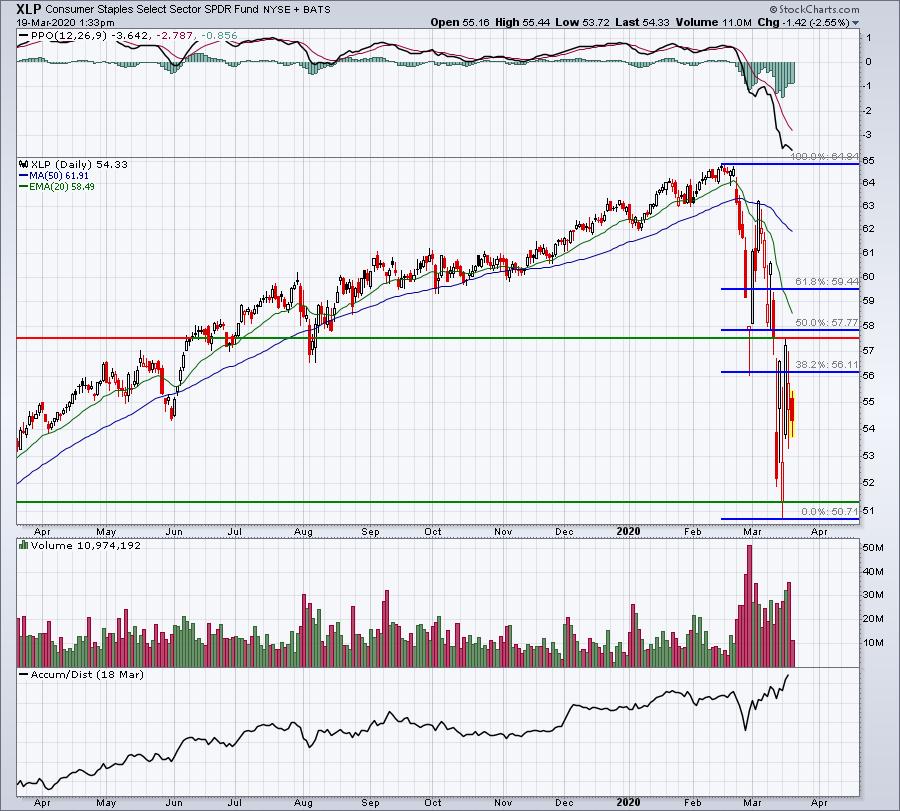
The bottom panel shows the strengthening accumulation/distribution. As money rotates out of treasuries, it's finding a home in consumer staples. My best guess is this group will likely have difficulty if and when the XLP hits overhead resistance in the 57.50-58.00 area. A stretch might be to 59 or so. My preference would be to see us bounce a bit more, then perhaps fall back to set a double bottom in the 2275-2350 area with the VIX falling from the current 70s and 80s - maybe to the 40s? Perhaps we could begin to build confidence and crawl back over the summer.
Active Trade Alerts
We have no active trade alerts at this time. Things could get very interesting later today and tomorrow. On the bulls' side, you have options expiring with max pain on many stocks well above current prices. However, the bears still have a Volatility Index ($VIX) reading of 77. The 5 day SMA of the VIX is now at 73.99, which tops the previous highs during Q4 2008.
Strong Earnings ChartList (SECL)
Some stocks are likely getting some benefit from options expiring tomorrow. There's a lot of in-the-money put premium that would evaporate quickly if our major indices could rally over the next couple days. One example of a stock that's seen a nice rally this week and is now trading above its max pain level is NFLX. Check out the chart:
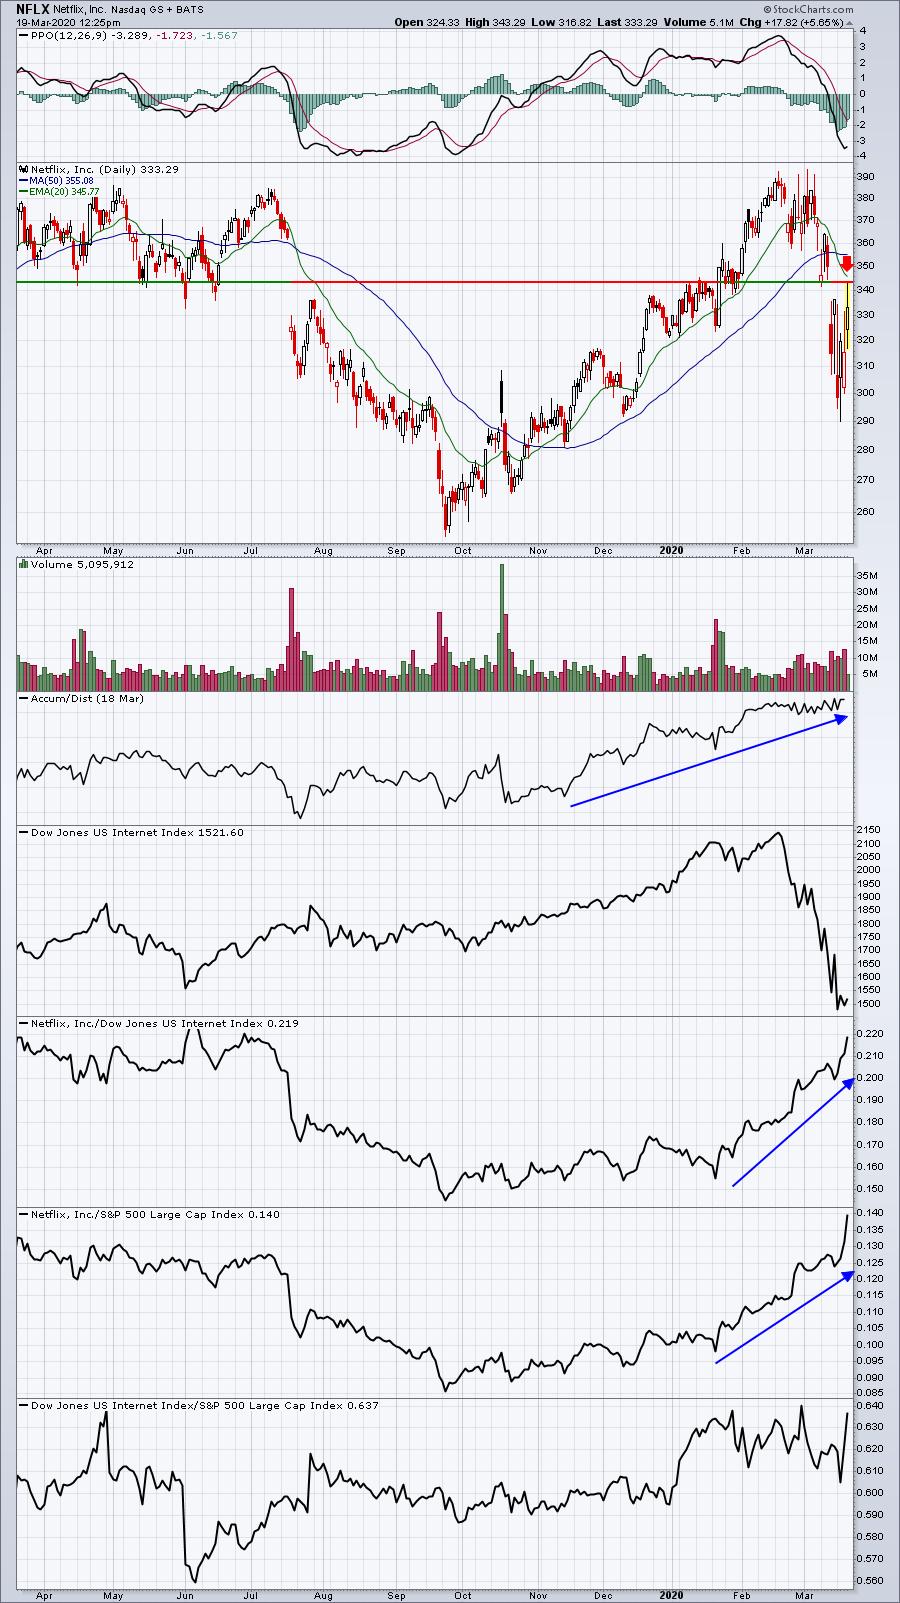
The red arrow marks the 20 day EMA resistance for NFLX. I'd like to see a couple closes above that moving average. Until then, it's likely a short-term sell. I actually like this one further out as it's not only a great company with a proven long-term track record, but it seems to be a coronavirus play as well since movie theaters are not a viable option.
Movers & Shakers
One of the top gainers in the S&P 500 today is FMC, which has soared 15% today. This company had lost nearly 50% of its market cap in the past month, but it managed to recently breakout to a new accumulation/distribution high. Check this out:
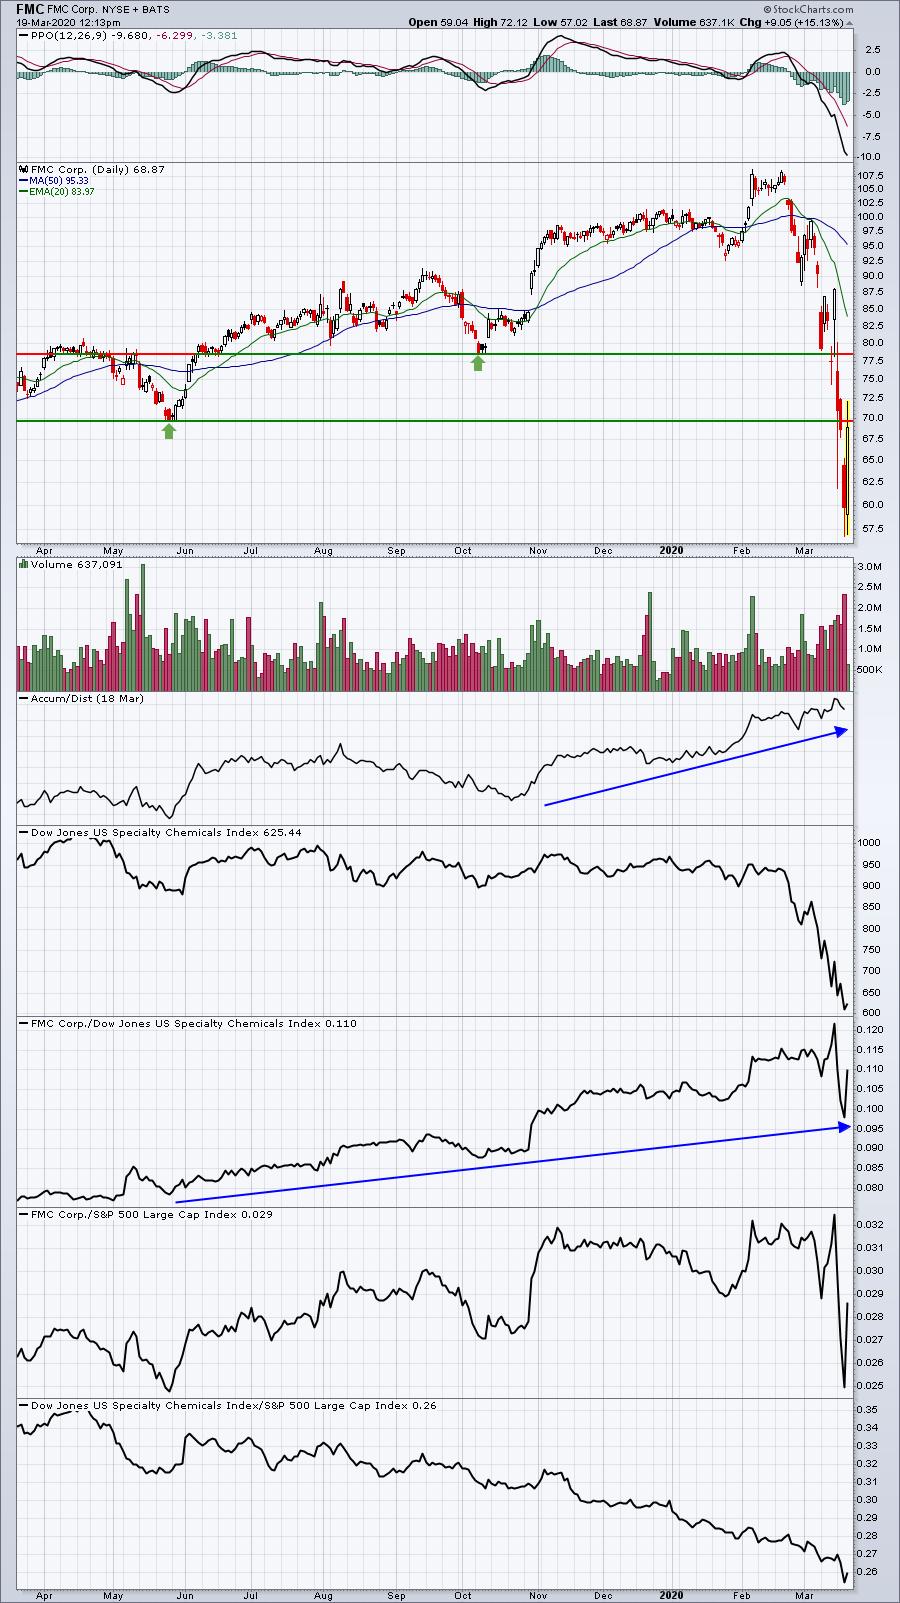
I've annotated two key price resistance levels for FMC to negotiate. After the big selling, I doubt we'll see much more buying near-term. The one true positive, however, is that the accumulation/distribution line suggests there's been buying during trading hours. This one might just need to base for awhile.
Earnings Reports
Here are the key earnings reports for this week, featuring stocks with market caps of more than $10 billion. I also include a few select companies with market caps below $10 billion. Finally, any portfolio stocks (or active trade alerts) that will be reporting results are highlighted in BOLD. An asterisk (*) is placed next to stocks that are showing excellent relative strength heading into their respective earnings report. In my judgment, I'd expect strong results and guidance, although correctly predicting which way a stock might gap after an earnings report is much more difficult. If you decide to hold a stock into earnings, please understand the significant short-term risk that you are taking. Please be sure to check for earnings dates for any companies you own or are considering owning:
Thursday, March 19:
ACN, CTAS, LEN. Others less than $10 bil: CRWD, DRI, GDS, MOMO, OLLI, CMC
Friday, March 20:
TIF
Economic Reports
Initial jobless claims: 281,000 (actual) vs. 220,000 (estimate)
March Philadelphia Fed Business Survey: -12.7 (actual) vs. 14.0 (estimate)
February leading indicators: +0.1% (actual) vs. +0.1% (estimate)
Happy trading!
Tom