
EB Daily Market Report (New Format) - Monday, March 23, 2020
New DMR Format
Because of the current market environment and extremely volatile action, I've decided to make a few changes to expedite the DMR being sent out every day. Since its inception, I've spent a lot of time preparing economic reports, reviewing earnings reports and charts for those companies reporting or about to report, Mover & Shakers, SECL trading candidates, etc. At some point, all of that will become very important again. But for now, it's busy work that keeps me from getting more ideas out to members earlier in the trading day. My goal as we move forward is to provide more information on potential trading candidates off of a new ChartList - "Strong AD". This is a look at accumulation/distribution and relative strength (SCTRs above 80). If we're going to consider trading stocks on the long side, we want to make sure they are stocks favored by Wall Street.
If you have a strong desire to SHORT stocks in this current environment, please send me an email to express your interest in that. Our informal surveys in the past have suggested that few members actually short....or enjoy shorting. If you are one of those traders, I would really like to know. Just write me a note at "[email protected]" and provide me a little background as to the types of trades you look for. Intraday shorting of individual stocks only? Perhaps leveraged ETFs like the QID or SDS? I'd like to make sure our service includes what our members are looking for. I'll read every email, although responding to everyone can be difficult.
Anyhow, today I'm changing the DMR format to include the Executive Summary and Market Outlook (no changes here), and a new focus on the Strong AD ChartList.
Executive Market Summary
- Futures were testing "lock limit" down territory overnight, but rallied after the Fed said "we'll provide unlimited QE"
- Congress has yet to agree on a stimulus package, which is likely to be the first of a few
- U.S. indices have been mostly under selling pressure again today
- Energy (XLE), utilities (XLU), and financials (XLF) are leading the selling
- Crude oil ($WTIC) is down 2% and the 10 year treasury yield ($TNX) has shed 20 basis points to 0.74%
- The Volatility Index ($VIX) is up 3% to 68, perhaps a slight indication that panic is settling down a bit despite the lower prices; a potentially bullish development short-term
- We have no active trade alerts at this time
Market Outlook
We are at a fairly important technical area where a reversal would help to support the long-term secular bull market argument. Check out this 15 year chart of the S&P 500:
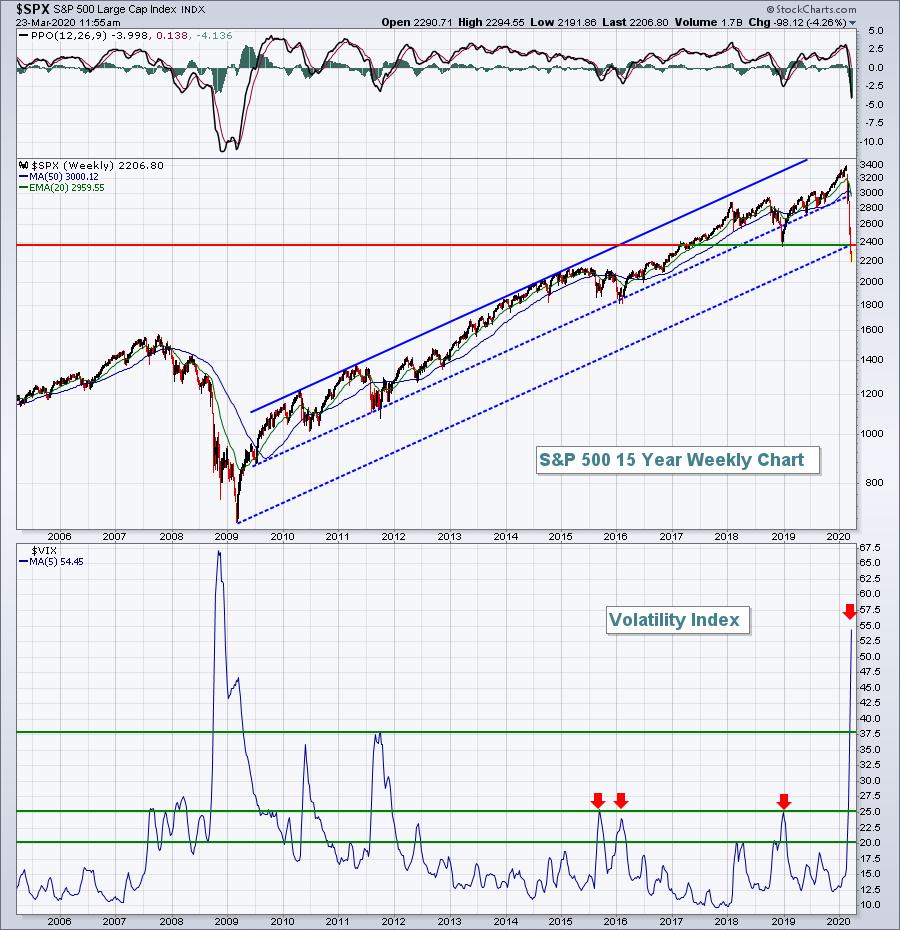
In order to continue the bullish channel off the 2009 low, we would need a reversal fairly soon. In addition, you can see that the 5 day SMA of the VIX has ballooned to a level rarely seen. The VIX today is barely higher despite another big move lower on our major indices. That could be at least a temporary sign that extreme fear is waning a bit.
AD Chart List
I am now scanning for stocks (whether recent earnings were good or bad) that have two characteristics: (1) their accumulation distribution line is rising, and (2) they show strong relative strength in the form of a SCTR score that was at least 80 as of Friday's close. I'll likely be adjusting this ChartList every day. Here are the top 20 SCTR scores of the stocks on this ChartList:
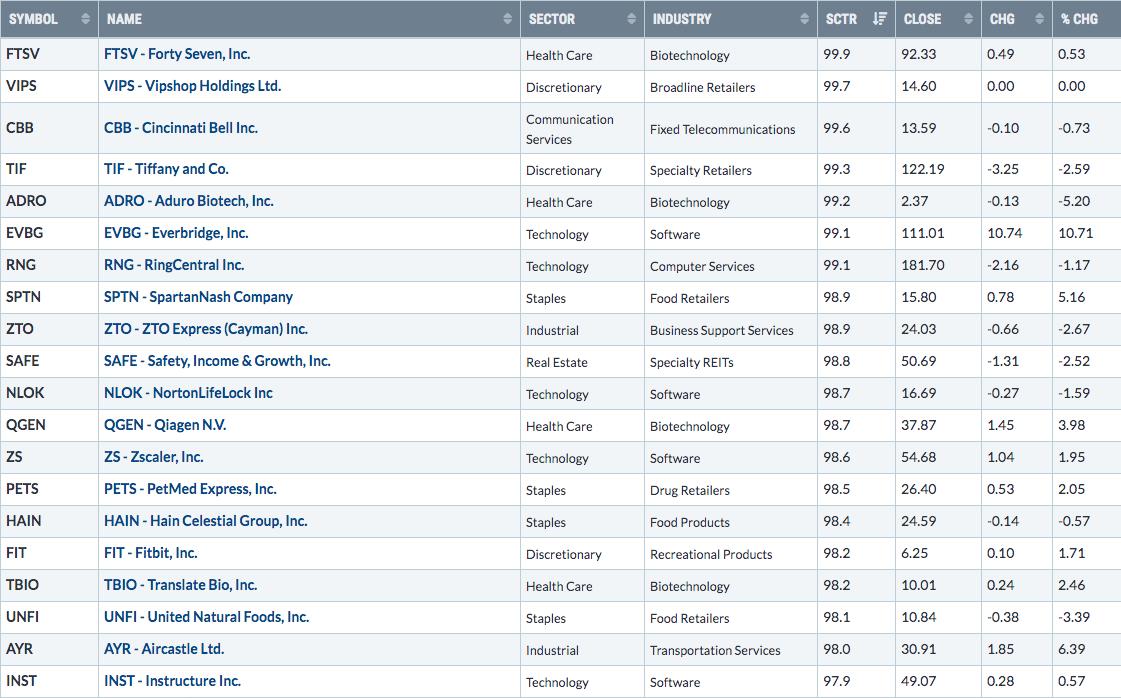
You can see that most of these stocks are continuing to hold up well despite another selloff in our major indices. I would not be jumping in now, but look at a stock like Everbridge, Inc. (EVBG):
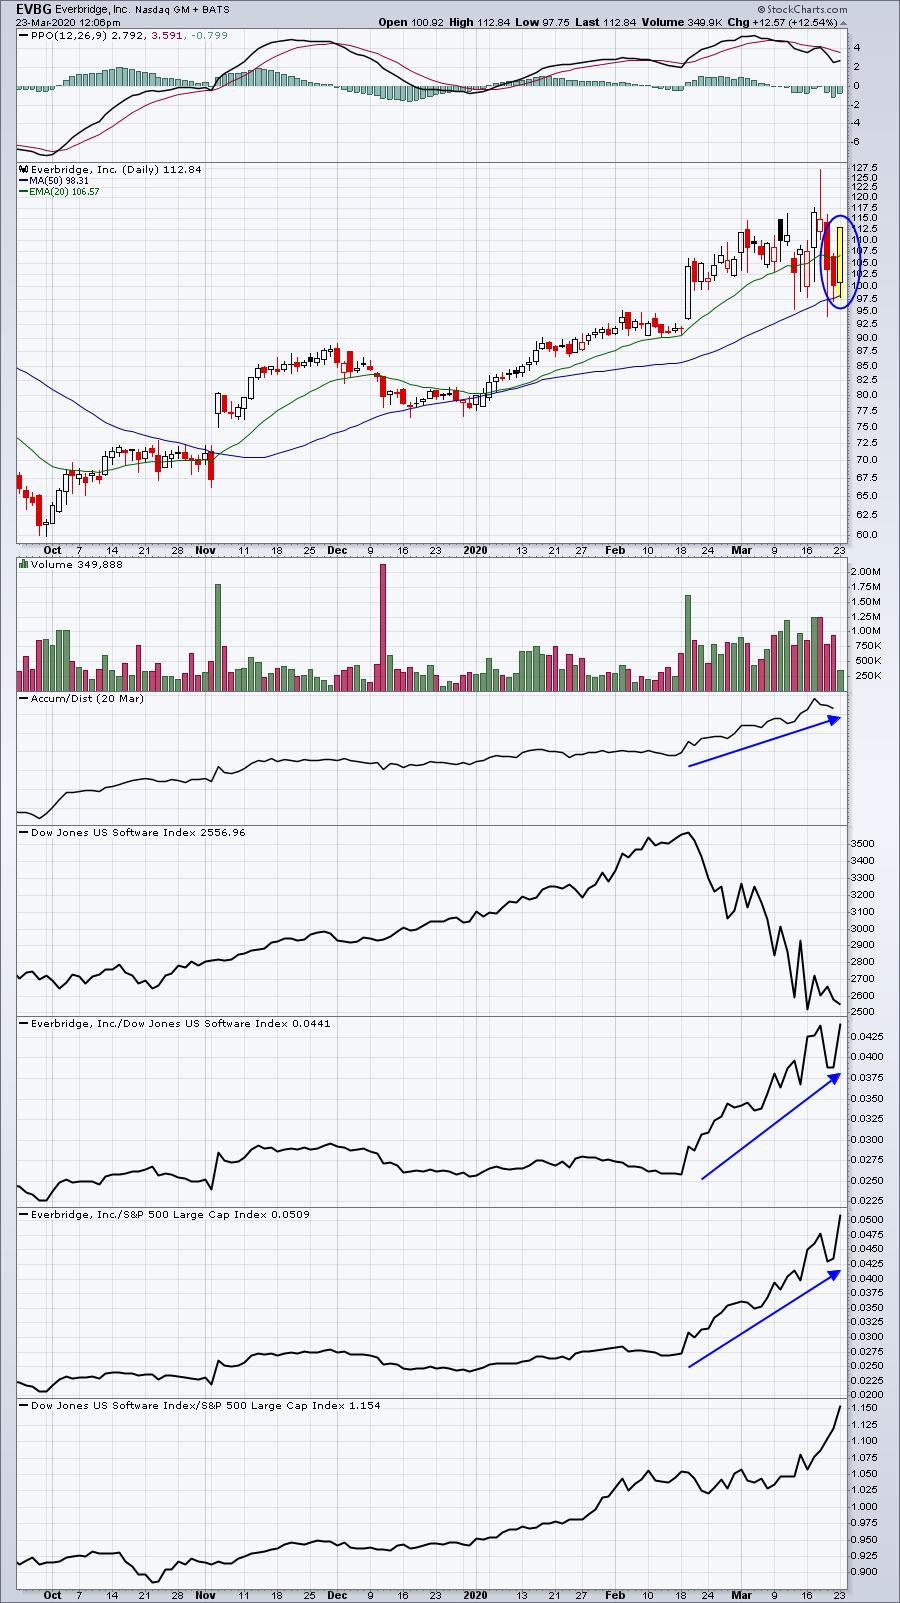
When trading a company, I believe a chart like EVBG provides better short-term opportunities. The idea is knowing which companies show relative strength and a rising AD line, and then considering entry in early action when they're down. A rising AD line tells us that the stock has a recent history of finishing much better than it starts. EVBG fits the bill.
A second example would be NLOK:
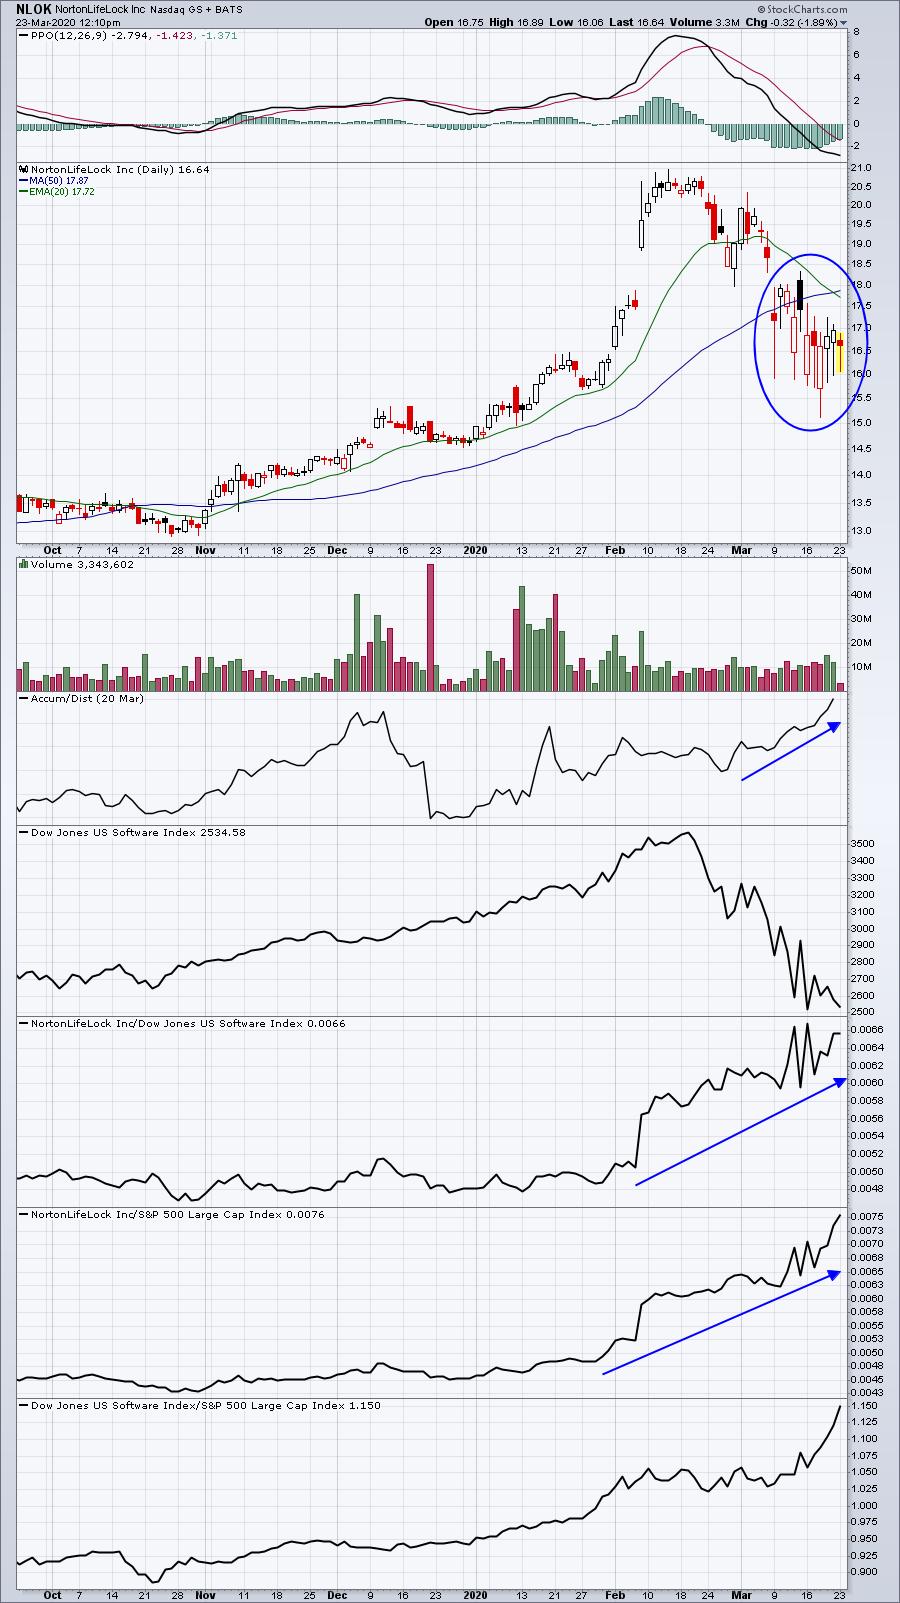
The blue circle highlights several hollow candles. That means NLOK has a recent history of closing above its open. If we take it a step further, if NLOK is down early in the day, but has a history of being accumulated during the day, then buying into weakness in the morning could prove to be a high reward to low risk trade. When I say "low risk", almost nothing in the market right now is low risk. But I would ABSOLUTELY make sure I keep an intraday stop in place to prevent small losses from becoming big losses. Also, in a zero commission environment, don't hesitate to take small profits. If you normally look to make $1,000 or more on a trade, making $300-$400 might not be bad at all.
Happy trading!
Tom