
EB Daily Market Report - Monday, March 30, 2020
Executive Market Summary
- Futures were volatile overnight, but our key indices did open higher
- The 10 year treasury yield ($TNX) is down 12 basis points to 0.63%, which is problematic for equities longer-term
- The U.S. Dollar (UUP) is fairly stable today and higher, keeping gold (GLD) at bay
- Abbott Labs (ABT) launches 5 minute coronavirus test and stock soars at open; currently higher by 8.2%
- Microsoft (MSFT) sees cloud demand surging close to 800%; currently higher by 6.2%
- Healthcare (XLV) and technology (XLK), two of the strongest sectors, are leading again today
- Real estate (XLRE) is lagging badly today and financials (XLF) are also weak given the falling TNX
- We have no active trade alerts at this time
Market Outlook
Our major indices are trading higher, continuing the uptrend that was established last week. In my view the 2650-2800 area on the S&P 500 is the major area to watch. That represents roughly the 38.2% to 50.0% Fibonacci retracement levels that I've written and spoken about continuously the past couple weeks. There's also a key gap resistance level at 2741 that could be very difficult to negotiate. I'd love to think that March 23rd marked the ultimate bottom and that we're now beginning a lengthy uptrend, but I'm nowhere close to that thinking at this point. Instead, we need to realize that every panic-induced selloff sees a rebound at some point. We're getting this one now. I do want to keep watching the composition of this rally for a couple of clues:
(1) Is the rally lifting the more aggressive sectors on a relative basis? (ie, do traders have an appetite for risk?)
(2) Which areas of the market is Wall Street gravitating to? It will be very important to follow relative strength among industry groups and individual stocks as well.
Here's today's sector leaderboard:
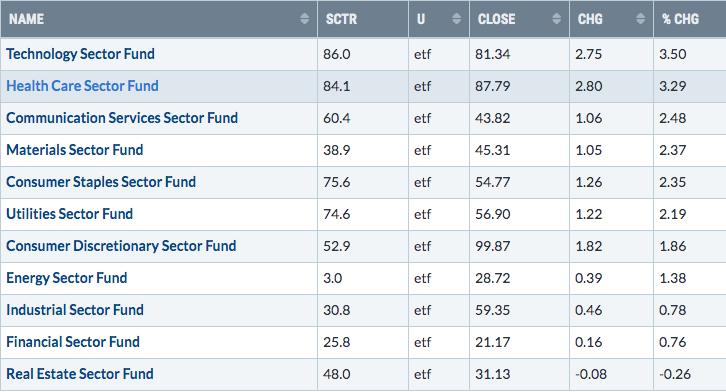
Technology (XLK) and healthcare (XLV) have been two of the best performing sectors and that continues today. If we look at a one month sector leaderboard, we'll see both the XLK and XLV near the top, joined by consumer staples (XLP):
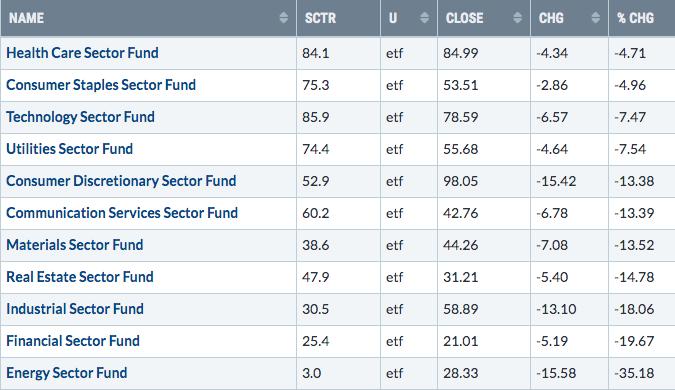
Until the stock market tells us differently, these are the sectors where we want to seek out trades.
Trading Ideas
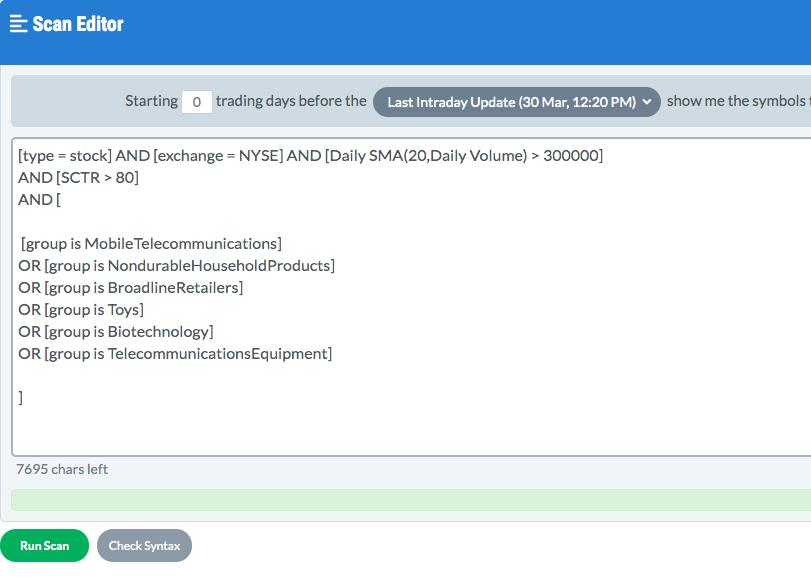
Over the weekend, I did a lot of research to see which groups have been outperforming over two key dates. Specifically, which industry groups outperformed from the S&P 500 top on February 19th to the S&P 500 bottom on March 23rd. I ran a scan that covered several of the top relative performing industry groups, further narrowed down by top SCTR scores (over 95). Here was how the scan was written:
Here were the results as of 12:20pm EST:
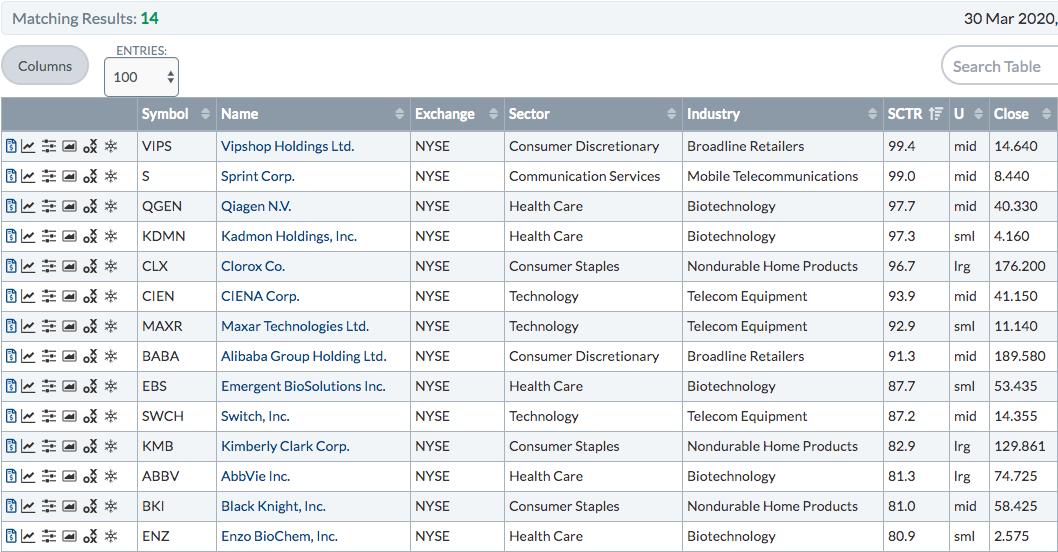
This is a solid list to start with. We have the strongest industry groups during the panicked selloff and we are only considering stocks with SCTRs > 80 from these groups.
I've discussed a few of these stocks recently, but let's take a look at two more:
CIEN:
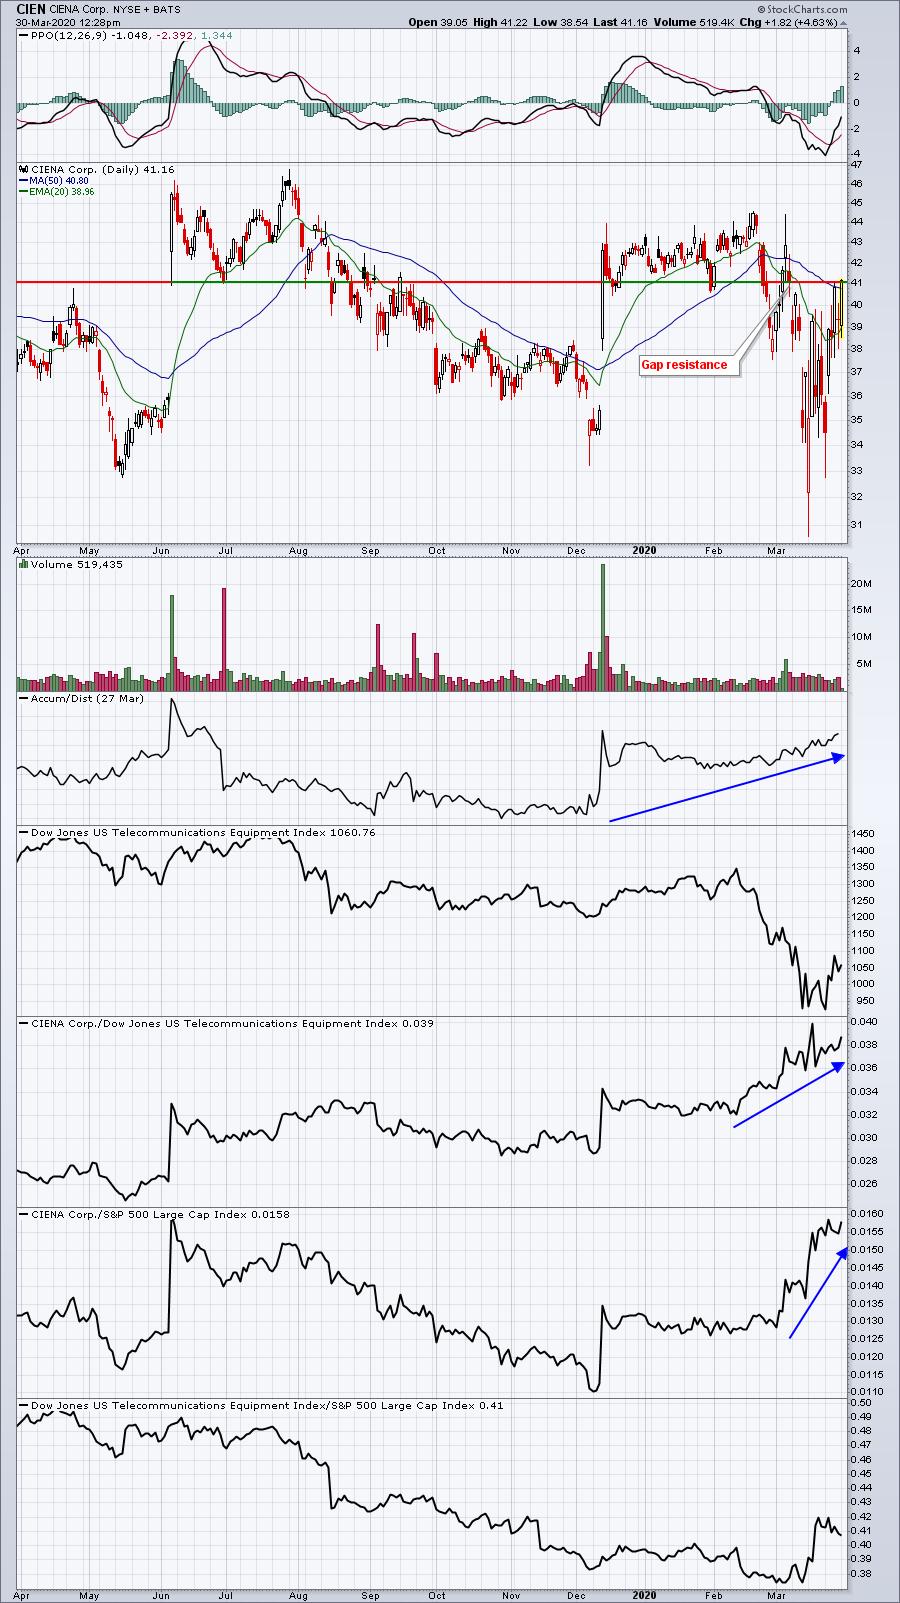
Relative strength and accumulation/distribution are both turning higher, likely a positive signal. I prefer trading a stock like this after the market opens on early weakness as it has a recent history of producing hollow candles, which represents closes above opens. So if I can buy a stock when it's below the open in early trading, recent history would seem to favor a recovery during the balance of the day. As always, however, and especially in this market environment, keep stops in place to protest the downside.
BKI:
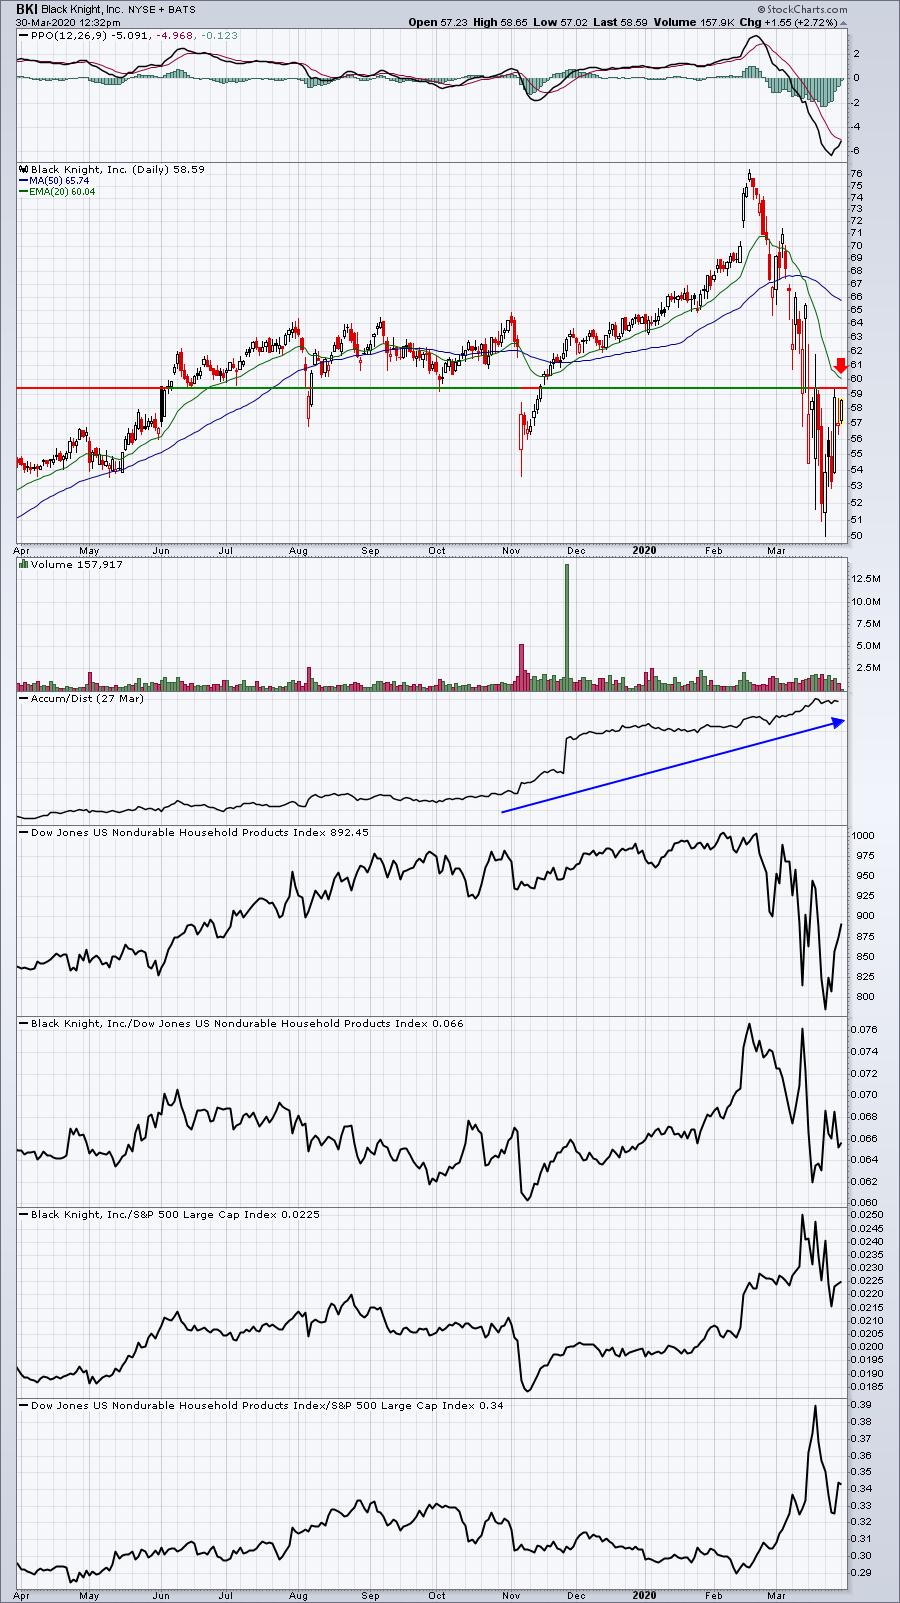
BKI remains in an overall downtrend, but its accumulation/distribution keeps rising. That can be a potential signal of a reversal ahead. We are rallying a bit, but clearing the 20 day EMA would be a big deal, especially on a closing basis. In the very bottom panel, you can see that nondurable household products have been volatile, but generally an outperforming industry group since mid-February.
Happy trading!
Tom